International Journal of Medical Physics, Clinical Engineering and Radiation Oncology
Vol. 1 No. 2 (2012) , Article ID: 21703 , 8 pages DOI:10.4236/ijmpcero.2012.12005
A Dual-Radiolabel Marker Quantifies Decrease in HT29 Xenograft Hypoxia Induced by Mild Temperature Hyperthermia
1Department of Radiation Oncology, University of Nebraska Medical Center, Omaha, USA
2Department of Medical Physics, Memorial Sloan-Kettering Cancer Center, New York, USA
3Munroe-Meyer Institute, University of Nebraska Medical Center, Omaha, USA
4Life Sciences Group, FUJIFILM Medical Systems USA, Inc., Woodbridge, USA
5Department of Epidemiology & Biostatistics, Memorial Sloan-Kettering Cancer Center, New York, USA
6Department of Radiation Oncology, Memorial Sloan-Kettering Cancer Center, New York, USA
7Department of Medical Physics, Memorial Sloan-Kettering Cancer Center, New York, USA
Email: mutianzhang@unmc.edu, david.gagne@fujimed.com, john.pizzonia@fujimed.com, lig@mskcc.org, lingc@mskcc.org, hummj@mskcc.org
Received May 8, 2012; revised June 10, 2012; accepted July 2, 2012
Keywords: Digital Autoradiography; IAZGP; Imaging Plate; Mild Temperature Hyperthermia; Tumor Hypoxia
ABSTRACT
Purpose: In this project, we developed novel methods to quantify changes in tumor hypoxia following a mild temperature hyperthermia (MTH) treatment in rat HT29 human colon adenocarcinoma xenograft. Materials and Methods: An exogenous hypoxia marker (IAZGP) was labeled with two radioisotopes of iodine (131I and 123I, respectively) to form two distinct tracers. The two tracers were injected into HT29-bearing nude rats 4-hour before and immediately following 41.5˚C, 45-minute mild hyperthermia treatment. The distributions of the two hypoxia tracers were obtained by performing digital autoradiography on tumor sections, and image processing resulted in quantitative information at 50 μm pixel size. Results: Following the hyperthermia treatment, there was a remarkable decrease in hypoxia tracer binding. The average whole tumor hypoxia tracer targeted fraction in five animals changed from 30.3% ± 9.7% to 13.0% ± 5.3% after the hyperthermia treatment (P = 0.001). Detailed pixel-by-pixel analysis of the image data revealed a decline in hypoxia tracer uptake after hyperthermia in most regions. However, there was concomitant emergence of some new regions of hypoxia identified by increased tracer uptake. In the control group, the overall hypoxia tracer targeted fraction remained almost constant, with some hypoxic tracer redistribution (putative acute hypoxia) observed. Conclusions: Reoxygenation occurred in the rat HT29 xenograft following MTH treatment. This was evident with preponderance of decreased hypoxia specific tracer uptake on tumor sections. Our methodology might be a useful tool in hypoxia study.
1. Introduction
The hypoxia-related tumor microenvironments have become major targets of cancer treatment [1,2]. It is believed that reducing tumor hypoxia during cancer treatment will improve the treatment prognosis. Locally applied mild temperature hyperthermia (MTH, 40.5˚C to 43˚C as per Urano et al. [3]) has been tested for its efficacy to increase tumor oxygenation. Trimodality treatment with concurrent 41˚C, 60-minute hyperthermia, Taxol, and radiation was reported to increase partial oxygen tension (pO2) in locally advanced breast cancer [4]. In treatment studies of animal tumors, hyperthermia was shown to improve median pO2 and reduce hypoxic fraction (fraction of hypoxic tumor cells) in dogs with spontaneous soft tissue sarcomas [5].
Animal studies conducted by Song et al. demonstrated that MTH alone might reduce tumor hypoxia in a variety of tumors [6]. Okajima et al. observed that 41.5˚C 1-hour hyperthermia could increase the average pO2 level in SCK murine mammary carcinoma from 4.4 mmHg to 12.6 mmHg [7]. Shakil et al. reported that mild temperature heating could increase blood flow and oxygenation in R3230AC tumors of Fischer rats between 0 to 24 hours after heating. In the reported animal studies, the hyperthermia temperature ranged from 38.5˚C to 43.5˚C, and the treatments lasted between 30 minutes to 2 hours [8]. The tumor response to hyperthermia treatment varied with animal model, tumor type and appeared to be a complicated function of thermal dose—typically pO2 level was increased with increasing temperature. Above 42˚C, hyperthermia treatments seemed to be less effecttive, which was attributed in part to the thermal damage of blood vessels [9].
Most existing animal studies, however, were performed on tissue levels through pO2 or blood flow measurements. In the recent years, a variety of exogenous hypoxia markers (e.g. 2-nitroimidazole derivatives) have been used to identify changes in hypoxia through the injection of two hypoxia markers and immunohistochemistry staining [10]. Sun et al. developed a dual-hypoxia marker approach using pimonidazole and EF5 to measure changes in the hypoxia microdistribution resulting from MTH at cellular level [11]. The limitation of such an approach is that, because no two tracers are biologically identical, the use of different markers will inevitably encounter the discrepancies between these markers. In addition, different hypoxia markers do not necessarily represent the same hypoxia status or the same hypoxic cells.
In the present study, we proposed a novel approach of measuring tumor hypoxia changes with a single hypoxia tracer. A hypoxia marker, 1-(4-deoxy-4-iodo-beta-Dgalactopyranosyl)-2-nitroimidazole, aka β-D-iodinated azomycin galactopyranoside (IAZGP), was chosen for this purpose. IAZGP was synthesized in an effort to produce a hypoxia tracer with rapid plasma clearance in humans and a renal excretion of >99% of metabolized and non-metabolized agent [12]. In vivo biodistribution studies showed that, in rodent tumor models the IAZGP concentration decreased by 10-fold in blood and normal tissues 3 to 5 hours post-administration; but IAZGP accumulated in the tumors thus the tumor-to-blood and tumor-to-muscle ratios of tissue-specific activities increased steadily and was maximal between 5 to 10 hours post-injection [12,13]. Nuclear medicine studies associated IAZGP uptake with low tumor pO2 level in rodent tumors [14,15]. Data of relative IAZGP uptake have been collected for HT29 cells cultured at various pO2 levels from anoxic to normoxic (unpublished data).
Compared with other hypoxia markers, IAZGP is unique in that it can be labeled with a variety of iodine radioisotopes suitable for autoradiography. The essential postulate of our dual-radiolabel approach is that, the radiolabeled IAGZP molecules, regardless of the iodine isotopes they carry, are metabolized in the same manner within tumor cells at the same pO2 level. Therefore, an IAZGP dose labeled with an iodine radioisotope will snapshoot tumor hypoxia status following the moment of its injection. The second IAZGP dose, labeled with another iodine radioisotope, is administered at a later time (>3 hr) when the blood concentration of the first IAZGP dose is sufficiently low, so as not to compromise the measurement obtained with the second tracer. If an intervention occurs between the two IAZGP doses, the distributions of the two isotopes within the tumor will indicate the hypoxia status preand post-intervention. The radioactivity distribution in tumor sections could be measured using digital autoradiography (DAR) on phosphor imaging plates. The imaging plate exhibits a linear response to radiation dose, large dynamic range, and high sensitivity [16,17]. Comparison of the two isotopes can reveal changes induced by the intervention. In this project, 123I and 131I were selected to label IAZGP, because their half-lives (13.2 hours and 8.05 days) are sufficiently apart and thus suitable for dual-isotopic DAR study.
The approach of using a single hypoxia marker removes the limitations associated with the multiple-hypoxia marker techniques. DAR on imaging plate facilitates the quantification of tumor hypoxia changes on microscopic to loco-regional levels. In this project, we attempted to establish the methodology to detect temporal and spatial changes in tumor hypoxia, and to quantify the hypoxia changes in HT29 tumor models following a MTH treatment.
2. Materials and Methods
2.1. Animal Preparation
NIH-rnu nude rats (NCI-Frederick Cancer Research, Frederick, MD) of 5 - 6 weeks old were used to prepare for the MTH experiment. To grow the HT29 tumors, the rats were anesthetized by inhalation of isoflurane mixed at 1.5% v/v in 1.5 L/min oxygen flow, and then 2 × 10⁶ cultured HT29 cells (suspended in 0.9% sodium chloride injection, USP) were subcutaneously injected into the right hind limb of each rat. The tumors were allowed to grow for four weeks before the following experiments.
This study was conducted under the auspices of an Institutional Animal Care and Use Committee-approved animal protocol. The animals used in this study were maintained and used in accordance with the guidelines of the Research Animal Resource Center, Memorial SloanKettering Cancer Center (MSKCC). The radioactive materials were managed and used in accordance with the guidelines established by the Radiation Safety Office, MSKCC.
2.2. Preparation of Radiolabeled IAZGP
IAZGP was separately labeled with 123I or 131I according to the procedure described by Schneider et al. [12] with minor modifications. Briefly, 10 - 30 mL of Na123I (MDS Nordion, Vancouver, Canada) or 5 - 7 mL of Na131I (Perkin-Elmer, MA, USA) in 0.1 N NaOH was transferred into a 0.1 mL or 0.5 mL Reacti-Vial (Pierce, IL, USA), to which 50 - 100 mL of anhydrous ethanol (Sigma-Aldrich, MI, USA) was added. The solvent was evaporated under a stream of nitrogen. This step was repeated until dry Na123I or Na131I was obtained. To the dry residue, 1 - 2 mg of non-radioactive IAZGP in 20 mL of dimethylformamide was added, and the reaction mixture was heated at 82˚C - 86˚C for 2 - 5 hours. Then, the solvent was evaporated, and the residue dissolved in 0.2 mL of water, which was passed through an anion exchange column (AG1X8, 200 - 400 mesh, approx. 40 mg). The eluant was passed through a 0.22 mm Millex filter (Millipore, MA, USA) and collected in a 1 mL vial. An aliquot of the final product was applied to a C18 HPLC (High-performance liquid chromatography) analytical column (Platinum 4.6 × 250 mm, Alltech, IL, USA) eluted with acetonitrile/water (10/90) at a flow rate of 2 mL/min for quality control.
2.3. Hyperthermia and IAZGP Administration
Ten HT29-bearing rats were divided into three groups: the hyperthermia-treatment group, the body-temperature control group, and the co-injection control group.
The hyperthermia-treatment study group contained five rats (numbered H1 through H5) for the measurement of tumor response to the MTH treatment. The rats were individually anesthetized using 1.5% v/v isoflurane in air flow. Each rat was injected with 0.2 mCi 131I-IAZGP through the tail vein. After the injection, the animal was released to the cage for normal activities. Four hours later, the rat was anesthetized again and immobilized on a plastic support couch. The tumor-bearing limb was extended through a slot in the bottom of the support into water bath so that the entire tumor was submerged in water. The rat remained in this state for 45 minutes. The water temperature was maintained at 41.5˚C ± 0.1˚C through intermittent heating and forced circulation. Immediately after the MTH administration, 2 - 3 mCi 123I-IAZGP was injected into each rat.
The body-temperature control group contained three rats (numbered B1 through B3) to provide a baseline for the hyperthermia-treatment group. The animals were treated with the same procedure as the hyperthermia group, except that at four hours after the injection of 0.2 mCi 131I-IAZGP, the MTH treatment was replaced by a 45-minute anesthesia session, during which the rats remained in a plastic box to maintain their body temperature. 2 - 3 mCi 123I-IAZGP was injected to each animal by the end of the anesthesia session.
The co-injection group contained two rats (numbered C1 and C2) to examine the congruence of 123I-IAZGP and 131I-IAZGP distributions within the same tumor. The rats were anesthetized, and 0.15 mCi 131I-IAZGP and 2 - 3 mCi 123I-IAZGP were mixed and injected into each rat. After the final injection, all animals were returned to their cages for normal activities. They were euthanized three hours later by isoflurane overdose.
2.4. Digital Autoradiography
Following the euthanasia, the whole tumor was promptly excised and frozen in Tissue-Tek® optimal cutting temperature compound (Ted Pella, Inc., Redding, CA). Serial 8-μm sections were obtained from each tumor at five levels 0.5 to 1 mm apart with a Microm HM500 cryostat microtome (Microm International GmbH, Germany), and mounted on glass microscope slides. After air-dried, these sections, together with three 14C microscale standards (Amersham Biosciences UK Limited) and three 131I tissue reference sources, were exposed to a FUJIFILM BAS-MS2325 imaging plate (Fuji Photo Film, Japan), the size of which allowed for the arrangement of up to 30 microslides in a single cassette. The 14C standards served as image registration markers, and the 131I references were used for the separation of 131I and 123I distributions (see the next subsection). The 131I sources were prepared in the form of tumor sections from spare HT29-bearing rats, each injected with 0.2 mCi 131I-IAZGP only. To prevent their relative motion, the slides were glued on a paperboard attached to the bottom of the imaging plate cassette.
Two DAR images were taken for the specimens on the same imaging plate: the first exposure lasted for 30 hours when most 123I had decayed; the second exposure started five days later when the remaining 123I was negligible. This second image was 7-day long for sufficient signals resulting from the 131I-IAZGP only. When the exposures were completed, the imaging plate was scanned on an FLA-5100 image analyzer (FUJIFILM Medical Systems, USA), a multipurpose laser based scanner. It was set up with a laser diode 635 nm laser and a filter, capable of reading up to a 40 × 46 cm selectable scan area with pixel sizes ranging 10 to 200 microns. In the present study, images were acquired using the FLA5000 ImageReader version 1.0 software to capture 50-micron pixel images at the automatically fixed voltage. The resulting 16-bit data files were converted to photo-stimulated luminescence (PSL) units across 5 orders of magnitude.
2.5. Image Processing
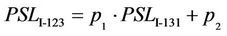
The DAR images were processed using in-house MATLAB® (The MathWorks, Inc.) programs. First, they were co-registered using the three 14C microscale standards as fiducial markers through the maximization of their correlation coefficient. Since there was virtually no 123I contribution on the second image, the dose distributions of 131I and 123I could be solved using a simple equation based on the additive property of radiation dose:
 (1)
(1)
 (a)
(a)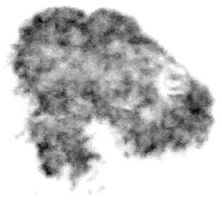 (b)
(b) (c)
(c)
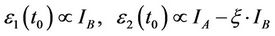
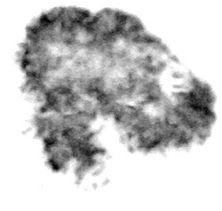
Figure 1. Sample DAR images illustrating image subtraction. 131I-IAZGP and 123I-IAZGP were injected at 5 hours apart, and the HT29 tumor was treated with 41.5˚C water for 45 minutes before the second injection. (a) Image of both isotopes derived from the first exposure. (b) Image of 131I from the second exposure. (c) Image of 123I from image subtraction. Image size is 340-pixel × 340-pixel, pixel size is 50 microns.
 (a)
(a)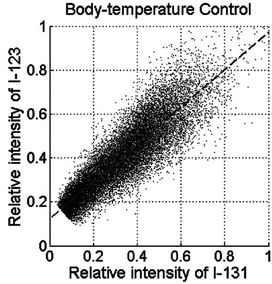 (b)
(b)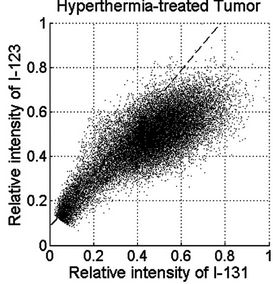 (c)
(c)
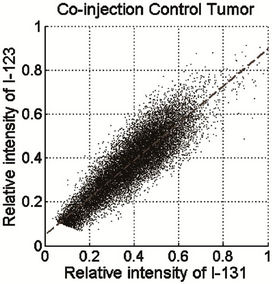
Figure 2. PSL scattergram of 123I versus 131I in tumor sections. The tumor sections were obtained from (a) co-injection control, (b) body-temperature control, and (c) MTH-treated tumor.
In the above formula,  and
and  are the radiation dose distributions of 131I and 123I,
  and
and  are the PSL intensity arrays of the two images, and ξ is the ratio of the total PSL readings of the 131I reference sources in the first and second images.
The operation expressed by Equation (1), also termed image subtraction, was accomplished by removing the almost negligible background readings and applying the equation to the two images for pixel-by-pixel computation. Figure 1 shows the two images of a tumor section post-registration, and the 123I image resulted from image subtraction. The 123I and 131I images were further processed by the Richardson-Lucy deconvolution algorithm [18,19], using experimentally determined point spread function of the radioisotopes, to recover the linear proportion between the pixel intensity and the radiotracer concentration [20].
2.6. Evaluation of Hypoxic Fraction
The tumor hypoxic fraction, represented by the uptake of IAZGP labeled with each isotope, was calculated for each tumor section as follows. First, the PSL intensity of the two isotopes was normalized using the scattergram of 123I versus 131I on the same tumor section as shown in Figure 2. The scattergrams of the co-injection (Figure 2(a)) and body-temperature controls (Figure 2(b)) exhibited oblique but straight bands; in contrast, the hyperthermia-treated tumors resulted in a bi-phasic relationship: the high-PSL intensity portion of the data showed a reduced slope relative to the low-intensity PSL portion (Figure 2(c)). Linear regression of the low-PSL portions in Figures 2(a) and (b), corresponding to normoxic tumor tissues, yielded lines that were not statistically different from that obtained from the entire mono-phasic data. This result suggested that the PSL normalization parameters between the hypoxia tracers could be obtained through a linear regression of the entire dataset in the scattergram of the co-injected and control tumor sections, or of the low-PSL phase in the scattergram of the MTH-treated tumor sections, i.e.
 (2)
(2)
where  and
and  are constants. The fitted lines are plotted in all the panels of Figure 2. Equation (2) translates the PSL of 131I into the counterpart of 123I, and the converted PSL values played the role of self-control in the same tumor section.
The PSL intensity histograms of the images after deconvolution are shown in Figure 3. It was observed that the 123I histogram exhibited a peak at the low PSL end, which could be closely fitted using a Gaussian curve  , where
  is the center of the peak.
A threshold was arbitrarily selected as , above which the pixels could be defined as hypoxic regions due to high IAZGP retention, and this threshold removed about 95% of normoxic regions from the analysis. The threshold of 131I on the same tumor section could be calculated using Equation (2) from the 123I threshold, and Figure 3 shows that 131I and 123I share the same threshold in the histograms after normalization using Equation (2).
3. Results
3.1. Animal Experiments and Digital Autoradiography
weeks after the HT29 cell injection. At this stage, the animals weighed 140 to 190 grams, and the tumors weighed 0.6 to 1.6 grams with the maximum dimension
 (a)
(a)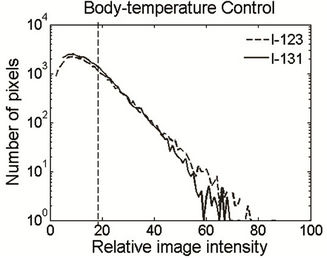 (b)
(b)
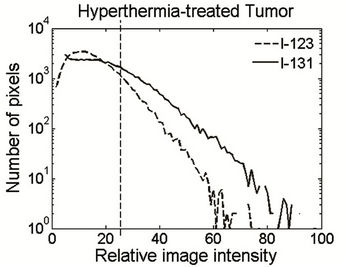
Figure 3. PSL histogram of 131I and 123I on the same tumor section after image deconvolution. The sections were derived from a body-temperature control tumor (a) and a hyperthermia-treated tumor (b). Channel 100 corresponds to the maximum pixel value of 123I, and the dashed line marks the threshold for the hypoxic regions on each section. The PSL values of 131I were converted using Equation (2) and normalized against the maximum of 123I.
of 1 to 1.5 cm. The radiolabeled IAZGP doses were prepared on the same day of the animal experiment. The overall radiochemical yields of 123I-IAZGP and 131I-IAZGP were 48% ± 3% and 56% ± 5%, respectively. Total synthesis time was 7.1 ± 0.8 hours for 123I-IAZGP and 7.3 ± 0.3 hours for 131I-IAZGP. Radiochemical purity was 100% for both tracers.
The animal experiments were conducted as described above. Previous measurements of the intra-tumor temperatures in rat tumor models showed that the tumors reached target temperature in 4 to 5 minutes. Usually the final tumor temperature was 0.5˚C lower than the water temperature. After the animals were euthanized and the tumors were excised, every step including tumor sectioning and the first DAR image was performed in a timely fashion to preserve the 123I activity. After the two DAR images were acquired for the tumor sections, image registration was completed with our in-house rigid registration program. The registration accuracy was of the order of one tenth of a pixel according to our analysis.
3.2. Consistency of 131I and 123I in Hypoxia Detection
Analysis of autoradiographic sections from animals coinjected with 131I-IAZGP and 123I-IAZGP established consistency between the distributions of the two tracers. The linear relationship between the PSL values was evident when the 131I pixel intensities are plotted versus 123I as a scattergram (Figure 2(a)). The consistency of 131I and 123I was further evaluated by independent estimation of the fraction of the tumor which was hypoxic determined by each tracer. As expected, 123I and 131I yielded almost identical hypoxic fraction: in tumor C1, for instance, the hypoxic fraction measured with 123I and 131I was 17.9% and 16.9%, respectively. This result was found to be fairly uniform among all sections.
3.3. Visual Examination of Tracer Distributions
In general, the two isotopes had visually similar distributions on tumor sections from the co-injection group, but the tumor sections from the MTH group showed more marked changes between the 131I and 123I distributions. Figure 4 illustrates a representative MTH-treated tumor section, where the two panels reflect the 131I- (pre-treatment) and 123I-(post-treatment) IAZGP distributions, respectively. One can see a reduction in the tumor hypoxia or partial retreat from several of the original locations of the IAZGP as a consequence of MTH treatment. There is also the emergence of a small number of newly-developed hypoxic foci. Whereas regions of hypoxia retreat and growth were also observed on images from tumor sections of the body-temperature controls, these differences, which can be purported to be
 (a)
(a)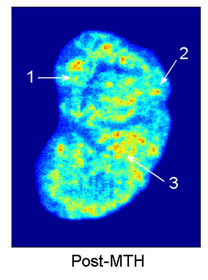 (b)
(b)
Figure 4. Tumor hypoxia changes observed in a hyperthermia-treated tumor between (a) 131I and (b) 123I images. Three types of tumor hypoxia response are distinguished in this tumor: 1) hypoxia reduced after treatment, 2) hypoxia persisted, and 3) new hypoxic region emerged. The images are normalized to have the same total PSL values. The color map represents relative image intensity with warmer colors for higher IAZGP uptake thus lower oxygen tension.
the result of changes in micro-regional blood flow leading to acute hypoxic changes, were of far lesser magnitude. These observations provide supporting evidence for the non-stationary nature of hypoxia within tumors, extensively reported by others [21-23]. Such intermittent changes in hypoxia over time might confound the actual perturbation induced changes resulting from MTH. However, the magnitude of the changes in the MTH group is considerably larger and readily observed in autoradiographic images.
3.4. Hypoxia Changes Induced by MTH Treatment
The superimposed image intensity histograms of the two tracers (Figure 3(a)) suggest that, without the MTH treatment, the tumor hypoxic fraction remained stable over several hours during which the experiment was conducted. In the MTH treatment group, the histogram of 123I (Figure 3(b)) resulted in lower values and a steeper terminal slope than 131I, a consequence of a reduction in the hypoxic fraction of the tumor, or alternatively tumor re-oxygenation. In the hyperthermia group and the bodytemperature group, the histogram of 131I monotonously declined with the PSL level, and this phenomenon could be explained by the fact that the IAZGP clearance from the normoxic cells was much more rapid than from the hypoxic cells.
The quantitative results for the measured whole tumor hypoxic fraction for the controls and the hyperthermiatreatment tumors are summarized in Figure 5. In the body-temperature controls, the observable changes in loco-regional hypoxia seen on individual sections did not result in statistically significant changes in the hypoxic fraction of the individual tumors. The average hypoxic
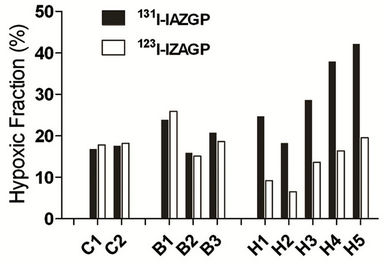
Figure 5. Comparison of the whole tumor hypoxic fraction measured by 131I-IAZGP and 123I-IAZGP in all tumors. In the hyperthermia-treated tumors (H1 through H5), the hypoxia fraction after the treatment (measured by 123I-IAZGP) remarkably decreased, whereas the hypoxic fraction remained nearly unchanged in the controls (B1 through B3).
fraction of the three body-temperature control tumors changed from 20.2% ± 4.0% to 20.9% ± 5.8% between the two IAZGP injections, with a P-value of 0.651 (paired t-test). For the hyperthermia study group, the hypoxic fraction changed from 18% - 42% pre-MTH to post-hyperthermia values of 7% - 20% (spread among 5 animals). The average hypoxic fraction of the whole tumor was 30.3% ± 9.7% before and 13.0% ± 5.3% after the MTH treatment (P = 0.001). This result suggests that hyperthermia increased tumor perfusion and thereby improved the oxygen supply to the HT29 tumors, as inferred from the reduction in retention of the hypoxia marker IAZGP in the tumors.
4. Discussion
It is an innovative method to use dual-radiolabel-IAZGP in the measurement of perturbations in tumor hypoxia status. The selection of an iodinated hypoxia tracer allowed the same tracer to be labeled with different radioisotopes of iodine, but possessing identical chemistry and hypoxia-targeting characteristics. As an important advantage of this approach, each animal served as its own control thus the number of animals required for the study could be greatly reduced. Our ability to disentangle the contribution of the 131I and 123I components of the microscopic IAZGP uptake in the tumor provided a quantitative measure of the positional changes in hypoxia. The measured reduction in hypoxic fraction in this work was consistent with the observations of some previous animal studies (e.g. [7,8]), and also supported the notion that MTH could be an effective radiosensitizer [24].
Our method is able to quantify hypoxia marker concentration at loco-regional level on tissue sections. This will enable the direct evaluation of the average pO2 values within small areas (tens microns), once a sound relationship between the tracer uptake and tissue oxygen tension is established. This might be a future application of DAR technique to hypoxia detection. However, the DAR images suffer noticeable noises in the PSL readings as manifested by Figure 2. These noises reflect the intrinsic uncertainties in the radioactive decays, imaging plate recording, and read-out, and are amplified during image subtraction and deconvolution. Development of new imaging plates and readers may partially resolve this issue.
5. Conclusion
In the present project, we established the methodology of using dual-radiolabel IAZGP to detect tumor hypoxia changes. The methodology was successfully used in rats bearing HT29 xenograft. Our results showed statistically significant decrease in hypoxic fraction or tumor reoxygenation following a MTH treatment. In addition, our method could detect microscopic to loco-regional hypoxia fluctuations. The methodology is able to quantify changes and fluctuations in tumor hypoxia, and it might find further applications in hypoxia study.
6. Acknowledgements
We are grateful to Dr. Peter Smith-Jones, Dr. Ronald G. Blasberg, and Dr. Kenneth Marians of MSKCC, and Mr. Brian Lee of the Life Sciences Group, FUJIFILM Medical Systems USA for their help throughout our work. This project is supported by the NCI program project grant P01 CA115675-01 (P.I. Dr. C. Clifton Ling).
REFERENCES
- R. Cairns, I. Papandreou and N. Denko, “Overcoming Physiologic Barriers to Cancer Treatment by Molecularly Targeting the Tumor Microenvironment,” Molecular Cancer Research, Vol. 4, No. 2, 2006, pp. 61-70. doi:10.1158/1541-7786.MCR-06-0002
- K. L. Bennewith and S. Dedhar, “Targeting Hypoxic Tumour Cells to Overcome Metastasis,” BMC Cancer, Vol. 11, No. 1, 2011, pp. 504-509.
- M. Urano, M. Kuroda and Y. Nishimura, “For the Clinical Application of Thermochemotherapy Given at Mild Temperatures,” International Journal of Hyperthermia, Vol. 15, No. 2, 1999, pp. 79-107. doi:10.1080/026567399285765
- E. L. Jones, L. R. Prosnitz, M. W. Dewhirst, P. K. Marcom, P. H. Hardenbergh, L. B. Marks, D. M. Brizel and Z. Vujaskovic, “Thermochemoradiotherapy Improves Oxygenation in Locally Advanced Breast Cancer,” Clinical Cancer Research, Vol. 10, No. 13, 2004, pp. 4287-4293. doi:10.1158/1078-0432.CCR-04-0133
- Z. Vujaskovic, J. M. Poulson, A. A. Gaskin, D. E. Thrall, R. L. Page, H. C. Charles, J. R. MacFall, D. M. Brizel, R. E. Meyer, D. M. Prescott, T. V. Samulski and M. W. Dewhirst, “Temperature-Dependent Changes in Physiologic Parameters of Spontaneous Canine Soft Tissue Sarcomas after Combined Radiotherapy and Hyperthermia Treatment,” International Journal of Radiation Oncology, Biology and Physics, Vol. 46, No. 1, 2000, pp. 179-185. doi:10.1016/S0360-3016(99)00362-4
- C. W. Song, H. Park and R. J. Griffin, “Improvement of Tumor Oxygenation by Mild Hyperthermia,” Radiation Research, Vol. 155, No. 4, 2001, pp. 515-528. doi:10.1667/0033-7587(2001)155[0515:IOTOBM]2.0.CO;2
- K. Okajima, R. J. Griffin, K. Iwata, A. Shakil and C. W. Song, “Tumor Oxygenation after Mild-Temperature Hyperthermia in Combination with Carbogen Breathing: Dependence on Heat Dose and Tumor Type,” Radiation Research, Vol. 149, No. 3, 1998, pp. 294-299. doi:10.2307/3579963
- A. Shakil, J. L. Osborn and C. W. Song, “Changes in Oxygenation Status and Blood Flow in a Rat Tumor Model by Mild Temperature Hyperthermia,” International Journal of Radiation Oncology, Biology and Physics, Vol. 43, No. 4, 1999, pp. 859-865. doi:10.1016/S0360-3016(98)00516-1
- Z. Vujaskovic and C. W. Song, “Physiological Mechanisms Underlying Heat-Induced Radiosensitization,” International Journal of Hyperthermia, Vol. 20, No. 2, 2004, pp. 163-174. doi:10.1080/02656730310001619514
- A. S. E. Ljungkvist, J. Bussink, J. H. A. M. Kaanders and A. J. van der Kogel, “Dynamics of Tumor Hypoxia Measured with Bioreductive Hypoxic Cell Markers,” Radiation Research, Vol. 167, No. 2, 2007, pp. 127-145. doi:10.1667/RR0719.1
- X. R. Sun, X.-F. Li, J. Russell, L. Q. Xing, M. Urano, G. C. Li, J. L. Humm and C. C. Ling, “Changes in Tumor Hypoxia Induced by Mild Temperature Hyperthermia as Assessed by Dual-Tracer Immunohistochemistry,” Radiotherapy and Oncology, Vol. 88, No. 2, 2008, pp. 269-276. doi:10.1016/j.radonc.2008.05.015
- R. F. Schneider, E. L. Engelhardt, C. C. Stobbe, M. C. Fenning and J. D. Chapman, “The synthesis and Radiolabeling of Novel Markers of Tissue Hypoxia of the Iodinated Azomycin Nucleoside Class,” Journal of Labelled Compounds and Radiopharmaceuticals, Vol. 39, No. 7, 1997, pp. 541-557. doi:10.1002/(SICI)1099-1344(199707)39:7<541::AID-JLCR5>3.0.CO;2-B
- R. V. Iyer, P. T. Haynes, R. F. Schneider, B. Movsas and J. D. Chapman, “Marking Hypoxia in Rat Prostate Carcinomas with β-D-[125I]Azomycin Galactopyranoside and [99mTc]HL-91: Correlation with Microelectrode Measurements,” Journal of Nuclear Medicine, Vol. 42, No. 2, 2001, pp. 337-344.
- J. Saitoh, H. Sakurai, Y. Suzuki, H. Muramatsu, H. Ishikawa, Y. Kitamoto, T. Akimoto, M. Hasegawa, N. Mitsuhashi and T. Nakano, “Correlations between in Vivo Tumor Weight, Oxygen Pressure, 31P NMR Spectroscopy, Hypoxic Microenvironment Marking by β-D-Iodinated Azomycin Galactopyranoside (β-D-IAZGP), and Radiation Sensitivity,” International Journal of Radiation Oncology, Biology and Physics, Vol. 54, No. 3, 2002, pp. 903-909. doi:10.1016/S0360-3016(02)03013-4
- P. Zanzonico, J. O’Donoghue, J. D. Chapman, R. Schneider, S. Cai, S. Larson, B. Wen, Y. C. Chen, R. Finn, S. Ruan, L. Gerweck, J. Humm and C. Ling, “Iodine-124- Labeled Iodo-Azomycin-Galactoside Imaging of Tumor Hypoxia in Mice with Serial MicroPET Scanning,” European Journal of Nuclear Medicine and Molecular Imaging, Vol. 31, No. 1, 2004, pp. 117-128. doi:10.1007/s00259-003-1322-y
- N. Mori, T. Oikawa, T. Katoh, J. Miyahara and Y. Harada, “Application of the ‘Imaging Plate’ to TEM Image Recording,” Ultramicroscopy, Vol. 25, No. 3, 1988, pp. 195-201. doi:10.1016/0304-3991(88)90014-9
- J. M. Zuo, “Electron Detection Characteristics of a SlowScan CCD Camera, Imaging Plates and Film, and Electron Image Restoration,” Microscopy Research and Technique, Vol. 49, No. 3, 2000, pp. 245-268. doi:10.1002/(SICI)1097-0029(20000501)49:3<245::AID-JEMT4>3.0.CO;2-O
- W. H. Richardson, “Bayesian-Based Iterative Method of Image Restoration,” Journal of the Optical Society of America, Vol. 62, No. 1, 1972, pp. 55-59. doi:10.1364/JOSA.62.000055
- L. B. Lucy, “An Iterative Technique for the Rectification of Observed Distributions,” Astronomical Journal, Vol. 79, No. 6, 1974, pp. 745-754. doi:10.1086/111605
- M. T. Zhang, Q. Chen, X.-F. Li, J. O’Donoghue, S. Ruan, P. Zanzonico, C. C. Ling and J. L. Humm, “Image Deconvolution in Digital Autoradiography: A Preliminary Study,” Medical Physics, Vol. 35, No. 2, 2008, pp. 522- 530. doi:10.1118/1.2828198
- P. A. Netti, L. T. Baxter, Y. Boucher, R. Skalak and R. K. Jain, “Time-Dependent Behavior of Interstitial Fluid Pressure in Solid Tumors: Implications for Drug Delivery,” Cancer Research, Vol. 55, No. 22, 1995, pp. 5451- 5458.
- M. W. Dewhirst, R. D. Braun, J. L. Lanzen, “Temporal Changes in pO2 of R3230AC Tumors in Fischer-344 Rats,” International Journal of Radiation Oncology, Biology and Physics, Vol. 42, No. 4, 1998, pp. 723-726. doi:10.1016/S0360-3016(98)00304-6
- D. Fukumura and R. K. Jain, “Tumor Microenvironment Abnormalities: Causes, Consequences, and Strategies to Normalize,” Journal of Cell Biochemistry, Vol. 101, No. 4, 2007, pp. 937-949. doi:10.1002/jcb.21187
- C. W. Song, H. J. Park, C. K. Lee and R. Griffin, “Implications of Increased Tumor Blood Flow and Oxygenation Caused by Mild Temperature Hyperthermia in Tumor Treatment,” International Journal of Hyperthermia, Vol. 21, No. 8, 2005, pp. 761-767. doi:10.1080/02656730500204487