Advances in Remote Sensing
Vol.05 No.04(2016), Article ID:72143,23 pages
10.4236/ars.2016.54020
PALSAR-FBS L-HH Mode and Landsat-TM Data Fusion for Geological Mapping
Abderrazak Bannari1, Ali El-Battay1, Ali Saquaque2, Abdelhafid Miri2
1Department of Geoinformatics, Arabian Gulf University, Manama, Kingdom of Bahrain
2Managem Mineral ONA Group, Twin Center, Casablanca, Kingdom of Morocco

Copyright © 2016 by authors and Scientific Research Publishing Inc.
This work is licensed under the Creative Commons Attribution International License (CC BY 4.0).
http://creativecommons.org/licenses/by/4.0/


Received: October 12, 2016; Accepted: November 18, 2016; Published: November 21, 2016
ABSTRACT
Characterized by lithological diversity and rich mineral resources, Benshangul-Gu- muz National Regional State located in Asosa Zones, Western Ethiopia has been investigated for geological mapping and morpho-structural lineaments extraction using PALSAR (Phased Array type L-band Synthetic Aperture Radar) Fine Beam Single (FBS) L-HH polarization and Landsat-5 TM (Thematic Mapper) datasets. These data were preprocessed to retrieve ground surface reflectance and backscatter coefficients. To overcome the geometry acquisition between the two sensors, they were geometrically and topographically rectified using ASTER-V2 DEM. Intensity-Hue-Saturation, directional filters and automatic lineaments extraction were applied on the datasets for lithological units’ discrimination and structural delimitation for potential mineral exploration. The obtained results showed good relationship among the topographic morphology, rock-substrate, structural variations properties, and drainage network. The spectral variations were easily associated with lithological units. Likewise, the morpho-structural information highlighted in the PALSAR image was visible without altering the radiometric integrity of the details in TM bands through the fusion process. Moreover, predominant lineaments directions trending NE-SW, NS, and NW-SE were identified. Results of this study highlighted the importance of the PALSAR FBS L-HH mode and TM data fusion to enhance geological features and lithological units for mineral exploration particularly in tropical zones.
Keywords:
Geology, Mineral Exploration, Lineaments Extraction, Data Fusion, Intensity-Hue-Saturation, Mapping, Landsat-TM, PALSAR-FBS, L-HH Polarization, ASTER DEM

1. Introduction
Geological and structural maps are very important for mining and petroleum exploration operations, because these two resources are often associated with specific lithology. Subterranean structures, which are conducive to trapping oil or hosting specific minerals, often manifest themselves on the Earth’s surface. By delimiting these structures and by identifying associated lithology, geologists can recognize areas that show these characteristics and target them for exploration. For this type of maps, geologists have always exploited the synergy between the fieldwork and aerial photographs. Although these techniques are accurate, they are time consuming and require significant financial investment. However, since the launch of the first Earth observation satellite in 1972, remote sensing has become a scientific domain of wide interest for geological mapping, particularly in developing countries where cartographic documents are incomplete or out of date. This technology allows for relatively fast and economic data acquisition, and covers large territories. Optical remote sensing is sensitive to the Erath surface reflectivity illuminated by the Sun. It can be used to describe the lithology using colour and characteristics of alteration and erosion, drainage networks and bedding thickness [1] . Nevertheless, it can only provide information on the physical structure of surfaces, which limits its application in geological mapping, particularly when the structures are buried underground or under vegetation cover or forest canopy. To overcome these limitations, active remote sensing with its ground-penetration capability can be used to obtain relevant and precise information on geological structures, micro-topography and the dielectric properties of the terrain [2] - [7] . In fact, the backscatter coefficient retrieved from active remote sensing depends on the signal itself, the illumination geometry, the wavelength characteristics, and the observed targets [8] . In general, radar uses wavelengths between 2 and 100 cm, but unlike the short wavelengths; longer ones as L-band can penetrate the vegetation cover and the forest canopy, and then detect the soil background features [9] . Certainly, the long wavelengths (L-band) are more important than the shorter wavelengths for geological mapping, especially in tropical zones as Ethiopian environment where fog and clouds are frequently present and bedrocks are not well exposed to the FOV of the instruments. Indeed, Pour and Hashim [7] and Pour et al. [10] showed that the PALSAR L-band data are positively useful for mapping major geological structural features and detailed structural analysis of fault systems and deformation areas in Malaysia.
Furthermore, the fusion of multi-sensors data, and unlike images, increases the information extraction and interpretation capabilities that can be derived from each image individually [11] [12] [13] . According to Pour and Hashim [14] , integration of PALSAR and ASTER data support the comprehension of geological information, lithological and structural mapping, and provide more accurate information compared to individual sensor results. Likewise, the advent of remote sensing not only requires new technology for instruments and sensors, but also new analytical approaches and techniques to manipulate and process data and extract information from multi-sensors fusion and integration. In the literature, many methods were developed for multi-source images fusion using advanced technique to enhance the apparent information in the images as well as to increase the reliability of the interpretation [15] . Recently, Joshi et al. [16] reviewed 112 studies on fusing optical and radar data for the land cover exploiting different fusion methods and techniques. Among these, the Intensity-Hue-Saturation (IHS) technique that has become a standard procedure in image processing, providing important results for the geological mapping. It serves the colour enhancement of highly correlated data [17] , the feature enhancement [18] , the improvement of spatial resolution [19] and the fusion of disparate datasets [20] . Otherwise, many authors [21] [22] demonstrated the potential and advantages of Synthetic Aperture Radar (SAR) integration with Enhanced Thematic Mapper (ETM) for geological mapping in arid and tropical regions. Moreover, for various lithologic units mapping, ERS-2 SAR has been fused with IRS-1C LISS-III using principal component analysis approach [22] . Based on a GIS platform and Fuzzy- logic data fusion methods, Rogge et al. [23] integrated SAR image with airborne geophysical data, litho-geochemistry, and sediment information map for geological features mapping. In Mackenzie Valley Pipeline Corridor, Canada, Pavlic et al. [24] developed an improved technique based on HIS and combining RADARSAT-1, DEM and ETM + images for surficial geology mapping. Furthermore, to establish a relationship between gold mineralization, lithological and structural information in the Buhweju area, western Uganda, Bahiru et al. [25] integrated each of SRTM-DEM, TM and airborne geophysical with the geological field data. Nevertheless, these multi-sources images vary in radiometric, spectral, spatial and temporal resolutions; as well, their respective sensors are on-board different platforms that follow different orbits. Moreover, these sensors have different characteristics and viewing geometries, interact differently with shadow and topographic variability’s effects, etc. [8] [26] . Therefore, the considered images must be preprocessed correctly before any fusion or integration operations. Indeed, the standardization steps are necessary to integrate, manage and manipulate spatial and auxiliary datasets in GIS environment for geological mapping or for any other application.
In this study, we investigated a fusion approach of PALSAR (Phased Array type L- band Synthetic Aperture Radar) Fine Beam Single (FBS) L-HH polarization and Landsat-5 TM (Thematic Mapper) datasets for geological mapping and morpho-structural lineaments extraction in the context of mineral exploration. The images were preprocessed to retrieve ground surface reflectance and backscatter coefficients. Then, to overcome the geometry acquisition between the two used sensors, they were geometrically corrected and topographically rectified using Advanced Space-borne Thermal Emission and Reflection Radiometer (ASTER) digital elevation model (DEM). The processing step was based on the Intensity-Hue-Saturation transformations methods (hexagonal, double hexagonal and cylindrical), and the lineaments extraction using LINE module of PCI-Geomatica [27] , directional filters and visual analysis. The used methodology is summarized in Figure 1.
2. Materials and Methods
2.1. Study Site and Geological Setting
The study area is situated in Western Ethiopia, Benshangul-Gumuz National Regional State, Asosa Zones (9˚43'30''N, 34˚22'13'' E; Figure 2); which is characterized by litho- logical diversity and rich mineral resources. The region climate is tropical with long dry season from December to May, and a rainy period from June to September. It is classified as a hot-arid region with a mean annual temperature of 32˚C and mean annual rainfall of 1000 - 1400 mm per year [28] . In this region, the topographic variability plays an important role on the climatic conditions. It is ranging from plain lowland to rugged mountainous terrains. The elevated topography is common in the north, northeast, east, south and southeast corner, but relatively flat to plain areas are found in the central and western portion of the study site. The highest elevation is about 1775 meters to the north and the lowest elevation is approximately 525 meters to the central west. The region is crossed by active streams draining mostly towards west directions. Vegetation is sparse consisting mainly of bamboo, mango trees, incense trees and savannah
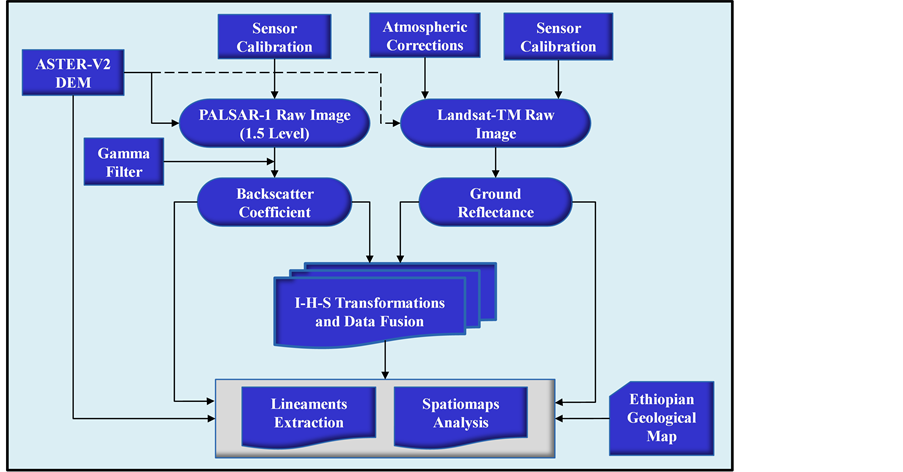
Figure 1. Methodology flowchart.

Figure 2. Study site localization, Asosa zone (Ethiopia).
grass [29] . However, the savannah grass is relatively dense during the rainy season, but less dense in the dry period. According to the UNESCO soil classification scheme, the general soil types are Nitosols with minor Humic-Cambisols and Chromic-Vertisols [28] . The geology of this region is mainly composed of low-grade and high-grade metamorphic rocks, intrusive and mainly includes granitic-gneiss, meta-granite, meta- granodiorite, meta-diorite, and meta-gabbro. Moreover, other types of rocks are present such as amphibole schist, quartz-feldspar-biotite schist, amphibole-feldspar-biotite schist, biotite schist, chlorite schist and talc schist, graphitic schist and some un-mappable meta-sediments and remnants of basalt. In general, the structures directions are trending NE-SW, N-S and NW-SE. Figure 3 shows a simplified geological map of a part of the Asosa study site [30] .

Figure 3. Simplified geological map of a part of the Asosa study site (Source: Managem, Mineral ONA Group).
2.2. Images and DEM Data
The two used images were acquired over the same area in January that is the driest month with no precipitation and less vegetation distribution, which are the good conditions for geological and structural mapping. The PALSAR image level 1.5 product was acquired on 16 January 2009, and the TM image was acquired on 2nd January 2009. Obviously, this difference of 14 days between the two images will not have any impact on the used approach. Figure 4 illustrates the preprocessed images recorded over the study site. In addition, the ASTER DEM was used for topographic distortions rectification and lineaments extraction.
2.2.1. PALSAR Data
The PALSAR is a SAR system operating in L-band from space on-board ALOS satellite following a sun-synchronous orbit of 700 km altitude and 98.16˚ inclination. The Ministry of Economy, Trade and Industry (METI) and Japan Aerospace Exploration Agency (JAXA) developed it in 2006 for resource exploration (especially for geological structure analysis and rocks distribution), environmental protection, natural disaster management, etc. PALSAR could simultaneously receive horizontal and vertical polarization per each polarized transmission (dual polarization simultaneous reception), and could switch from horizontal to vertical polarization and vice versa at respective

Figure 4. TM (7-5-4) color composite and PALSAR images recorded over the study site.
transmission pulse, enabling to obtain four-polarization characteristics of observation target by dual polarization simultaneous reception (full polarimetry) [31] . Otherwise, it operates under different incidences and off-nadir angles by single polarization of HH or VV (FBS), and by dual polarization of HH+HV or VV + VH (FBD: Fine Beam Dual). It can also operate in three other different modes: Downlink SiNgle mode (DSN), PALSAR ScanSAR (WB) and Polarimetry mode (PLR). The PALSAR image level 1.5 product was acquired on 16 January 2009 following an ascending orbit with a FBS L-HH polarization (frequency ~1.27 GHz, and wavelength ~24 cm), with incidence angle of 38.70˚, off-nadir angle equal to 34.30˚, and a spatial resolution of 10 m. This geometry acquisition was selected for this research since the topography of the study area is relatively variable and the structures directions are NE-SW, NS, and NW-SE. In addition, this acquisition mode was recommended for structural, geological and rocks distribution analysis and mapping [31] .
2.2.2. Landsat TM Data
Started in 1972, the Landsat program is one of the mainstays of NASA’s Earth-obser- vation program. Launched in orbit on March 1984, Landsat-5 was designed to be used for many applications, such as geology, forestry, agriculture, etc. Outliving its five-years design life, Landsat-5 delivered high-quality global data of Earth’s land surface for approximately 28 years, officially setting a new Guinness World Records title for the “Longest-operating Earth observation satellite” [32] . In November 2011, the TM instrument stopped acquiring images, and in December 2012 the USGS announced the operations cessation of Landsat-5 after the failure of a redundant gyroscope. On October 5 1993, the EOSAT owned Landsat-6 failed at launch because it was not reaching the velocity necessary to obtain orbit. On May 31 2003, the Scan Line Corrector (SLC) failed to operate on Landsat-7. Prior the Landsat-8 launch in February 11 2013, the Landsat-5 was invaluable as a data source for the international scientific community. In this study, we selected a TM image that was recorded on the 2ndof January 2009 in a clear and cloudless day, two weeks before the radar image acquisition. The six spectral bands, covering the visible-near and short wave infrared (VNIR and SWIR) with 30 m spatial resolution, were used in this research (Figure 4).
2.2.3 ASTER-V2 DEM Data
The ASTER-V2 DEM is a joint product developed and made available to the public by the METI of Japan and the United States National Aeronautics and Space Administration (NASA). It is generated from data collected from the optical instrument ASTER onboard TERRA spacecraft [33] . This instrument was built in December 1999 with a long-track stereoscopic capability using its nadir-viewing and backward-viewing telescopes to acquire stereo image data with a base-to-height ratio of 0.6 [34] . Since 2001, these stereo pairs had been used to produce single-scene (60 × 60 km) DEM based on stereo-correlation matching technique, using UTM map projection and WGS84 geodetic reference [35] . According to Chrysoulakis et al. [36] , the planimetric and altemi- tric accuracies of the produced ASTER DEM over Greek islands are ± 15 and ± 12.41 m, respectively. They considered these precisions satisfactory for watershed management, hydrological applications, and the ortho-rectification of satellites images acquired over the same area with the same spatial resolution; which was the case in this study for TM and PALSAR resampled image (see section 2.3.3). Testing the ASTER DEM over Vancouver (West Canadian territory), Toutin [37] demonstrated that the derived DEM was almost linearly correlated with the terrain slopes. Based on a set of geodetic ground control points over Western Australia, Hirt et al. [38] had shown that the vertical accuracy of ASTER DEM was approximately ±15 m. They also reported that this accuracy varied as a function of the terrain type and shape, and it was relatively low in areas with low topographic variability. In 2011, NASA and Japanese collaborators [39] [40] made the validation and the accuracies assessment of ASTER DEM products (version-2) jointly. Their results showed that the absolute geometrical rectification accuracies, expressed as a linear error at the 95% confidence level, were ±8.68 and ±17.01 meters for planimetry and altimetry, respectively [41] . Consequently, the DEM over our study region (Figure 5) was downloaded from USGS data explorer gate [42] , it was preprocessed, and then it was used for the PALSAR and TM images data ortho-rectifi- cation.

Figure 5. ASTER-V2 DEM over the study site.
2.3. Data Preprocessing
2.3.1. Radar Data Backscatter Coefficients Retrieval
For radiometric calibration, “Elevation Antenna Pattern Calibration” (EAPC) and absolute gain calibration were performed. The EAPC was carried out to eliminate the influence on gains due to the elevation antenna pattern. This step involves SAR data analysis over homogenous area such as Amazon rain forests. According to [31] , each beam mode was analyzed with at-least 10 data acquisitions to get good average values for the shapes of the antenna patterns. Analysis of ascending and descending pass data was also performed by JAXA. The absolute gain calibration was performed to obtain absolute gains by eliminating effects on other comprehensive gains. The absolute gains values obtained through analyzing responses from a transponder used as a point target placed on the calibration site. Absolute gain calibration for a beam mode was needed to be done after all data sets for the same beam mode were analyzed for EAPC. Finally, the calibration of PALSAR image was carried out, enabling the derivation of backscattering coefficients (in Decibel) using the following Equation [43] [44] :
 (1)
(1)
where DN is the digital number of the amplitude image, which is a level of 1.5 product (16-bit unsigned short integer), and CF is the provided calibration factor. Then, the backscatter coefficients image was filtered to reduce speckle noise using the gamma filter [45] . Moreover, the PALSAR image, initially coded in 16 bits, was converted to 8 bits for easier processing and integrating with TM data (Figure 3). According to Knipp [46] , the 16 to 8-bit conversion was performed after speckle reduction in order to reduce the loss of information.
2.3.2. Optic Data Surface Reflectance Retrieval
Drift of the sensor radiometric calibration (relative and absolute) is a necessary step, which consists of correcting artifacts affecting the sensor in order to extract precise and reliable information from an image [47] . Relative calibration that is a normalization and harmonization of the data received from the different detectors of the TM sensor. This step corrects any striping effects caused by the detectors sensitivity differences [48] . Absolute calibration allows the transformation of the digital number [DN (λ)], which is measured at the sensor level (Top of Atmosphere: TOA), into apparent equi- valent radiance [L*(λ)]. Without these operations, the changes caused by artifacts relative to the sensor can be mistakenly attributed to changes in the land-use and ground biophysical components. Consequently, errors can propagate in all subsequent steps taken during the image processing such as spectral indices calculations, multi-temporal analysis, classification, climate change modeling, etc. [47] [49] [50] . USGS EROS Center delivered the values of the solar angle, multiplicative and additive rescaling coefficients (gain and offset) for the apparent radiance conversion.
Moreover, the two processes responsible for the modification of the satellite signal, are mainly the absorption by gases (ozone, water vapour, and CO2) and the scattering by aerosols and molecules [51] that dominate atmospheric effects. These phenomena cause an attenuation of the signal in the direction of illumination, but increase the signal in the other directions because of scattering effects. An accurate correction of atmospheric effects requires a priori knowledge of the atmospheric parameters that interfere during the data acquisition operation [52] . For the used TM image, these parameters were measured during the satellite overpass using meteorological station data located closest to the study site. The Canadian Modified Simulation of the Satellite Signal in the Solar Spectrum (CAM5S), based on the Herman radiative transfer code [53] , was used for atmospheric parameter simulation in this study. CAM5S simulates the signal measured at the TOA from the Earth’s surface reflecting solar and sky irradiance at sea level, while considering the TM sensor characteristics, such as the band passes of the solar-reflective spectral bands, satellite altitude, atmospheric condition, atmospheric model, Sun and sensor geometry, and terrain elevation. Consequently, all the requested parameters for atmospheric corrections were simulated and calculated. Then, they were used to transform the apparent reflectance at the TOA to the ground reflectance ρG(λ) using the Equations (2) and (3). To preserve the radiometric integrity of the image, drift of the sensor radiometric calibration and atmospheric effects (scattering and absorption) were combined and corrected in one-step [54] [55] .
 (2)
(2)
 (3)
(3)
where:
ρ*(λ) = Apparent reflectance at the sensor level,
L*(λ) =Apparent radiance at the sensor level,
ρa(λ) = Reflectance intrinsic to atmosphere at the sensor level,
ρG(λ) = Reflectance at the ground surface,
D = Earth-sun distance in astronomical units,
Es(λ) = Solar irradiances,
θs = Solar zenith angle,
 = Total descending scattering transmittance,
 = Total ascending scattering transmittance,
S = Spherical albedo, and
 = Average total gaseous transmittance.
2.3.3. Geometric and Topographic Rectifications
Image-to-image registration is the process of matching two images so that corresponding coordinate points in the two images correspond to the same physical region of the scene being imaged [26] [56] . It is a classical problem in several images preprocessing applications, especially when it is necessary to combine (merge or integrate) two or more images acquired over the same scene using different sensors. Indeed, as discussed previously, these sensors are on-board different platforms and follow different orbits, each having different characteristics, viewing geometries, and interact differently with shadow and topographic variability’s effects, etc. [26] . Consequently, it is necessary to register the images prior to their processing, interpretation and analysis. For PALSAR, geometric correction was done on the data of multiple beam modes spanning the various look angles of the SAR sensor. Analysis of the image data with ground control points, and estimating the time offsets in a range echo delay and azimuth along-track time were performed as geometric correction by JAXA [57] . However, despite this important correction step, the radar geometry remains less stable and less accurate comparatively to TM who had acquisition geometry at the nadir. To overcome this problem, the proposed approach by Rig not et al. [58] and Takeuchi [59] which involved DEM as ancillary data for co-registration between SAR and TM images was considered in this study. Image-to-image geometric registration and topographic corrections were achieved using TM image as a reference for 22 ground control points (GCPs) selection. These CGP’s and the ASTER DEM were used for ortho-rectification process using the “Radar Specific Model” implemented in Ortho-Engine module of PCI-Geomatica [27] . This step enables corrections of the parallax effect at the spatial arrangement of pixels along the scanning system of the disruptive effects caused by shadow and topographic variability’s. To preserve the images radiometric integrity, geometric corrections have been combined into a single step with the topographic effects rectification [60] . The UTM map projection and the WGS84 geodetic reference were considered. The corrected PALSAR image was resampled using the nearest-neighbor method and the output pixel size was fixed to 30 × 30 m, which is similar to the spatial resolution of TM image and DEM. Finally, the RMSE registration between the two considered images was less than 1 pixel.
2.4. Images Processing
2.4.1. Data Fusion Technique
Rocks and soils can be characterized by intensity (I), hue (H) and saturation (S) according to their mineralogy and colour [15] [61] [62] [63] . These three variables, derived by transformation of the visible bands, summarizes the absorption bands information to maps potential alteration areas and lithological formations based upon the predicted relationships between the image color and mineral absorption features [64] [65] . The Hue is defined as the predominant wavelength of a color, the saturation as the purity or total amount of white light of a color, and the intensity is related to the total amount of light that reaches the eye (brightness of the colour) [20] [66] [67] . The Hue is an important parameter because its values are independent of illumination and are related only to the shapes of the spectral signatures [66] . In the literature, three methods had been developed to transform the visible bands to the “I”, “H” and “S”: hexagonal [68] , double-hexagonal [69] and cylindrical transformation [64] . The contribution of the semethods is well documented in the literature. According to Madeira et al. [70] and Fonts and Carvalho [71] , the “H” characterizes well the hematite and describes adequately the hematite/goethite ratio. As for the “S”, it quantifies correctly the iron oxides in the soil [70] and discriminates the different rock types [72] . The IHS transformation is the commonly used method to merge data from different sensors (optical and radar) for soil and rocks discrimination [15] [67] . It significantly provides important results in terms of geomorphological and geological mapping [73] [74] [75] . It can be applied directly or by substitution [67] . The direct technique consists in modulating “I”, “H” and “S” by assigning those values before re-transformation to RGB. The substitution approach consists of calculating “I”, “H” and “S” parameters for a spectral colour composition, then replacing the radar data to be merged by “I” or “S”. This approach was used in this study considering the three transformation methods: hexagonal, double hexagonal and cylindrical.
2.4.2. Lineaments Extraction
Lineaments extraction and analysis constitute a major step in geologic mapping and mineral exploration. Since many mineralizations occur near fracture zones, lineaments are useful for the sezones localization [76] . In digital satellites images, they are usually defined as straight or somewhat curved features. They can be natural such as geological structures (faults, fractures, lithological boundaries, etc.) or drainage networks (rivers), or can result from manmade structures such as transportation networks (roads, canals, etc.). According to digital image processing methods, the lineaments distinction is based on the intensity change in an image as measured by gradient [77] . Through applying edge detection filters to the image, a visual method for lineament detection can be constructed. Certainly, this method involves the human visual interpretation, which is excellent in extrapolating linear features. Thus, to the interpret eye, a lineament that varies in intensity along its length may be viewed as a single long lineament, whereas to an automatic method, this may appear as several short lineaments. Automatic lineaments detection and extraction methods should be robust and allow for gradual or sudden changes in the gradient along the lineament, and also for minor changes in the direction. This concept is implemented in PCI Geomatica [27] in three steps: 1) an edge detection operator is applied to the image that produces a gradient image, 2) the gradient image is thresholded to create a binary edge image, 3) then, this latest is used to extract linear features. This last step contains many sub-steps such as edge thinning, curve pruning, recursive curve segmentation, and proximity curve linking. Finally, extracted lineaments are saved in a vector segment. This algorithm provides a good accuracy for lineaments extraction [78] , and it was used in this study.
3. Results and Discussion
To realize an optimal image fusion for geological interpretation, the “I”, “H” and “S” were coded using three different methods (hexagonal, double-hexagonal, and cylindrical) and several tests integrating TM and PALSAR bands. The TM spectral band in SWIR and NIR (7, 5, 4) had been selected because of their important geological information content, and the significant derived results in comparison to other bands integration. Moreover, the cylindrical transformation provides the best results, since the spectral variations are easily associated with land use units, topographic and structural variations. Figure 6(a) and Figure 6(b) illustrate the selected combinations (named spatiomap) integrating, respectively, “I”, “H” and “L-HH” bands; as well as “I”, “H” and the blue band resulting from the fusion of TM (7, 5, 4) and PALSAR-LHH bands. Visual interpretation and evaluation of the produced spatiomaps show significant improvement compared to the original data, i.e. the interpretation of lithology boundaries and recognition of structural features. Indeed, these maps show good relation between the topographic morphology, rock substrate properties, and drainage network. Additionally, the morpho-structural information, highlighted in the PALSAR image, is visible in the two derived spatiaomaps without altering the radiometric detail in TM spectral bands through the fusion process. The structural features show faults, fractures, ridges, and hydrographic networks in the NE-SW, N-S, and NW-SE directions. These features are valuable for exploration of mineral deposits such as gold mineralization. Concerning lithological information extraction, the only information that we have for validation purposes are the simplified geological map (Figure 3) and the global geological map of Ethiopia [79] . These were geo-referenced and overlapped on the derived spatiomaps in GIS environment. This step shows the potential of the used methodology to produce results containing information that is more useful. In fact, such comparison shows that it is possible to identify ten geological classes, which are: intermediate-meta- volcanic + Chlorites-schist + Andesite-lava 1); metagranite 2); granite 3); sericite-quartz 4); basic-metavolcanic 5); foliated-metagranite 6); granitic-gneiss 7); metagranodiorite 8); amphibol-biotite-quatrz-shist 9); and basic meta-volcanic with minor metasediments 10). Figure 6(b) illustrates the spatial distribution of these classes on the study site by their respective numbers.
Figure 7 illustrates the retrieved “R-G-B” color composite based on the fusion of “I”, “H”, “S” and “L-HH”. The “I”, “H” and “S” coded before were used as moderate spatial resolution, while L-HH was introduced as a reference image with its original spatial resolution, i.e. 10 m × 10 m. This product highlighted significantly the granitic rocks group independently to the other surrounding rocks in their neighborhood. Indeed, among the ten classes presented in Figure 6(b), six sub-classes are identified clearly without confusion with their neighbourhoods: 2) metagranite, 3) granite, 5) basic-meta- volcanic, 6) foliated metagranite, 7) granitic-gneiss and 10) basic meta-volcanic with minor metasediments. However, despite these encouraging results, validation with respect to the ground truth remains a critical step. In addition, identify to accurately the mixed sub-mineral classes as provided by the simplified geological map (Figure 3), it is necessary to explore hyperspectral data with high spatial resolution, supported by campaign field spectroradiometric measurements, for calibration and validation.
Furthermore, the lineaments were extracted from several combinations of TM image (VNIR and SWIR), PALSAR image, data fusion, and DEM using visual and automatic methods. The visual method was not completely manual but semi-automatic; it was based on directional filters (Laplacian, Sobel, Edge detection and directional filters). Then, the extracted lineaments were analyzed visually and digitized manually using PCI

 (a) (b)
Figure 6. Spatiomap (R, G, B) integrating “I” and “H” derived from cylindrical transformation and the “L-HH” band (a), spatiomap (R, G, B) integrating “I” and “H” derived from cylindrical transformation and the blue band that resulted from the fusion of TM (7, 5, 4) bands and PALSAR-LHH (b).

Figure 7. Retrieved “R-G-B” color composite based on the fusion of “I”, “H”, “S” and “L-HH”.
vectors editing functionality. While, the automatic method was based on the module LINE of PCI Geomatica, which extracts linear features from a single image and records the output as poly-lines in a vector segments.
Using the visual method, a lineaments map was generated exploring numerous directional filters that had been applied on the considered datasets (TM and PALSAR images, and DEM). Definitely, the exploration of only a single color composite and one filter may not detect all the lineaments because of the variation in the spectral and radiometric behavior of targets’ materials in the scene, such as variations in the vegetation cover density, soil moisture, structural directions, and topographic variability. Among the analyzed possibilities, the “I”, “H” and “L-HH” color composite offer greater contrast between the units in the image than do the individual TM band false color images, or the single band of PALSAR or DEM. Processed by Laplacien filter, it gave the best combination providing the acceptable lineaments map. Unfortunately, this map contains uncertainties in recognizing lineaments that are not geological structures, such as roads, drainage and hydrological networks, and weathered ridges. Nevertheless, this weakness had been eliminated based on the visual interpretation and analysis of many color composites integrating different datasets. Only the potential and significant lineaments were retained and saved in vectors format for comparison with the automatic process in GIS environment. Cert, the visual technique was principally subjected to the data quality, as well the operator expertise and ability.
Furthermore, the lineaments were extracted automatically using LINE Module of PCI, which is controlled by the six following parameters: radius of filter in pixels (RADI), threshold for edge gradient (GTHR), threshold for curve length (LTHR), threshold for line fitting error (FTHR), threshold for angular difference (ATHR), and threshold for linking distance (DTHR). The values of these parameters were selected according to many tests with the help of different color composite combinations, filtered images and visual analysis. As well, the proposed values by other scientists were experimented [80] [81] . However, the default parameters values provided by PCI were chosen because they provide excellent balance between details and reliability of the lineaments. These parameter values are as the following: RADI = 10, GTHR = 100, LTHR = 30, FTHR = 3, ATHR = 30, and DTHR = 20. The extracted lineaments vectors were saved in shapefile and superposed to the derived spatiomaps in GIS. We observed that the automatic process provides more ambiguous details, which might be a result of structural phenomena such as faults, fractures, ridges, hydrographic network, etc. At each change of direction due to a fracture, a topographic variability, etc., the algorithm indicates the existence of lineaments. Additionally, we found several types of lineaments: irregular (short or long), discontinuous (when the structures are buried underground or under vegetation), overlapped other physical details (stream, watershed or sub-watershed, etc.), and ambiguous (shadow projection, soil moisture variability, agricultural fields edges, etc.). However, comparatively to the visual method, the automatic lineaments extraction shows the advantage of its ability to analyze uniformly different input images; processing operations are performed in a short time; and its ability to extract lineaments that are not recognized by the human eyes [17] . In general, similarly to visual method results, the automatic process derives lineaments maps with uncertainties and needs corrections. To overcome this problem, the synergy and cross- comparison between the two used methods show certain complementary and allow the selection of the significant lineaments detail, the elimination of the redundant lineaments and help to keep only desired geological lineaments. The final product (Figure 8) shows that the predominant lineaments directions are the NE-SW and the NS, and then the second dominant direction is the NW-SE. These results are in agreement with the observed trends on the PALSAR image (pixel size of 10 m × 10 m), and relatively in agreement with the global geological map of Ethiopia [79] . Nevertheless, although the final map shows an acceptable product approaching closer to reality, it requires validation with other geological data sources, as well as follow-up field investigations to confirm the validity of the lineaments and their relation to geological structures or fracture zones.
4. Conclusions
This research investigated a fusion approach of PALSAR-FSB L-HH polarization mode and TM datasets for geological mapping and morpho-structural lineaments extraction

Figure 8. Lineaments map resulting from automatic extraction and corrected using visual interpretation.
in the context of mineral exploration in Western Ethiopia. After the preprocessing steps and the datasets standardization, the processing approach was based on Intensity-Hue- Saturation transformations considering three different methods such as hexagonal, double hexagonal and cylindrical. For structural delimitation, the lineaments were extracted using automatic LINE Module of PCI-Geomatica, directional filters and visual analysis.
Based on several tests integrating all the considered datasets, as well as the three transformation methods, the obtained results show that cylindrical transformation incorporating the SWIR and NIR bands provides the best “I”, “H” and “S” for lithological formations discrimination. Subsequently, two color composites were selected due to their greatest results. The first considered “I”, “H” and “L-HH”, while the second integrated the “I”, “H” and the blue band resulting from the fusion of TM (7, 5, 4) and LHH bands. These color composite showed good relationship among the topographic morphology, rock-substrate, structural variations properties, and drainage network. In addition, the spectral variations were easily associated with lithological units. Likewise, the morpho-structural information highlighted in the PALSAR image was visible without altering the radiometric integrity of the details in TM spectral bands through the fusion process. Additionally, a third color composite was retrieved based on the fusion of “I”, “H”, “S” and “L-HH”. The “I”, “H” and “S” were fused as a moderate spatial resolution, while L-HH was introduced as a reference image with its original spatial resolution (i.e. 10 m × 10 m). Based on the global geological map of Ethiopia, which was georeferenced and overlapped on the derived spatiomaps in GIS for validation purposes, this product highlighted significantly the granitic rocks group independently to the other surrounding rocks in their neighborhood. Furthermore, the synergy between visual, directional filters and automatic methods for lineaments extraction provides the best structural delimitation for potential mineral exploration. Predominant lineaments directions trending NE-SW, NS, and NW-SE were identified. Results of this study highlighted the importance of the PALSAR FBS L-HH mode and TM data fusion, as well as the proposed methodology to enhance geological features and lithological units for mineral exploration particularly in tropical zones.
Acknowledgements
The authors would like to thank the Arabian Gulf University for financial support. They acknowledge the support of Managem Mineral ONA group (Morocco) for providing images data and technical support. We would like to thank the LP-DAAC NASA-USGS for ASTER DEMs datasets. We would also like to thank the anonymous reviewers for their constructive rectifications and comments
Cite this paper
Bannari, A., El- Battay, A., Saquaque, A. and Miri, A. (2016) PALSAR-FBS L-HH Mode and Landsat-TM Data Fusion for Geological Mapping. Advances in Remote Sensing, 5, 246-268. http://dx.doi.org/10.4236/ars.2016.54020
References
- 1. Sabins, F.F. (1996) Remote Sensing: Principles and Interpretation. 3rd Edition, W. H. Freeman and Company, New York, 494 p.
- 2. Singhroy, V.H. (1992) Radar Geology: Techniques and Results. Episodes, 15, 15-20.
- 3. Kusky, T.M. and Ramadan, T.M. (2002) Structural Controls on Neoproterozoic Mineralization in the South Eastern Desert, Egypt: An Integrated Field, Landsat TM, and SIR-C/X SAR Approach. Journal of Africa Earth Sciences, 35, 107-121.
http://dx.doi.org/10.1016/S0899-5362(02)00029-5 - 4. Thumound, A.K., Abdelsalam, M.G. and Thumound, J.B. (2006) Optical-Radar-DEM Remote Sensing Data Integration for Geological Mapping in the Afar Depression, Ethiopia. Journal of African Earth Sciences, 44, 119-134.
http://dx.doi.org/10.1016/j.jafrearsci.2005.10.006 - 5. Zandbergen, P. (2008) Applications of Shuttle Radar Topography Mission Elevation Data. Geography Compass, 2, 1404-1431.
http://dx.doi.org/10.1111/j.1749-8198.2008.00154.x - 6. Pettinato, S., Santi, E., Paloscia, S., Pampaloni, P. and Fontanelli, G. (2013) The Intercomparison of X-Band SAR Image from COSMO-SkyMed and TerraSAR-X Satellites: Case Studies. Remote Sensing, 5, 2928-2942.
http://dx.doi.org/10.3390/rs5062928 - 7. Pour, A.B. and Hashim, M. (2015) Structural Mapping Using PALSAR Data in the Central Gold Belt, Peninsular Malaysia. Ore Geology Reviews, 64, 13-22.
http://dx.doi.org/10.1016/j.oregeorev.2014.06.011 - 8. Abdikan, S., Sanli, F.B., Sunar, F. and Ehlers, M. (2012) A Comparative Data-Fusion Analysis of Multi-Sensor Satellite Images. International Journal of Digital Earth, 7, 671-687.
http://dx.doi.org/10.1080/17538947.2012.748846 - 9. Henderson, F.M. and Lewis, A.J. (1998) Principles and Applications of Imaging Radar. Manual of Remote Sensing. 3rd Edition, John Wiley and Sons, New York.
- 10. Pour, A., Hashim, M., Makoundi, C. and Zaw, K. (2016) Structural Mapping of the Bentong-Raub Suture Zone Using PALSAR Remote Sensing Data, Peninsular Malaysia: Implications for Sediment-Hosted/Orogenic Gold Mineral Systems Exploration. Resource Geology, 66, 368-385.
http://dx.doi.org/10.1111/rge.12105 - 11. Zhang, J. (2010) Multi-Source Remote Sensing Data Fusion: Status and Trends. International Journal of Image and Data Fusion, 1, 5-24.
http://dx.doi.org/10.1080/19479830903561035 - 12. Fang, F., Li, F., Zhan, G. and Shen, C. (2013) A Variational Method for Multisource Remote-Sensing Image Fusion. International Journal of Remote Sensing, 34, 2470-2486.
http://dx.doi.org/10.1080/01431161.2012.744882 - 13. Pohl, C. and van Genderen, J. (2014) Remote Sensing Image Fusion: An Update in the Context of Digital Earth. International Journal of Digital Earth, 7, 158-172.
http://dx.doi.org/10.1080/17538947.2013.869266 - 14. Pour, A.B. and Hashim, M. (2014) Integrating PALSAR and ASTER Data for Mineral Deposits Exploration in Tropical Environments: A Case Study from Central Belt, Peninsular Malaysia. International Journal of Image and Data Fusion, 6, 170-188.
http://dx.doi.org/10.1080/19479832.2014.985619 - 15. Pohl, C. and Van Genderen, J.L. (1998) Multisensor Image Fusion in Remote Sensing: Concepts, Methods and Applications. International Journal of Remote Sensing, 19, 823-854.
http://dx.doi.org/10.1080/014311698215748 - 16. Joshi, N., Baumann, M., Ehammer, A., Fensholt, R., Grogan, K., Hostert, P., Jepsen, M.R., Kuemmerle, T., Meyfroidt, P., Mitchard, E.T.A., Reiche, J., Ryan, C.M. and Waske, B. (2016) A Review of the Application of Optical and Radar Remote Sensing Data Fusion to Land Use Mapping and Monitoring. Remote Sensing, 8, 70.
http://dx.doi.org/10.3390/rs8010070 - 17. Gillespie, A.R., Kahle, A.B. and Walker, R.E. (1986) Color Enhancement of Highly Correlated Images: I. Decorrelation and HIS Contrast Stretches. Remote Sensing of Environment, 20, 209-235.
http://dx.doi.org/10.1016/0034-4257(86)90044-1 - 18. Daily, M.I. (1983) Hue-Saturation-Intensity Split-Spectrum Processing of Seasat Radar Imagery. Photogrammetric Engineering and Remote Sensing, 49, 349-355.
- 19. Welch, R. and Ehlers, M. (1987) Merging Multiresolution SPOT HRV and Landsat TM Data. Photogrammetric Engineering and Remote Sensing, 53, 301-303.
- 20. Harris, J.R. and Murray, R. (1990) IHS Transform for the Integration of Radar Imagery with Other Remotely Sensed Data. Photogrammetric Engineering and Remote Sensing, 56, 1631-1641.
- 21. Mekonnen, S.Z. (2008) Geological and Mineral Potential Mapping by Geosciences Data Integration. Master Thesis, International Institute for Geo-information Science and Earth Observation, ITC, Enschede, The Netherlands, 112 p.
- 22. Pal, S.K., Majumdar, T.J. and Bhattacharya, A.K. (2007) ERS-2 SAR and IRS-1C LISS III Data Fusion: A PCA Approach to Improve Remote Sensing Based Geological Interpretation. ISPRS Journal of Photogrammetry and Remote Sensing, 61, 281-297.
http://dx.doi.org/10.1016/j.isprsjprs.2006.10.001 - 23. Rogge, D.M., Halden, N.M. and Beaumont-Smith, C.J. (2000) Mineralization-Potential Mapping: A Data-Fusion Analysis. Report of Activities 2000, Manitoba Industry, Trade and Mines, Manitoba Geological Survey, 82-90.
- 24. Pavlic, G., Singhroy, V., Duk-Rodkin, A. and Alasset, P.J. (2008) Satellite Data Fusion Techniques for Terrain and Surficial Geological Mapping. IEEE International Geoscience and Remote Sensing Symposium, Boston, 7-11 July 2008, III-314-III-317.
http://dx.doi.org/10.1109/IGARSS.2008.4779346 - 25. Bahiru, E.A. and Woldai, T. (2016) Integrated Geological Mapping Approach and Gold Mineralization in Buhweju Area, Uganda. Ore Geology Reviews, 72, 777-793.
http://dx.doi.org/10.1016/j.oregeorev.2015.09.010 - 26. Fonseca, L.M.G. and Manjunath, B.S. (1996) Registration Techniques for Multi-Sensor Remotely Sensed Imagery. Photogrammetric Engineering and Remote Sensing, 62, 1049-1056.
- 27. PCI-Geomatics (2015) Using PCI Software. Richmond Hill, ON, Canada.
http://www.pcigeomatics.com/ - 28. Ethiopian National Meteorological Services Agency (2001) Initial National Communication of Ethiopia to the United Nations Framework Convention on Climate Change (UNFCCC). Ministry of Water Resources, Federal Democratic Republic of Ethiopia, 127 p.
http://unfccc.int/resource/docs/natc/ethnc1.pdf - 29. Peshkepia, A. and Harnois, L. (2012) Benishangul Gumuz, Ethiopia. Independent Technical Report prepared by Caracle Creek International Consulting Inc., 177 p.
http://www.auriginresources.com/assets/pdf/ethiopia_tech_report.pdf - 30. Managem Mineral ONA Group in Morocco (2011) Technical Work Program for Gold and Base Metals Exploration. Internal Report, 22 p.
- 31. Japan Space Systems (2012) PALSAR User’s Guide. 2nd Edition.
https://www.scribd.com/document/208847444/Palsar-User-Guide - 32. NASA (2013) Landsat 5 Sets Guinness World Record for “Longest Operating Earth Observation Satellite”.
https://www.nasa.gov/mission_pages/landsat/news/landsat5-guinness.html - 33. Welch, R., Jordan, T., Lang, H. and Murakami, H. (1998) ASTER as a Source for Topographic Data in the Late 1990s. IEEE Transactions on Geoscience and Remote Sensing, 36, 1282-1289.
http://dx.doi.org/10.1109/36.701078 - 34. NASA (2014) METI and NASA Release the ASTER Global DEM.
https://lpdaac.usgs.gov/about/news_archive/meti_and_nasa_release_aster_global_dem - 35. Hiranoa, A., Welcha, R. and Langb, H. (2003) Mapping from ASTER Stereo Image Data: DEM Validation and Accuracy Assessment. ISPRS Journal of Photogrammetry and Remote Sensing, 57, 356-370.
http://dx.doi.org/10.1016/S0924-2716(02)00164-8 - 36. Chrysoulakis, N., Abrams, M., Feidas, H. and Velianitis, D. (2004) Analysis of ASTER Multispectral Stereo Imagery to Produce DEM and Land Cover Databases for Greek Islands: The REALDEMS Project. In: Prastacos, P., Cortes, U., de Leon, J.L. and Murillo, M., Eds., Proceedings of e-Environment: Progress and Challenge, 411-424.
- 37. Toutin, T. (2002) Impact of Terrain Slope and Aspect on Radargrammetric DEM Accuracy. ISPRS Journal of Photogrammetry and Remote Sensing, 57, 228-240.
http://dx.doi.org/10.1016/S0924-2716(02)00123-5 - 38. Hirt, C., Filmer, M. and Featherstone, W.E. (2010) Comparison and Validation of the Recent Freely Available ASTER-GDEM ver1, SRTM ver4. 1 and GEODATA DEM-9S ver3 Digital Elevation Models over Australia. Australian Journal of Earth Sciences, 57, 337-347.
http://dx.doi.org/10.1080/08120091003677553 - 39. ERSDAC (2011) ASTER-GDEM Version 2. Validation Report, Japan’s Validation Report, 24 p.
http://www.jspacesystems.or.jp/ersdac/GDEM/ver2Validation/Appendix_A_ERSDAC_ GDEM2_validation_report.pdf - 40. NASA (2011) ASTER Global Digital Elevation Map Announcement.
- 41. Meyer, D (2011) ASTER GDEM Version 2—Summary of Validation Results. 27 p.
https://lpdaacaster.cr.usgs.gov/GDEM/Summary_GDEM2_validation_report_final.pdf - 42. USGS (2015) Global Data Explorer for ASTER GDEM Accessibility.
http://gdex.cr.usgs.gov/gdex/ - 43. Shimada, M., Isoguchi, O., Tadono, T. and Kazuo, I. (2009) PALSAR Radiometric and Geometric Calibration. IEEE Transactions on Geoscience and Remote Sensing, 47, 3915-3932.
http://dx.doi.org/10.1109/TGRS.2009.2023909 - 44. Lavalle, M. and Wright, T. (2009) Absolute Radiometric Calibration and Polarimetric Calibration of ALOS-PALSAR Products.
https://earth.esa.int/documents/700255/709910/Calibration_palsar_products_v13.pdf/b9e 33484-3c42-42b4-bbcd-8e224862a8cd?version=1.0 - 45. Lopes, A., Touzi, R. and Nezry, E. (1990) Adaptive Speckle Filters and Scene Heterogeneity. IEEE Transactions on Geoscience and Remote Sensing, 28, 992-1000.
http://dx.doi.org/10.1109/36.62623 - 46. Knipp, K.H. (1993) Speckle Reduction Applied to ERS-1 SAR Images. International Mapping from Space, Proceedings of ISPRS Working Group IV/2, 15, 177-190.
- 47. Bannari, A., Teillet, P.M. and Richardson, G. (1999) Nécessità de l’étalonnage radiomé- trique et standardisation des images numériques de télédétection. Canadian Journal of Remote Sensing, 25, 45-59.
http://dx.doi.org/10.1080/07038992.1999.10855262 - 48. Chander, G., Helder, D.L., Markham, B.L., Dewald, J.D., Kaita, E.-K., Thome, K.J., Micijevic, E. and Ruggles, T.A. (2004) Landsat-5 TM Reflective-Band Absolute Radiometric Calibration. IEEE Transactions on Geoscience and Remote Sensing, 42, 2747-2760.
http://dx.doi.org/10.1109/TGRS.2004.836388 - 49. Teillet, P.M. Fedosejevs, G., Ahern, F.J. and Gauthier, R.P. (1994) Sensitivity of Surface Reflectance Retrieval to Uncertainties in Aerosol Optical Properties. Applied Optics, 33, 3933-3940.
http://dx.doi.org/10.1364/AO.33.003933 - 50. Flood, N. (2014) Continuity of Reflectance Data between Landsat-7 ETM+ and Landsat-8 OLI, for Both Top-of-Atmosphere and Surface Reflectance: A Study in the Australian Land-scape. Remote Sensing, 6, 7952-7970.
http://dx.doi.org/10.3390/rs6097952 - 51. Vermote, E.F., Tanré, D., Deuze, J.L., Herman, M. and Morcrette, J.J. (1997) Second Simulation of the Satellite Signal in the Solar Spectrum, 6S: An Overview. IEEE Transactions on Geoscience and Remote Sensing, 35, 675-686.
http://dx.doi.org/10.1109/36.581987 - 52. Tanré, D. (1982) Interaction rayonnement-aérosols applications à la télédétection et au calcul du bilan radiatif. Thèse de Doctorat d’état, Université des Sciences et Techniques de Lille.
- 53. Teillet, P.M. and Santer, R.P. (1991) Terrain Elevation and Sensor Altitude Dependence in Semi-Analytical Atmospheric Code. Canadian Journal of Remote Sensing, 17, 36-44.
- 54. Richards, J.A. (2013) Remote Sensing Digital Image Analysis. 5th Edition, Springer-Verlag, New York.
http://dx.doi.org/10.1007/978-3-642-30062-2 - 55. Teillet, P.M. (1992) An Algorithm for the Radiometric and Atmospheric Correction of AVHRR Data in the Solar Reflective Channels. Remote Sensing of Environment, 41, 185-195.
http://dx.doi.org/10.1016/0034-4257(92)90077-W - 56. Bannari, A., Morin, D., Bénié, G.B. and Bonn, J.F. (1995) A Theoretical Review of Different Mathematical Models of Geometric Corrections Applied to Remote Sensing Images. Remote Sensing Reviews, 13, 27-47.
http://dx.doi.org/10.1080/02757259509532295 - 57. JAXA (2012) PALSAR User’s Guide. 2nd Edition, 69 p.
https://www.scribd.com/document/208847444/Palsar-User-Guide - 58. Rignot, E.J.M., Kowk, R., Curlander, J.C. and Pang, S.S. (1991) Automated Multisensor Registration: Requirements and Techniques. Photogrammetric Engineering and Remote Sensing, 57, 1029-1038.
- 59. Takeuchi, S. (1993) Image Registration between SAR and TM Data Using DEM and Slant Range Information. Better Understanding of Earth Environment, International Geoscience and Remote Sensing Symposium, Tokyo, 18-21 August 1993, 1351-1353.
http://dx.doi.org/10.1109/igarss.1993.322086 - 60. Radeloff, V., Hill, J. and Mehl, W. (1997) Forest Mapping from Space: Enhanced Satellite Data Processing by Spectral Mixture Analysis and Topographic Corrections. Space Applications Institute, Environmental Mapping and Modeling Unit, European Commission, Ispra (Italie), 88 p.
- 61. Koutsias, N., Karteris, M. and Chuvieco, E. (2000) The Use of Intensity-Hue-Saturation Transformation of Landsat-5 Thematic Mapper Data for Burned Land Mapping. Photogrammetric Engineering and Remote Sensing, 66, 829-839.
- 62. Escadafal, R., Gouinaud, C., Mathieu, R. and Pouget, M. (1993) Le spectroradiomètre de terrain: Un outil de la télédétection et de la pédologie. Cahier-ORSTOM, Pédologie, 15-29.
- 63. Bannari, A., Ghadeer, A., El-Battay, A., Hameid, M.A. and Rouai, M. (2016) Assessment of Land Erosion and Sediment Accumulation Caused by Runoff after a Flash-Flooding Storm Using Topographic Profiles and Spectral Indices. Advances in Remote Sensing, in Press.
- 64. Kruse, F.A. and Raines, G.L. (1984) Technique for Enhancing Digital Color Images by Contrast Stretching in Munsell Color Space. Proceedings of ISRSE, 755-773.
- 65. Mattikalli, N.M. (1997) Soil Color Modeling for the Visible and Near-Infrared Bands of Landsat Sensors Using Laboratory Spectral Measurements. Remote Sensing of Environment, 59, 14-28.
http://dx.doi.org/10.1016/S0034-4257(96)00075-2 - 66. Liu, J.G. and Moore, J.McM. (1990) Hue Image RGB Colour Composition: A Simple Technique to Suppress Shadow and Enhance Spectral Signature. International Journal of Remote Sensing, 11, 1521-1530.
http://dx.doi.org/10.1080/01431169008955110 - 67. Yésou, Y., Besnus, Y., Rolet, J. and Pion, J.C. (1993) Merging SEASAT and SPOT Imagery for the Study of Geologic Structures in a Temperate Agricultural Region. Remote Sensing of Environment, 43, 265-279.
http://dx.doi.org/10.1016/0034-4257(93)90070-E - 68. Foley, J.D., Van-Dam, A., Feiner, S.K. and Hughes, J.F. (1990) Computer Graphics: Principles and Practice. 2nd Edition, Addison-Wesley Publishing Company, Boston, 592 p.
- 69. Chen, C.M., Hepner, G.F. and Forster, R.R. (2003) Fusion of Hyperspectral and Radar Data Using the IHS Transformation to Enhance Urban Surface Features. ISPRS Journal of Photogrammetry and Remote Sensing, 58, 19-30.
http://dx.doi.org/10.1016/S0924-2716(03)00014-5 - 70. Madeira, J., Bédidi, A. Cervelle, B., Pouget, M. and Flay, N. (1997) Visible Spectrometric Indices of Hematite (Hm) and Goethite (Gt) Content in Lateritic Soils: The Application of a Thematic Mapper (TM) Image for Soil-Mapping in Brasilia, Brazil. International Journal of Remote Sensing, 18, 2835-2852.
http://dx.doi.org/10.1080/014311697217369 - 71. Fontes, M.P.F. and Carvalho, I.A.J. (2005) Color Attributes and Mineralogical Characteristics, Evaluated by Radiometry, of Highly Weathered Tropical Soils. Soil Science Society of America Journal, 69, 1162-1172.
http://dx.doi.org/10.2136/sssaj2003.0312 - 72. Lundén, B., Wester, K. and Bax, G. (1991) Satellite Image Enhancement for Rock Type Separation. Proceedings of IGARSS-91, 2047-2050.
- 73. Maksud-Kamal, A.S.M. and Midorikawa, S. (2003) GIS-Based Geomorphological Mapping Using Remote Sensing Data and Supplementary Geoinformation: A Case Study of the Dhaka City Area, Bangladesh. International Journal of Applied Earth Observation and Geoinformation, 6, 111-125.
http://dx.doi.org/10.1016/j.jag.2004.08.003 - 74. King, C., Baghdadi, N., Lecomte, V. and Cerdan, O. (2005) The Application of Remote-Sensing Data to Monitoring and Modelling of Soil Erosion. Catena, 62, 79-93.
http://dx.doi.org/10.1016/j.catena.2005.05.007 - 75. Al-Rawashdeh, S., Saleh B. and Hamzah, M. (2006) The Use of Remote Sensing Technology in Geological Investigation and Mineral Detection in El Azraq-Jordan. Cyber-Geo: European Journal of Geography, Systèmes, Modélisation, Géostatistiques, 1-21.
- 76. Mars, J.C. and Rowan, L.C. (2007) Mapping Phyllic and Argillic-Altered Rocks in Southeastern Afghanistan Using Advanced Spaceborne Thermal Emission and Reflection Radiometer (ASTER) Data. USGS Open-File Report 2007-1006.
- 77. Karnieli, A., Meisels, A., Fisher, L. and Arkin, Y. (1996) Automatic Extraction and Evaluation of Geological Linear Feature from Digital Remote Sensing. Photogrammetric Engineering and Remote Sensing, 62, 525-531.
- 78. Kocal, A., Duzgun, H.S. and Karpuz, C. (2007) An Accuracy Assessment Methodology for the Remotely Sensed Discontinuities: A Case Study in Andesite Quarry Area, Turkey. International Journal of Remote Sensing, 28, 3915-3936.
http://dx.doi.org/10.1080/01431160601086001 - 79. Geological Map of Ethiopia, Edited in 1972.
https://www.exploratorium.edu/evidence/images/geomap-large.jpg - 80. Mallast, U., Gloaguen, R., Geyer, S., Rodiger, T.R. and Siebert, C. (2011) Semi-Automatic Extraction of Lineaments from Remote Sensing Data and the Derivation of Groundwater Flow-Paths. Hydrology & Earth System Sciences Discussions, 8, 1399-1431.
http://dx.doi.org/10.5194/hessd-8-1399-2011 - 81. Hung, L.Q., Batelaan, O. and De-Smedt, F. (2005) Lineament Extraction and Analysis, Comparison of LANDSAT ETM and ASTER Imagery. Case Study: Suoimuoi Tropical Karst Catchment, Vietnam. Proceedings of SPIE-5983, 59830T, 12 p.