Advances in Remote Sensing
Vol.2 No.1(2013), Article ID:28970,13 pages DOI:10.4236/ars.2013.21003
Remote Monitoring of Wheat Streak Mosaic Progression Using Sub-Pixel Classification of Landsat 5 TM Imagery for Site Specific Disease Management in Winter Wheat
1Texas A&M AgriLife Research (TAMAR), Vernon, USA
2Texas A&M AgriLife Research (TAMAR), Amarillo Boulevard West, Amarillo, USA
Email: *mustafamirik@gmail.com
Received September 17, 2012; revised October 20, 2012; accepted December 1, 2012
Keywords: Wheat Streak Mosaic Virus; Viral Disease; Remote Sensing of Disease; Disease Mapping; Wheat Disease; Site-Specific Disease Management
ABSTRACT
Wheat streak mosaic (WSM), caused by Wheat streak mosaic virus is a viral disease that affects wheat (Triticum aestivum L.), other grains, and numerous grasses over large geographical areas around the world. To improve disease management and crop production, it is essential to have adequate methods for monitoring disease epidemics at various scales and multiple times. Remote sensing has become an essential tool for monitoring and quantifying crop stress due to biotic and abiotic factors. The objective of our study was to explore the utility of Landsat 5 TM imagery for detecting, quantifying, and mapping the occurrence of WSM in irrigated commercial wheat fields. The infection and progression of WSM was biweekly assessed in the Texas Panhandle during the 2007-2008 crop years. Diseased-wheat was separated from uninfected wheat on the images using a sub-pixel classifier. The overall classification accuracies were >91% with kappa coefficient between 0.80 and 0.94 for disease detection were achieved. Omission errors varied between 2% and 14%, while commission errors ranged from 1% to 21%. These results indicate that the TM image can be used to accurately detect and quantify disease for site-specific WSM management. Remote detection of WSM using geospatial imagery may substantially improve monitoring, planning, and management practices by overcoming some of the shortcomings of the ground-based surveys such as observer bias and inaccessibility. Remote sensing techniques for accurate disease mapping offer a unique set of advantages including repeatability, large area coverage, and cost-effectiveness over the ground-based methods. Hence, remote detection is particularly and practically critical for repeated disease monitoring and mapping over time and space during the course of a growing season.
1. Introduction
Wheat streak mosaic (WSM), caused by Wheat streak mosaic virus (WSMV) is a viral disease that affects wheat (Triticum aestivum L.), barley (Hordeum vulgare L.), oat (Avena sativa L.), maize (Zea mays L.), millet (Panicum setaria), and numerous other grasses over large geographical areas around the world [1-8]. This virus is vectored by the wheat curl mite (Aceria tosichella Keifer) [2] that has several grass species hosts besides wheat [2,9]. Initially, disease symptoms on infected wheat plants are characterized by light chlorotic streaking and mosaicing of young leaves. As the disease progresses, infected plants exhibit extreme chlorosis and stunting, and in severe cases chlorotic leaves become necrotic and the plant eventually dies [2,10-13]. Symptom severity also depends on wheat cultivar, time of infection, temperature, and other environmental conditions that affect vector populations and plant growth [14]. Since its first discovery in 1922 in Nebraska, WSMV has periodically caused severe epidemics, across most of the Great Plains of the United States [3,8,15]. In the Texas Panhandle, much of the wheat is grown as a dual purpose crop, for both winter forage and grain production [10,12]. Studies have demonstrated that WSM reduces yield and quality of both forage and grain in wheat production systems [12,16-18]. Recent studies indicated that infected wheat has less root and shoot biomass than uninfected plant, resulting in severe decrease in water-use efficiency [10,12,13]. WSM has been estimated to decrease annual wheat yields by approximately 5% per year, but local disease epidemics can be highly destructive and result in total crop loss [1-3,6,7,16,19].
Remote sensing has become an essential tool for monitoring and quantifying crop stress due to biotic and abiotic factors [20-26]. Results from greenhouse and field studies have shown that it is possible to observe and quantify changes in crop health using remote sensing over the course of a growing season [27-33]. The presence of a disease or insect feeding leads to reductions in green leaf area and chemical and pigment concentrations, and alteration of cell structure, water and nutrient uptake, and gas exchange, which is known to modify canopy reflectance characteristics. Measuring the light reflected by the canopy area with a remote sensing device, therefore, potentially provides a quick, nondestructive, and inexpensive method for identifying and quantifying infected areas [34]. Optical properties of mature and healthy green leaves, plants, or canopies are characterized by high absorption in the blue (400 - 500 nm) and the red (600 - 700 nm), but high reflectance in the green (500 - 600 nm), and very high reflectance and transmitance in the near infrared (NIR: 700 - 1500 nm) range [35-37]. Spectral responses of vegetation in the visible (400 - 700 nm) region are primarily governed by the abundance of chlorophylls, carotenoids, and anthocyanins [38,39]. The optical properties of vegetation in the NIR are due to the discontinuities between cell walls and intercellular air spaces in internal leaf structure. Reflectance in the shortwave infrared (SWIR: 1200 - 2400 nm) is affected due to absorptions by water, proteins, and other carbon constituents in the vegetation [38,40]. Reduction in green leaf area due to growth limiting factors (pathogens, insect feeding, nutrient deficiencies), leaf senescence, and defoliation causes high reflectance in the visible spectrum due to chlorophyll degradation, low reflectance in NIR due to reduced green leaf area and senescence, and high reflectance in SWIR due to modified tissue chemistry [38,40,41].
There are numerous successful applications of stress and disease detection and quantification in wheat and other vegetation canopies using a variety of sensor systems including aerial photographs, airborne and satellite multispectral and hyperspectral sensors, ground-based instruments and other spatial information technologies [42-47]. Significant correlations between spectral reflectance data and symptoms of net blotch (Pyrenophora teres) in barley, glume blotch (Stagonospora nodorum) in winter wheat, and both diseases in spring wheat were reported by [48]. Nilsson and Johnsson [49] found significant correlations between the radiometric assessment of barley stripe disease (Pyrenophora graminea) and grain yield. Lelong et al. [50] identified differences in well-developed and water stressed wheat canopies by analyzing an image. Huang et al. [51] tested the photochemical reflectance index (PRI) derived from hyperspectral imagery to characterize yellow rust (Puccinia striiformis) in wheat and concluded that PRI has the potential for quantifying yellow rust levels in wheat fields. Franke and Menz [52] used multispectral satellite image for quantifying wheat infected by powdery mildew (Blumeria graminis) and leaf rust (Puccinia recondita) at different infective stages in an experimental field. The researchers demonstrated that multispectral images are generally suitable to detect in-field heterogeneities in wheat vigor, particularly for later stages of fungal infections but only moderately appropriate for distinguishing early infection levels in wheat. In addition to studies on insect feeding and foliar diseases in wheat, remote sensing has been effectively used to detect rhizomania in sugar beet (Beta vulgaris) [53]. Several researchers argued that remote sensing is a better method to detect and quantify the impact of plant diseases and insect infestations in vegetation compared to visual techniques because a vegetative unit can be repeatedly, objectively and nondestructively examined in a fast, robust, accurate and inexpensive way [54-58]. In addition, it removes human bias in visual interpretation that can be highly variable among individuals [39,59,60].
Despite the fact that remote detection and quantification of foliar disease and insect infestation have been successful in plant sciences [61-68] and regional occurrence of WSM in the US and other countries, the application of moderate resolution multitemporal imagery to WSM epidemics is still not well studied. Ability to utilize moderate resolution imagery to discriminate and separate WSM from healthy areas within a field can greatly improve monitoring population dynamics, understanding disease ecology, and developing long-term site-specific management practices for WSM. Landsat 5 Thematic Mapper (TM) can provide a sufficient and inexpensive data base for remote sensing of WSM over large regions. In addition, Landsat offers the advantage of continuously collected data and availability of immediate or archived data sets. However, it may have limitations for temporal monitoring due to cloud cover. Processing time required by the image provider for high resolution satellite data that are usually not archived and continuously collected may complicate timely acquisition of data along with cloud cover for monitoring real time occurrence of WSM in commercial wheat fields. Therefore, continuously collected data and availability of Landsat real time images are appealing as a research method for WSM. This research is a continuation of a previous study done by [41] with the following objectives: 1) To explore the utility of Landsat 5 TM imagery for continuous monitoring of WSM progression over time and space for its site-specific management; and 2) To evaluate Constrained Energy Minimization (CEM) sub-pixel classifier to gain improved understanding of the spatial distribution and remote detection of WSM 2.
2. Materials and Methods
2.1. Landsat 5 Thematic Mapper Imagery
During the 2007-2008 wheat growing seasons (September-May), a series of cloud free Landsat 5 TM images covering the northwestern Texas Panhandle with path 30 and row 36 and scene center latitude 34.27˚ and longitude −102.19˚ were obtained every 16 days, which is the revisiting time period of Landsat for the same area. Images were provided by the United State Geological Service (USGS) via the Center for Space Research, University of Texas at Austin with geometric and radiometric corrections. The images were projected to the Universal Transverse Mercator, World Geodetic System 1984, Zone 14 North. Image digital numbers were converted to reflectance using Environment for Visualizing Images software package (ENVI: Exelis Visual Information Solutions, Boulder, CO). Images were subset for a 25600 ha (16 km by 16 km) area including only irrigated comercial wheat fields using ENVI. Images used for this study acquired on March 15 and 31, April 16, May 02 and 18, 2008. Images prior to March 15 were not suitable due to cloud cover or low growth of wheat from livestock grazing. Specification of Landsat 5 TM imagery is presented in Table 1.
2.2. Imagery Classification
Imagery classification was performed using CEM method. CEM was developed for distinguishing sub-pixel abundance of image materials. CEM method is described by ENVI User’s Guide as follows: CEM performs a partial unmixing by only finding the abundance of a single, user-defined endmember (reference spectra), by increasing the response of the target material and suppressing the response of the composite unknown background noise, thus matching the known signature. Using a specific constraint, CEM uses a finite impulse response filter to pass through the desired target while minimizing its
Table 1. Specifications of Landsat 5 TM image used to detect diseased-wheat caused by Wheat streak mosaic virus.
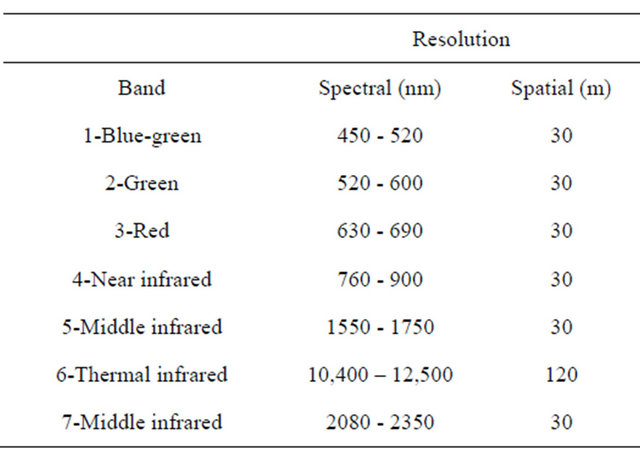
output energy resulting from a background other than the desired targets. The main practical advantage of this spectral mixture analysis is that it does not require that all image endmembers be defined. Therefore, rather than a target endmember, the reflectance spectra of different materials does not have to be identified either from pure pixels in an image or ground collected endmember using a field spectroradiometer. The result of CEM is a greyscale fractional abundance image representing estimated relative degree of match to target endmember. CEM appears to be an appropriate technique for identifying the fractional abundance of a single target material, in our study occurrence of WSM.
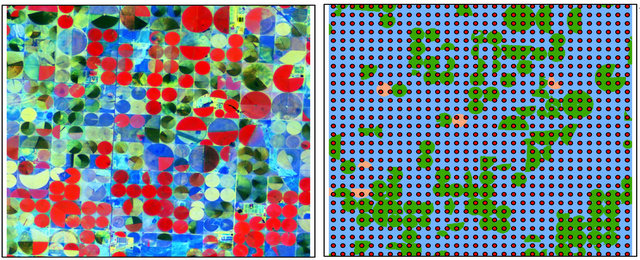
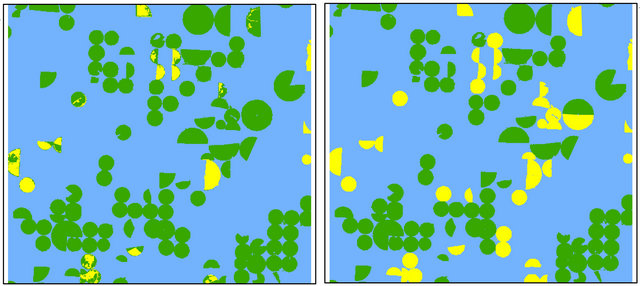
Prior to classification performance, the spectral profile of image endmembers was examined using the mean values of training samples for regardless of healthy wheat, diseased-wheat, canola (Brassica napus), and bare ground (Figure 1). Canola was the only green crop and was in full bloom with yellow flowers in addition to wheat in study area on March 15 (Figure 2(a)). Classification was performed three times on March 15 imagery: One for wheat (healthy and diseased-wheat together), one for canola, and one for bare ground. During the wheat mapping, canola endmember was selected as a non-target to reject for classification and during the canola mapping, wheat endmember was chosen as a non-target to reject for classification. Fractional abundance of each image end member was converted to vector format to produce a seamless map of land use classes (Figure 2(b)). In addition, canola and bare ground land use classes were merged in ArcMap (ESRI, Inc. Redlands, CA) and used to mask out these areas in ENVI for diseased and healthy wheat classification only.
Consequent to wheat, canola, and bare ground classi-
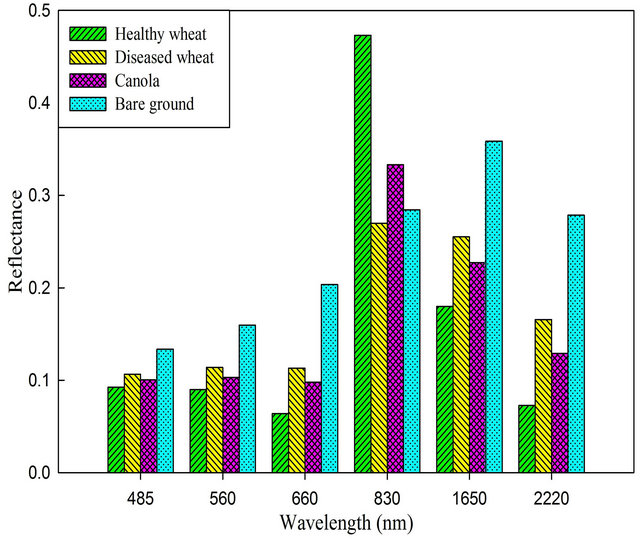
Figure 1. Reflectance characteristics of healthy wheat, diseased-wheat, canola, and bare ground extracted from Landsat 5 TM imagery acquired April 16, 2008.
 (a)
(a)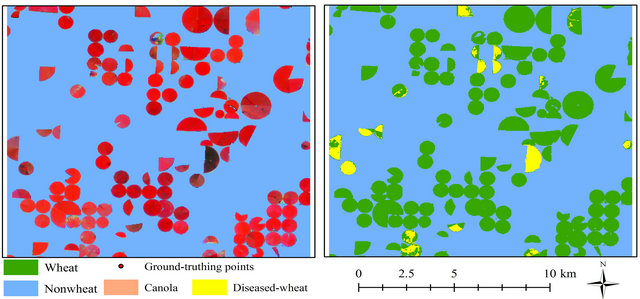 (b)
(b)
Figure 2. Landsat 5 TM color infrared image of study area (a) and classified image with 1024 ground-truthing points for wheat, canola, and bare ground (b), color infrared image masked to keep wheat areas only (c) and classified image for diseased-wheat caused by Wheat streak mosaic virus (d) on March 15, 2008.
fications, non-wheat area (merged canola and bare ground) was used to mask out canola and bare ground in all images to create images containing only wheat areas (Figure 2(c)). After the masking process, wheat-only areas were classified for diseased-wheat using the same classifier (Figure 2(d)). During the diseased-wheat mapping, healthy wheat endmember was chosen as a nontarget to reject for classification. In order to compute diseased-wheat areas, fractional abundance images for all dates were converted to vector format during the subpixel classification.
2.3. Accuracy Assessment
For the classification in present study, region of interest with previously identified diseased-wheat with ocular estimate of >10%, healthy wheat, canola, and bare ground were manually selected in satellite image as the training samples to represent respective classes. Training samples were consisted of 250 pixels for all images classified. For the accuracy assessment, 1024 points with a 500 m equal spacing over the entire study area were generated using the “create fishnet” function in ArcMap. Of these 1024 points (Figure 2(b)), only 276 points fell on wheat areas, therefore, those 276 ground-truthing (groundverification) points were used for accuracy of diseasedwheat classification. The training samples were not included in ground-truthing points. The ground-truthing points were exported to a field computer equipped with the Farm Works software package (CTN Data Service, Hamilton, IN) and a GPS receiver; and were navigated on the ground for field verification. At each verification point, ocular estimate of disease severity >10% was accessed within a 30-m radius. Error matrices for each classification map were generated by comparing the classified categories with the ground data at these points. Error matrices to evaluate the classification accuracy were calculated and included overall accuracy, kappa coefficient, and commission and omission errors.
In order to validate image classification accuracy, and to verify that observed disease symptoms were caused by WSMV, ground surveys were conducted to collect and analyze wheat samples. Wheat samples from groundtruthing points were tested for WSMV within a two-day time frame before or after each image acquisition dates. Wheat samples were collected, placed into plastic bags, and transported to the Great Plains Diagnostic Network, plant pathology laboratory at the Texas A&M AgriLife Research in Amarillo for processing. Each sample consisted of multiple leaves or tillers, and individual samples were collected arbitrarily from 3 - 4 locations within each field for each classified category. Infection by WSMV was verified by double antibody sandwich enzyme-linked immunosorbent assay (DAS-ELISA) using standard Agdia protocol and reagents (Elkhart, IN), with minor modifications [69]. Polystyrene plates (Fisher Scientific, San Francisco, CA) were used to reduce buffer and antibody serum from 100 µl to 50 µl, and WSMV antiserum was used at a 1:200 (vol:vol) dilution. Tissue was ground at a ratio of 1 g:10 ml extraction buffer. Individual sample wells were evaluated by absorbance at 405 nm using an Emax precision microplate reader (Molecular Devices Corp., Union City, CA). Tissues from non-inoculated wheat grown in a greenhouse served as controls. Absorbance values greater than 3 times the healthy controls were considered positive.
3. Results
The spectral profile of vegetation image endmembers (crops only) clearly indicated that separability of wheat and canola endmembers largely occurred in the near infrared (NIR) band centered at 830 nm of TM imagery. High separability of bare ground from wheat and canola endmembers occurred in the band centered at 2200 nm. Therefore, only these two bands were used during the classification. Similar to reflectance from wheat and canola, the largest difference in reflectance between healthy and diseased-wheat occurred in the NIR band centered at 830 nm (Figure 1).
Classification of the Landsat TM image collected on March 15 for wheat, canola, and bare ground revealed that overall classification accuracy was 100% with 0% commission and omission errors (Table 2). Classification identified about 9014 ha wheat in a 25600 ha study area. Of this total wheat, 17.6% was classified as diseasedwheat. Overall, 97% of the known ground-truthing points were classified correctly with a kappa value of 0.81 (Table 3, Figure 2(d)).
Omission errors were 14% for diseased-wheat and 2% for healthy wheat, whereas commission errors were 21% for diseased-wheat and 1% for healthy wheat. Classification of March 31 image indicated that diseased-wheat areas increased approximately 1.3% and classification accuracy decreased approximately 3% with kappa coefficient of 0.83 from mid-March to late March. On March 31, omission and commission errors decreased for diseased-wheat, whereas the same error rates slightly increased for healthy wheat compared to March 15 (Table 2, Figure 3(a)).
Classification of the image acquired on April 16 revealed that WSM was quickly spread and infected wheat areas increased from 18.9% to 36.12% from late March to mid-April. The overall accuracy for April image was 93% with a kappa value of 0.80 (Table 3, Figure 3(b)). Approximately 4% of diseased-wheat was included into healthy wheat category (commission error), whereas approximately 6% of healthy wheat was misclassified as diseased-wheat (omission error) by the classification method performed. For this date, approximately 17% of healthy wheat was erroneously classified as diseasedwheat, while about 12% of disease wheat was included in healthy wheat category.
On May 2 and 18, there were about 5.8% and 6.54% increases in diseased-wheat areas, respectively, when compared to areas in mid-April. Overall classification accuracies were 97 and 92% with kappa values of 0.94
Table 2. Classification accuracies for wheat, canola, and bare ground land use classes using Landsat 5 TM imagery acquired on March 15, 2008.
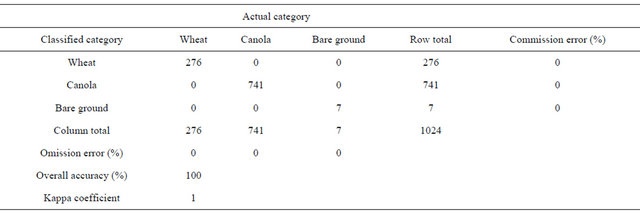
Table 3. Classification accuracies for diseased-wheat caused by Wheat streak mosaic virus using Landsat 5 TM images acquired on March 15 and 31, on April 18, and May 2 and 18, 2008.
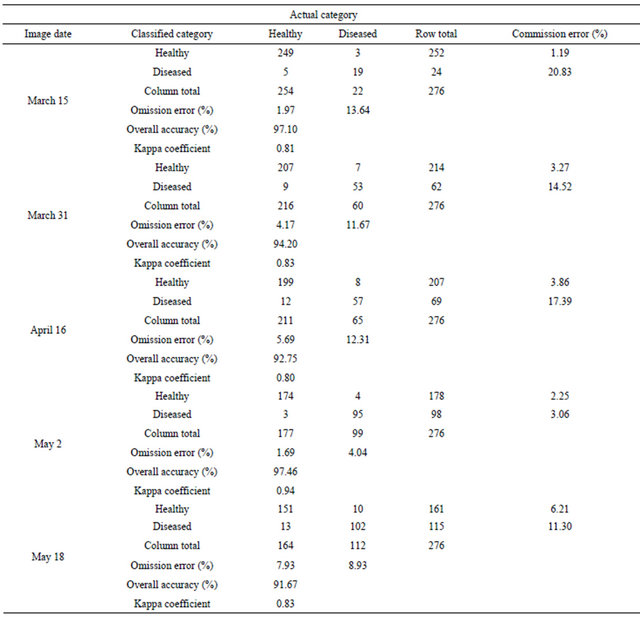
and 0.83 for diseased and healthy wheat, respectively, for the same dates (Table 3, Figures 3(c) and (d)). On May 2, diseased and healthy wheat had about 4% and 2% omission error, whereas commission errors were about 3 and 2%, respectively. Healthy wheat had about 6% commission error and 8% omission error, while the same errors were 11 and 9%, respectively for diseased-wheat on May 18.
4. Discussion
In the Texas Panhandle and throughout the Southwestern Great Plains, much of the winter wheat crop is irrigated with ground water from the Ogallala aquifer. Grain yields from irrigated wheat are often 3 - 4 times greater than dryland production, but reduced water levels in much of the aquifer threaten irrigated production. For this reason, research has focused on factors that impact irrigation and crop water use efficiency (WUE). A majority of this effort has addressed the mechanics of water delivery systems, or agronomic and soil physical characteristics that affect WUE, but recent studies have demonstrated the negative impact of WSM on root development and WUE [10,12,13]. Wheat plants, severely infected by WSM, have significantly smaller root systems than healthy plants and are unable to take advantage of available
(a) (b)
(c) (d) 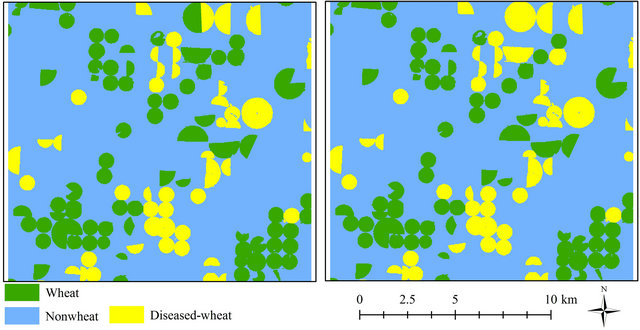
Figure 3. Classified images for diseased-wheat caused by wheat streak mosaic virus on March 31 (a), April 16 (b), May 2 (c) and May 18 (d) 2008.
soil moisture, regardless of the source. For this reason, application of irrigation to severely infected wheat constitutes a waste of time, energy and natural resources, and the economic impact of WSM is significantly greater in irrigated than in dryland production systems [12]. With the advent of site-specific irrigation technology, avoiding irrigation of severely infected wheat could result in significant savings, but to achieve this goal, improved methods of disease detection are needed.
To test the utility of multispectral TM 5 data monitoring, identifying, and mapping of the occurrence of WSM disease in wheat in 2007-2008 crop years, CEM subpixel mapping method was employed for image classification consequent to band selection through examining spectral characteristics of land use classes. Wheat canopies were correctly separated from canola and bare ground. This is a relatively straightforward method for detection of winter wheat because wheat and canola were the only green vegetation in early spring in the study area. Canola was easily separated from the wheat crop, probably due the spectrally distinctive characteristics of its yellow flowers.
Some researchers found that leafy spurge (Euphorbia esula L.) is spectrally distinguishable from the surrounding vegetation due to its yellow-green flower during the flowering stage [70,71] and possibly musk thistle (Carduus nutans L.) due to its large, red-purple flower heads [72]. Some cool-season grass and broad-leaf forb species germinated or greened up in March and areas covered by cool-season species may be confused with wheat. However, typically these areas were limited to ditch banks, roadsides, and waste areas, and were too small to be detected on a 30 by 30 m Landsat image. The methods employed in this study could easily differentiate some green crops such as alfalfa, winter peas, etc. from wheat, but would not be able to easily separate other small grains such as oats, rye or triticale from wheat. However, none of these other crops were noticed during our ground survey of the area we studied.
This study showed that image processing techniques were repeatable between the dates when images were acquired for remote detection of WSM during a growing season. Results of the accuracy assessments for land use classes demonstrated an overall accuracy of 100%. This implies that Landsat 5 TM imagery can be reliably used for winter crop inventory in the region. The accuracy assessments for WSM presence and absence confirmed overall accuracies between 92% and 97%. This indicates that the method used in this study can be used for large area disease monitoring during the growing seasons. High values of overall accuracy as well as low commission and omission errors illustrate that healthy wheat and wheat exhibiting low to severe symptoms of WSM was detectable in multi-temporal-multi-spectral images. An overall accuracy of 80% for remote detection of yellow rust in winter wheat was found [73]. The overall accuracies of 65.9% and 88.6% for winter wheat infected by leaf rust and powdery mildew using an airborne hyperspectral HyMap image with a spatial resolution of 4 m and a QuickBird satellite image with a spatial resolution of 2.4 m were reported, respectively, [52]. The researchers concluded that high-resolution multispectral imagers were appropriate to distinguish in field heterogeneities in wheat vigor, in particular when the crop is severely diseased. Healthy and diseased-wheat infected by yellow rust were discriminated with a success rate of 96% using spectral images collected with a spectrograph in a field study [74]. The authors pointed out that their results were encouraging for the development of a cost-effective optical device for recognizing disease in the field during the early spring. The areas where sugarcane was infected by orange rust from disease free areas were distinguished using Hyperion imagery with 30 m by 30 m spatial resolution and concluded that this imagery can be used to detect orange rust disease in sugarcane [75]. Landsat 7 Image intensity had higher r2 values for soybean cyst nematode, Heterodera glycines, population density, soybean oil and protein concentrations, but had lower r2 values for soybean yield compared to either aerial image intensity or ground-based percentage reflectance measurements [76].
Early stages of WSM symptom expression were <10% when only a few chlorotic streaks were present on leaves were not considered for identification of diseased-wheat in this study because earlier studies found that remote sensing images are not suitable for detecting initial symptoms of infection [52,77-80]. Even though slightly symptomatic plants were not included in our study as diseased, this omission was not considered problematic because the goal was to quantify moderate to severe symptoms of WSM that ultimately would result in reduced forage or grain yields. WSM is a progressive disease, and late infections, which result in greatly reduced symptom expression, cause significantly less damage to the crop [10, 13,41]. Late infections that were not quantified in this study in mid-April or afterward likely had no negative effect on crop yield. Furthermore, light infections that occurred early in the season and were not quantified in the earliest spring images, likely were included in later images, if they developed into severe, yield limiting diease.
The ability to easily and repeatedly monitor large areas during the growing season, at low cost, is perhaps the greatest advantage of this approach for disease quantification. In a study on powdery mildew and leaf rust of winter wheat, multi-spectral remote sensing imageries were not sensitive enough to distinguish slight disease symptoms when only lower leaves were infected by powdery mildew, but were capable of detecting high infection rates of leaf rust that rapidly affected whole canopies late in the growing season [52]. A similar result was obtained for late blight caused by Phytophthora infestans, in field tomatoes (Solanum lycopersicum) [80]. Multispectral imageries with a spatial resolution of 1 m were successfully classified into healthy and diseased tomato when disease incidence reached stages 3 and above, but early disease detection below stage 3 was difficult due to its similar spectral response to that of healthy vegetation [80]. Most of the regression models developed for percentage reflectance and percentage defoliation in alfalfa caused by foliar pathogens were insignificant when disease levels were quite low two or more weeks prior to harvest, whereas nearly all models were significant on the day of harvest or one week earlier [79]. Similar regression models were developed that r2 values between percentage reflectance and percentage defoliation caused by foliar pathogens in alfalfa increased as the measurements were made closer to harvest or on the day of harvest [77,78]. On the contrary, the discrimination of powdery mildew and leaf rust in winter wheat was achieved as early as one and two days post inoculation using blue-green and chlorophyll fluorescent [81]. Reflectance in the 350 - 850 nm region of the spectrum was found to be useful for distinguishing bacterial wilt (Ralstonia solanacearum) infected potato (Solanum tuberosum) at the same time as the expert trained eye in 100% of the observations made [27]. Another recent study indicated that remotely sensed data can identify Rhizoctonia crown and root rot caused by Rhizoctonia solani in sugar beet [82]. The level of damage by the black-shank fungus (Phytophthora nicotianae) on tobacco (Nicotiana tabacum) leaves was discriminated using a hyperspectral sensor [83].
5. Conclusions
Regional epidemics of WSM on commercial wheat crops occurred in the Texas Panhandle in 2008. Landsat 5 TM imagery using CEM illustrated the remote monitoring, detection, and mapping of wheat fields with moderate to severe (extensive mosaic streaking to complete leaf chlorosis and stunting of plants) WSM. Detection was provided at a level that allowed accurate disease assessment, and was provided early enough in March to allow producers to make important management decisions, such as whether to continue irrigation, fertilization, and disease control. The current study indicates that high levels of accuracy are achievable for identifying WSM using Landsat 5 TM imagery. This process can therefore provide useful baseline input for real-time monitoring and mapping of WSM, its economics, and wheat inventory. Landsat 5 TM data could be also useful for quantifying past disease epidemics by obtaining and using archived images.
The results of present study demonstrate that there exists high potential to identify and quantify WSM within wheat fields using moderate resolution multitemporal imagery with 30-m pixel size. This can provide producers and managers a quick and repeatable method for WSM management in time and place. Once applied to a particular management unit or farm, the georeferenced disease spots can then be used to facilitate more efficient treatment of WSM with Geographic Information System-based precision farming spray equipment.
6. Acknowledgements
We thank Casey Childers for his technical assistance in this project. We would also like to acknowledge funding provided by the Great Plains Diagnostic Network and the Texas AgriLife Cropping Systems Research Initiative.
REFERENCES
- M. Carew, M. Schiffer, P. Umina, A. Weeks and A. Hoffmann, “Molecular Markers Indicate That the Wheat Curl Mite, Aceria tosichella Keifer, May Represent a Species Complex in Australia,” Bulletin of Entomological Research, Vol. 99, No. 5, 2009, pp. 479-486. doi:10.1017/S0007485308006512
- B. A. Coutts, G. R. Strickland, M. A. Kehoe, D. L. Severtson and R. A. C. Jones, “The Epidemiology of Wheat Streak Mosaic Virus in Australia: Case Histories, Gradients, Mite Vectors, and Alternative Hosts,” Australian Journal of Agricultural Research, Vol. 59, No. 9, 2008, pp. 844-853. doi:10.1071/AR07475
- M. Fahim, A. Mechanicos, L. Ayala-Navarrete, S. Haber and P. J. Larkin, “Resistance to Wheat Streak Mosaic Virus—A Survey of Resources and Development of Molecular Markers,” Plant Pathology, Vol. 61, No. 3, 2012, pp. 425-440.
- R. French and D. C. Stenger, “Evolution of Wheat Streak Mosaic Virus: Dynamics of Population Growth within Plants May Explain Limited Variation,” Annual Review of Phytopathology, Vol. 41, No. 1, 2003, pp. 199-214. doi:10.1146/annurev.phyto.41.052002.095559
- E. S. Jiménez-Martínez and N. A. Bosque-Pérez, “Life History of the Bird Cherry-Oat Aphid, Rhopalosiphum padi, on Transgenic and Non-Transformed Wheat Challenged with Wheat Streak Mosaic Virus,” Entomologia Experimentalis et Applicata, Vol. 133, No. 1, 2009, pp. 19-26. doi:10.1111/j.1570-7458.2009.00905.x
- M. Murugan, P. S. Cardona, P. Duraimurugan, A. E. Whitfield, D. Schneweis, S. Starkey and C. M. Smith, “Wheat Curl Mite Resistance: Interactions of Mite Feeding with Wheat Streak Mosaic Virus Infection,” Journal of Economic Entomology, Vol. 104, No. 4, 2011, pp. 1406-1414. doi:10.1603/EC11112
- M. Schiffer, P. Umina, M. Carew, A. Hoffmann, B. Rodoni and A. Miller, “The Distribution of Wheat Curl Mite (Aceria tosichella) Lineages in Australia and Their Potential to Transmit Wheat Streak Mosaic Virus,” Annals of Applied Biology, Vol. 155, No. 3, 2009, pp. 371-379. doi:10.1111/j.1744-7348.2009.00349.x
- D. C. Stenger and R. French, “Wheat Streak Mosaic Virus Genotypes Introduced to Argentina Are Closely Related to Isolates from the American Pacific Northwest and Australia,” Archives of Virology, Vol. 154, No. 2, 2009, pp. 331-336. doi:10.1007/s00705-008-0297-1
- T. L. Harvey, D. L. Seifers and T. J. Martin, “Host Range Differences between Two Strains of Wheat Curl Mites (Acari: Eriophyidae),” Journal of Agricultural and Urban Entomology, Vol. 18, No. 1, 2001, pp. 35-41.
- J. A. Price, F. Workneh, S. R. Evett, D. C. Jones, J. Arthur and C. M. Rush, “Effects of Wheat Streak Mosaic Virus on Root Development and Water-Use Efficiency of Hard Red Winter Wheat,” Plant Disease, Vol. 94, No. 6, 2010, pp. 766-770. doi:10.1094/PDIS-94-6-0766
- H. Sánchez-Sánchez, M. Henry, E. Cárdenas-Soriano and H. F. Alvizo-Villasana, “Identification of Wheat Streak Mosaic Virus and Its Vector Aceria tosichella in Mexico,” Plant Disease, Vol. 85, No. 1, 2001, pp. 13-17. doi:10.1094/PDIS.2001.85.1.13
- M. Velandia, R. M. Rejesus, D. C. Jones, J. A. Price, F. Workneh and C. M. Rush, “Economic Impact of Wheat Streak Mosaic Virus in the Texas High Plains,” Crop Protection, Vol. 29, No. 7, 2010, pp. 699-703. doi:10.1016/j.cropro.2010.02.005
- F. Workneh, J. A. Price, D. C. Jones and C. M. Rush, “Wheat Streak Mosaic: A Classic Case of Plant Disease Impact on Soil Water Content and Crop Water-Use Efficiency,” Plant Disease, Vol. 94, No. 6, 2010, pp. 771-774. doi:10.1094/PDIS-94-6-0771
- L. A. Divis, R. A. Graybosch, C. J. Peterson, P. S. Baenziger, G. L. Hein, B. B. Beecher and T. J. Martin, “Agronomic and Quality Effects in Winter Wheat of a Gene Conditioning Resistance to Wheat Streak Mosaic Virus,” Euphytica, Vol. 152, No. 1, 2006, pp. 41-49. doi:10.1007/s10681-006-9174-8
- G. I. Dwyer, M. J. Gibbs, A. J. Gibbs and R. A. C. Jones, “Wheat Streak Mosaic Virus in Australia: Relationship to Isolates from the Pacific Northwest of the USA and Its Dispersion via Seed Transmission,” Plant Disease, Vol. 91, No. 2, 2007, pp. 164-170. doi:10.1094/PDIS-91-2-0164
- M. Fahim, H. Dove, W. M. Kelman, L. Ayala-Navarrete and P. J. Larkin, “Does Grazing of Infected Wheat by Sheep Result in Salivary Transmission of Wheat Streak Mosaic Virus?” Crop and Pasture Science, Vol. 61, No. 3, 2010, pp. 247-254. doi:10.1071/CP09301
- R. M. Hunger, J. L. Sherwood, C. K. Evans and J. R. Montana, “Effects of Planting Date and Inoculation Date on Severity of Wheat Streak Mosaic in Hard Red Winter Wheat Cultivars,” Plant Disease, Vol. 76, No. 10, 1992, pp. 1056-1060. doi:10.1094/PD-76-1056
- H. Li, R. L. Conner, Q. Chen, R. J. Graf, A. Lorache, F. Ahmad and A. D. Kuzyk, “Promising Genetic Resources for Resistance to Wheat Streak Mosaic Virus and the Wheat Curl Mite in Wheat—Thinopyrum Partial Amphiploids and Their Derivatives,” Genetic Resources and Crop Evolution, Vol. 51, No. 8, 2004, pp. 827-835.
- E. Sivamani, C. W. Brey, L. E. Talbert, M. A. Young, W. E. Dyer, W. K. Kaniewski and R. Qu, “Resistance to Wheat Streak Mosaic Virus in Transgenic Wheat Engineered with the Viral Coat Protein Gene,” Transgenic Research, Vol. 11, No. 1, 2002, pp. 31-41.
- B. Chen, S. Li, K. Wang, G. Zhou and J. Bai, “Evaluating the Severity Level of Cotton Verticillium Using Spectral Signature Analysis,” International Journal of Remote Sensing, Vol. 33, No. 9, 2012, pp. 2706-2724. doi:10.1080/01431161.2011.619586
- I. Herrmann, M. Berenstein, A. Sade, A. Karnieli, D. J. Bonfil and P. G. Weintraub, “Spectral Monitoring of TwoSpotted Spider Mite Damage to Pepper Leaves,” Remote Sensing Letters, Vol. 3, No. 4, 2012, pp. 277-283. doi:10.1080/01431161.2011.576709
- S. A. O’Shaughnessy, S. R. Evett, P. D. Colaizzi and T. A. Howell, “Using Radiation Thermography and Thermometry to Evaluate Crop Water Stress in Soybean and Cotton,” Agricultural Water Management, Vol. 98, No. 10, 2011, pp. 1523-1535. doi:10.1016/j.agwat.2011.05.005
- R. O. Pacumbaba Jr. and C. A. Beyl, “Changes in Hyperspectral Reflectance Signatures of Lettuce Leaves in Response to Macronutrient Deficiencies,” Advances in Space Research, Vol. 48, No. 1, 2011, pp. 32-42. doi:10.1016/j.asr.2011.02.020
- S. S. Ray, N. Jain, R. K. Arora, S. Chavan and S. Panigrahy, “Utility of Hyperspectral Data for Potato Late Blight Disease Detection,” Journal of the Indian Society of Remote Sensing, Vol. 39, No. 2, 2011, pp. 161-169. doi:10.1007/s12524-011-0094-2
- B. B. M. Sridhar, R. K. Vincent, S. J. Roberts and K. Czajkowski, “Remote Sensing of Soybean Stress as an Indicator of Chemical Concentration of Biosolid Amended Surface Soils,” International Journal of Applied Earth Observation and Geoinformation, Vol. 13, No. 4, 2011, pp. 676-681. doi:10.1016/j.jag.2011.04.005
- N. Subash, H. S. R. Mohan and K. Banukumar, “Comparing Water-Vegetative Indices for Rice (Oryza sativa L.) —Wheat (Triticum aestivum L.) Drought Assessment,” Computers and Electronics in Agriculture, Vol. 77, No. 2, 2011, pp. 175-187. doi:10.1016/j.compag.2011.05.001
- P. Chávez, C. Yarlequé, H. Loayza, V. Mares, P. Hancco, S. Priou, M. P. Márquez, A. Posadas, P. Zorogastúa, J. Flexas and R. Quiroz, “Detection of Bacterial Wilt Infection Caused by Ralstonia solanacearum in Potato (Solanum tuberosum L.) through Multifractal Analysis Applied to Remotely Sensed Data,” Precision Agriculture, Vol. 13, No. 2, 2012, pp. 236-255. doi:10.1007/s11119-011-9242-5
- P. Chávez, C. Yarlequé, O. Piro, A. Posadas, V. Mares, H. Loayza, C. Chuquillanqui, P. Zorogastúa, J. Flexas and R. Quiroz, “Applying Multifractal Analysis to Remotely Sensed Data for Assessing PYVV Infection in Potato (Solanum tuberosum L.) Crops,” Remote Sensing, Vol. 2, No. 5, 2010, pp. 1197-1216. doi:10.3390/rs2051197
- U. R. Rosyara, S. Subedi, E. Duveiller and R. C. Sharma, “Photochemical Efficiency and SPAD Value as Indirect Selection Criteria for Combined Selection of Spot Blotch and Terminal Heat Stress in Wheat,” Journal of Phytopathology, Vol. 158, No. 11-12, 2010, pp. 813-821. doi:10.1111/j.1439-0434.2010.01703.x
- H. Santoso, T. Gunawan, R. H. Jatmiko, W. Darmosarkoro and B. Minasny, “Mapping and Identifying Basal Stem Rot Disease in Oil Palms in North Sumatra with QuickBird Imagery,” Precision Agriculture, Vol. 12, No. 2, 2011, pp. 233-248.
- H. Z. M. Shafri, M. I. Anuar, I. A. Seman and N. M. Noor, “Spectral Discrimination of Healthy and Ganoderma-Infected Oil Palms from Hyperspectral Data,” International Journal of Remote Sensing, Vol. 32, No. 22, 2011, pp. 7111-7129. doi:10.1007/s11119-010-9172-7
- C. Yang, S. M. Greenberg, J. H. Everitt and C. J. Fernandez, “Assessing Cotton Defoliation, Regrowth Control and Root Rot Infection Using Remote Sensing Technology,” International Journal of Agricultural and Biological Engineering, Vol. 4, No. 4, 2011, pp. 1-11.
- D. Y. Zhang, J. C. Zhang, D. Z. Zhu, J. H. Wang, J. H. Luo, J. L. Zhao and W. J. Huang, “Investigation of the Hyperspectral Image Characteristics of Wheat Leaves under Different Stress,” Guang Pu Xue Yu Guang Pu Fen Xi/ Spectroscopy and Spectral Analysis, Vol. 31, No. 4, 2011, pp. 1101-1105.
- M. Mirik, G. J. Michels, S. K. Mirik, N. C. Elliott and V. Catana, “Spectral Sensing of Aphid (Hemiptera: Aphididae) Density Using Field Spectrometry and Radiometry,” Turkish Journal of Agriculture and Forestry, Vol. 30, No. 5, 2006, pp. 421-428.
- W. Huang, X. Song, D. W. Lamb, Z. Wang, Z. Niu, L. Liu and J. Wang, “Estimation of Winter Wheat Grain Crude Protein Content from in Situ Reflectance and Advanced Spaceborne Thermal Emission and Reflection Radiometer Image,” Journal of Applied Remote Sensing, Vol. 2, No. 1, Article ID: 023530. doi:10.1117/1.2968954
- S. V. Ollinger, “Sources of Variability in Canopy Reflectance and the Convergent Properties of Plants,” New Phytologist, Vol. 189, No. 2, 2011, pp. 375-394. doi:10.1111/j.1469-8137.2010.03536.x
- G. Samseemoung, H. P. W. Jayasuriya and P. Soni, “Oil Palm Pest Infestation Monitoring and Evaluation by Helicopter-Mounted, Low Altitude Remote Sensing Platform,” Journal of Applied Remote Sensing, Vol. 5, No. 1, 2011, Article ID: 053540. doi:10.1117/1.3609843
- C. V. M. Barton, “Advances in Remote Sensing of Plant Stress,” Plant and Soil, Vol. 354, No. 1-2, 2012, p. 41.
- M. Mirik, R. J. Ansley, G. J. J. Michels and C. N. Elliot, “Spectral Vegetation Indices Selected for Quantifying Russian Wheat Aphid (Diuraphis noxia) Feeding Damage in Wheat (Triticum aestivum L.),” Precision Agriculture, Vol. 13, No. 4, 2012, pp. 501-516. doi:10.1007/s11119-012-9264-7
- D. Moshou, C. Bravo, R. Oberti, J. S. West, H. Ramon, S. Vougioukas and D. Bochtis, “Intelligent Multi-Sensor System for the Detection and Treatment of Fungal Diseases in Arable Crops,” Biosystems Engineering, Vol. 108, No. 4, 2011, pp. 311-321. doi:10.1016/j.biosystemseng.2011.01.003
- M. Mirik, D. C. Jones, J. A. Price, F. Workneh, R. J. Ansley and C. M. Rush, “Satellite Remote Sensing of Wheat Infected by Wheat streak mosaic virus,” Plant Disease, Vol. 95, No. 1, 2011, pp. 4-12. doi:10.1094/PDIS-04-10-0256
- G. F. Backoulou, N. C. Elliott, K. L. Giles, M. Phoofolo, V. Catana, M. Mirik and J. Michelsd, “Spatially Discriminating Russian Wheat Aphid Induced Plant Stress from Other Wheat Stressing Factors,” Computers and Electronics in Agriculture, Vol. 78, No. 2, 2011, pp. 123-129.
- K. H. Dammer, B. Möller, B. Rodemann and D. Heppner, “Detection of Head Blight (Fusarium ssp.) in Winter Wheat by Color and Multi-Spectral Image Analyses,” Crop Protection, Vol. 30, No. 4, 2011, pp. 420-428. doi:10.1016/j.cropro.2010.12.015
- A. M. H. Elmetwalli, A. N. Tyler, P. D. Hunter and C. A. Salt, “Detecting and Distinguishing Moistureand Salinity-Induced Stress in Wheat and Maize through in Situ Spectroradiometry Measurements,” Remote Sensing Letters, Vol. 3, No. 4, 2012, pp. 363-372. doi:10.1080/01431161.2011.599346
- Z. Y. Liu, H. F. Wu and J. F. Huang, “Application of Neural Networks to Discriminate Fungal Infection Levels in Rice Panicles Using Hyperspectral Reflectance and Principal Components Analysis,” Computers and Electronics in Agriculture, Vol. 72, No. 2, 2010, pp. 99-106. doi:10.1016/j.compag.2010.03.003
- T. Mewes, J. Franke and G. Menz, “Spectral Requirements on Airborne Hyperspectral Remote Sensing Data for Wheat Disease Detection,” Precision Agriculture, Vol. 12, No. 6, 2011, pp. 795-812. doi:10.1007/s11119-011-9222-9
- J. Zhao, D. Zhang, J. Luo, D. Wang and W. Huang, “Identifying Leaf-Scale Wheat Aphids Using the Near-Ground Hyperspectral Pushbroom Imaging Spectrometer,” Springer, New York, 2012.
- H. E. Nilsson, “Hand-Held Radiometry and IR Thermography of Plant Diseases in Field Plot Experiments,” International Journal of Remote Sensing, Vol. 12, No. 3, 1991, pp. 545-557.
- H. Nilsson and L. Johnsson, “Hand-held Radiometry of Barley Infected by Barley Stripe Disease in a Field Experiment,” Journal of Plant Disease and Protection, Vol. 103, No. 5, 1996, pp. 517-526.
- C. C. D. Lelong, P. C. Pinet and H. Poilvé, “Hyperspectral Imaging and Stress Mapping in Agriculture: A Case Study on Wheat in Beauce (France),” Remote Sensing of Environment, Vol. 66, No. 2, 1998, pp. 179-191. doi:10.1016/S0034-4257(98)00049-2
- W. Huang, D. W. Lamb, Z. Niu, Y. Zhang, L. Liu and J. Wang, “Identification of Yellow Rust in Wheat Using inSitu Spectral Reflectance Measurements and Airborne Hyperspectral Imaging,” Precision Agriculture, Vol. 8, No. 4-5, 2007, pp. 187-197. doi:10.1007/s11119-007-9038-9
- J. Franke and G. Menz, “Multi-Temporal Wheat Disease Detection by Multi-Spectral Remote Sensing,” Precision Agriculture, Vol. 8, No. 3, 2007, pp. 161-172. doi:10.1007/s11119-007-9036-y
- K. Steddom, G. Heidel, D. Jones and C. M. Rush, “Remote Detection of Rhizomania in Sugar Beets,” Phytopathology, Vol. 93, No. 6, 2003, pp. 720-726. doi:10.1094/PHYTO.2003.93.6.720
- E. Bauriegel, A. Giebel, M. Geyer, U. Schmidt and W. B. Herppich, “Early Detection of Fusarium Infection in Wheat Using Hyper-Spectral Imaging,” Computers and Electronics in Agriculture, Vol. 75, No. 2, 2011, pp. 304- 312. doi:10.1016/j.compag.2010.12.006
- D. Cammarano, G. Fitzgerald, B. Basso, G. O’Leary, D. Chen, P. Grace and C. Fiorentino, “Use of the Canopy Chlorophyl Content Index (CCCI) for Remote Estimation of Wheat Nitrogen Content in Rainfed Environments,” Agronomy Journal, Vol. 103, No. 6, 2011, pp. 1597-1603. doi:10.2134/agronj2011.0124
- Q. Cheng and X. Wu, “Mapping Paddy Rice Yield in Zhejiang Province Using MODIS Spectral Index,” Turkish Journal of Agriculture and Forestry, Vol. 35, No. 6, 2011, pp. 579-589.
- S. Elsayed, B. Mistele and U. Schmidhalter, “Can Changes in Leaf Water Potential Be Assessed Spectrally?” Functional Plant Biology, Vol. 38, No. 6, 2011, pp. 523-533.
- J. I. N. L. Zhao, D. Y. A. N. Zhang, J. Luo, H. Yang, L. I. N. S. Huang and W. E. N. J. Huang, “A Comparative Study on Monitoring Leaf-Scale Wheat Aphids Using Pushbroom Imaging and Non-Imaging ASD Field Spectrometers,” International Journal of Agriculture & Biology, Vol. 14, No. 1, 2012, pp. 136-140.
- B. M. A. de Coninck, O. Amand, S. L. Delauré, S. Lucas, N. Hias, G. Weyens, J. Mathys, E. de Bruyne and B. P. A. Cammue, “The Use of Digital Image Analysis and RealTime PCR Fine-Tunes Bioassays for Quantification of Cercospora Leaf Spot Disease in Sugar Beet Breeding,” Plant Pathology, Vol. 61, No. 1, 2012, pp. 76-84. doi:10.1111/j.1365-3059.2011.02497.x
- [61] Y. Kim, D. M. Glenn, J. Park, H. K. Ngugi and B. L. Lehman, “Hyperspectral Image Analysis for Water Stress Detection of Apple Trees,” Computers and Electronics in Agriculture, Vol. 77, No. 2, 2011, pp. 155-160. doi:10.1016/j.compag.2011.04.008
- [62] E. M. Abdel-Rahman, F. B. Ahmed, M. van den Berg and M. J. Way, “Potential of Spectroscopic Data Sets for Sugarcane Thrips (Fulmekiola serrata Kobus) Damage Detection,” International Journal of Remote Sensing, Vol. 31, No. 15, 2010, pp. 4199-4216. doi:10.1080/01431160903241981
- [63] M. W. Carroll, J. A. Glaser, R. L. Hellmich, T. E. Hunt, T. W. Sappington, D. Calvin, K. Copenhaver and J. Fridgen, “Use of Spectral Vegetation Indices Derived from Airborne Hyperspectral Imagery for Detection of European Corn Borer Infestation in Iowa Corn Plots,” Journal of Economic Entomology, Vol. 101, No. 5, 2008, pp. 1614- 1623. doi:10.1603/0022-0493(2008)101[1614:UOSVID]2.0.CO;2
- [64] B. Chen, S. k. Li, K. R. Wang, J. Wang, F. Y. Wang, C. H. Xiao, J. C. Lai and N. Wang, “Spectrum Characteristics of Cotton Canopy Infected with Verticillium Wilt and Applications,” Agricultural Sciences in China, Vol. 7, No. 5, 2008, pp. 561-569. doi:10.1016/S1671-2927(08)60053-X
- [65] R. J. Hill, B. A. Wilson, J. E. Rookes and D. M. Cahill, “Use of High Resolution Digital Multi-Spectral Imagery to Assess the Distribution of Disease Caused by Phytophthora cinnamomi on Heathland at Anglesea, Victoria,” Australasian Plant Pathology, Vol. 38, No. 2, 2009, pp. 110-119. doi:10.1071/AP08092
- [66] C. Hillnhütter, A. K. Mahlein, R. A. Sikora and E. C. Oerke, “Remote Sensing to Detect Plant Stress Induced by Heterodera schachtii and Rhizoctonia solani in Sugar Beet Fields,” Field Crops Research, Vol. 122, No. 1, 2011, pp. 70-77. doi:10.1016/j.fcr.2011.02.007
- [67] Z. Y. Liu, J. J. Shi, L. W. Zhang and J. F. Huang, “Discrimination of Rice Panicles by Hyperspectral Reflectance Data Based on Principal Component Analysis and Support Vector Classification,” Journal of Zhejiang University: Science B, Vol. 11, No. 1, 2010, pp. 71-78. doi:10.1631/jzus.B0900193
- [68] M. Prabhakar, Y. Prasad and M. N. Rao, “Remote Sensing of Biotic Stress in Crop Plants and Its Applications for Pest Management,” Springer, New York, 2012.
- [69] D. D. Reisig and L. D. Godfrey, “Remotely Sensing Arthropod and Nutrient Stressed Plants: A Case Study with Nitrogen and Cotton Aphid (Hemiptera: Aphididae),” Environmental Entomology, Vol. 39, No. 4, 2010, pp. 1255- 1263. doi:10.1603/EN09218
- [70] J. A. Price, J. Smith, A. Simmons, J. Fellers and C. M. Rush, “Multiplex Real-Time RT-PCR for Detection of Wheat Streak Mosaic Virus and Tritcum Mosaic Virus,” Journal of Virological Methods, Vol. 165, No. 2, 2010, pp. 198- 201. doi:10.1016/j.jviromet.2010.01.019
- [71] J. J. Michell and E. F. Glenn, “Subpixel Abundance Estimates in Mixture-Tuned Matched Filtering Classifications of Leafy Spurge (Euphorbia esula L.),” International Journal of Remote Sensing, Vol. 30, No. 23, 2009, pp. 6099-6119. doi:10.1080/01431160902810620
- [72] A. P. Williams and E. R. Hunt Jr., “Estimation of Leafy Spurge Cover from Hyperspectral Imagery Using Mixture Tuned Matched Filtering,” Remote Sensing of Environment, Vol. 82, No. 2-3, 2002, pp. 446-456. doi:10.1016/S0034-4257(02)00061-5
- [73] M. Mirik, K. Steddom and G. J. Michels Jr., “Estimating Biophysical Characteristics of Musk Thistle (Carduus nutans) with Three Remote Sensing Instruments,” Rangeland Ecology and Management, Vol. 59, No. 1, 2006, pp. 44-54. doi:10.2111/05-106R2.1
- [74] J. Zhang, W. Huang, J. Li, G. Yang, J. Luo, X. Gu and J. Wang, “Development, Evaluation and Application of a Spectral Knowledge Base to Detect Yellow Rust in Winter Wheat,” Precision Agriculture, Vol. 12, No. 5, 2011, pp. 716-731. doi:10.1007/s11119-010-9214-1
- [75] C. Bravo, D. Moshou, J. West, A. McCartney and H. Ramon, “Early Disease Detection in Wheat Fields Using Spectral Reflectance,” Biosystems Engineering, Vol. 84, No. 2, 2003, pp. 137-145. doi:10.1016/S1537-5110(02)00269-6
- [76] A. Apan, A. Held, S. Phinn and J. Markley, “Detecting Sugarcane ‘Orange Rust’ Disease Using EO-1 Hyperion Hyperspectral Imagery,” International Journal of Remote Sensing, Vol. 25, No. 2, 2004, pp. 489-498. doi:10.1080/01431160310001618031
- [77] F. W. Nutter Jr., G. L. Tylka, J. Guan, A. J. D. Moreira, C. C. Marett, T. R. Rosburg, J. P. Basart and C. S. Chong, “Use of Remote Sensing to Detect Soybean Cyst Nematode-Induced Plant Stress,” Journal of Nematology, Vol. 34, No. 3, 2002, pp. 222-231.
- [78] J. Guan and F. W. Nutter Jr., “Relationships between Defoliation, Leaf Area Index, Canopy Reflectance, and Forage Yield in the Alfalfa-Leaf Spot Pathosystem,” Computers and Electronics in Agriculture, Vol. 37, No. 1-3, 2002, pp. 97-112. doi:10.1016/S0168-1699(02)00113-8
- [79] J. Guan and F. W. Nutter Jr., “Relationships between Percentage Defoliation, Dry Weight, Percentage Reflectance, Leaf-to-Stem Ratio, and Green Leaf Area Index in the Alfalfa Leaf Spot Pathosystem,” Crop Science, Vol. 42, No. 4, 2002, pp. 1264-1273. doi:10.2135/cropsci2002.1264
- [80] F. W. Nutter Jr., J. Guan, A. R. Gotlieb, L. H. Rhodes, C. R. Grau and R. M. Sulc, “Quantifying Alfalfa Yield Losses Caused by Foliar Diseases in Iowa, Ohio, Wisconsin, and Vermont,” Plant Disease, Vol. 86, No. 3, 2002, pp. 269- 277. doi:10.1094/PDIS.2002.86.3.269
- [81] M. Zhang, Z. Qin and X. Liu, “Remote Sensed Spectral Imagery to Detect Late Blight in Field Tomatoes,” Precission Agriculture, Vol. 6, No. 6, 2005, pp. 489-508. doi:10.1007/s11119-005-5640-x
- [82] K. Bürling, M. Hunsche and G. Noga, “Use of BlueGreen and Chlorophyll Fluorescence Measurements for Differentiation between Nitrogen Deficiency and Pathogen Infection in Winter Wheat,” Journal of Plant Physiology, Vol. 168, No. 14, 2011, pp. 1641-1648. doi:10.1016/j.jplph.2011.03.016
- [83] G. J. Reynolds, C. E. Windels, I. V. MacRae and S. Laguette, “Remote Sensing for Assessing Rhizoctonia Crown and Root Rot Severity in Sugar Beet,” Plant Disease, Vol. 96, No. 4, 2012, pp. 497-505. doi:10.1094/PDIS-11-10-0831
- [84] B. L. Yusuf and Y. He, “Application of Hyperspectral Imaging Sensor to Differentiate between the Moisture and Reflectance of Healthy and Infected Tobacco Leaves,” African Journal of Agricultural Research, Vol. 6, No. 29, 2011, pp. 6267-6280.
NOTES
*Corresponding author.