Advances in Nanoparticles
Vol.06 No.02(2017), Article ID:75245,15 pages
10.4236/anp.2017.62004
Electrospinning Synthesis and Photoluminescence Properties of One-Dimensional SiO2:Tb3+ Nanofibers and Nanobelts
Murad M. A. Abualrejal*, Haifeng Zou*, Jie Chen, Yanhua Song, Ye Sheng
College of Chemistry, Jilin University, Changchun, China

Copyright © 2017 by authors and Scientific Research Publishing Inc.
This work is licensed under the Creative Commons Attribution International License (CC BY 4.0).
http://creativecommons.org/licenses/by/4.0/


Received: March 15, 2017; Accepted: April 4, 2017; Published: April 7, 2017
ABSTRACT
Controlled synthesis of functional photoluminescent materials is of particular interest due to their fascinating optical properties. Herein, highly uniform one-dimensional (1D) SiO2:xTb3+ nanofibers and nanobelts are fabricated by electrospinning method combined with sol-gel method. The as-prepared SiO2:xTb3+ nanofibers are belt-like morphology after calcination. The formation mechanism of SiO2:xTb3+ nanofibers and nanobelts is proposed based on decomposition of polyvinylpyrrolidone (PVP) and crystallization of SiO2. The photoluminescence (PL) intensity of SiO2:xTb3+ nanofibers and nanobelts is Tb3+ ions concentration dependent with a maximum at 4 mol% of Tb3+. Particularly, SiO2:xTb3+ nanofibers and nanobelts exhibit a green emission corresponding to 5D4 → 7Fj transition (541 nm) of Tb3+.
Keywords:
Silica, Electrospinning, Photoluminescence, Terbium Doped-Silica

1. Introduction
Lanthanides have unique photoluminescence properties, which enabled their utilization in diverse application depending on their morphology, size, and composition [1] [2] . Tb3+ is among most intriguing trivalent lanthanides ions, due to its green light emission under near-infrared excitation. The stability, flexibility, biocompatibility, and photoluminescence (PL) characteristics of Tb3+ are substantially improved upon its doping into solid matrixes such as carbon and polymer. For instance, SiO2 is among highly attractive and promising host materials for lanthanides for diverse optical applications. The stabilization PL properties of lanthanides can be enhanced significantly upon their doping into SiO2 matrix. This is owing to its 3D network-like structure, conductivity, transparency, wide band gap, high surface, and thermal durability. For example, Tb3+ doped SiO2 prepared by immersion SiO2-PVA nanocomposite into Tb3+ precursor followed by calcination at 600˚C for 3 h in air and subsequent sintering at 1100˚C revealed a green fluorescence attributed to 5D4 → 7F5 under UV excitation [3] .
This is ascribed to the formation of strong O-Tb complex resulting in reducing the high frequency oscillators and enhancing the PL intensity. Although the great advances in the preparation of Tb/SiO2, mostly reported structures were 0D-like structure with low surface area which devalued their PL properties. This can be avoided by doping Tb3+ into 1D silica nanofibers due to their highly accessible surface area and low density. Electrospinning is a facile, effective, and low-cost method for controlled fabrication lanthanides doped various 1D polymers and metal oxides with various morphologies such as nanofibers, nanobelts, and core-shell for wide range of PL applications. For example, YOF:Ln3+ hollow nanofibers are fabricated by the electrospun RE(CF3COO)3/PVP composite at high-temperature that cannot be obtained by traditional methods owing to high tendency of YF3 to oxidation at high temperature, which exhibits a significant enhancement in the PL intensity of Tb3+ [4] .
Inspired by this, herein 1D SiO2:xTb3+ nanofibers and nanobelts are synthesized by sol-gel combined with electrospinning method, which are facilitating homogeneous doping of Tb3+ into SiO2 matrix without segregation that is highly required to increase the PL activity. PVP is utilized not only for adjusting solution viscosity but also for crosslinking silica molecule and as soft templates for obtaining uniform fibrous shape. The structure, morphology, and photoluminescence properties of SiO2:xTb3+ nanofibers and nanobelts were investigated as a function of Tb3+ concentration.
2. Experimental Section
2.1. Materials
Materials used in this experiment were [TEOS, Si(OC2H5)4] and Poly(vinylpyr- rolidone) (PVP, Mw = 1,300,000) were purchased from Aladdin. Acetic Acid (CH3COOH) and Dimethyl formamide (DMF) were all purchased from the Beijing Fine Chemical Company. Tb(NO3)3 was prepared by dissolving Tb4O7 in dilute nitric acid HNO3 containing H2O2, and evaporating the water in the solutions by heating. All the initial chemicals in this work were used without further purification.
2.2. Preparation of Nanofibers and Nanobelts
The SiO2:xTb3+ nanofibers and nanobelts were prepared by electrospinning. First 1.5 ml of tetraethyl orthosilicate [TEOS, Si(OC2H5)4] was mixed with sufficient volume of acetic acid and N, N-dimethyl formamide (DMF). Different amount of Tb3+ ions (the molar ratio of Tb to Si was 0.02, 0.03, 0.04, 0.05 and 0.06) were put into the solution. Then 1.0 g of Poly (vinylpyrrolidone) (PVP, Mw ≈ 1,300,000) was dissolved in the above solution under stirring at room temperature. The mixture was loaded into a plastic syringe equipped with a 20-gauge needle made of stainless steel. The needle was connected to a high-voltage direct current (dc) supply using a metal clamp. A piece of aluminum foil was used to wrap the surface of a drum that serves as a grounding electrode to collect these nanofibers and nanobelts. The parameters of electrospinning were optimized as follows: the working distance was 20 cm, the diameter of the needle was 20 nm, a voltage of 20 kV was applied to the needle, and the feeding rate of the solution was maintained at 0.2 mm/min. After the electrospinning process, the samples were annealed under air atmosphere at 700˚C to remove the PVP template completely.
2.3. Characterizations
X-ray powder diffraction was measured by a Rigaku D/max-B II X-ray diffractometer with Cu Ka radiation. The field emission scanning electron microscope (FESEM) images were observed by S-4800, Hitachi. Transmission electron microscopy (TEM) images were obtained with a JEM-2000EX TEM (acceleration voltage of 200 kV). The thermogravimetry differential thermal analysis (TG- DTA) was carried out on a Thermal Analysis instrument (SDT 2960, TA Instruments, New Castle, DE) with a heating rate of 10˚C/min. Fourier transform infrared (FT-IR) spectra were performed on a Perkin-Elmer 580B infrared spectrophotometer with the KBr pellet technique. Energy-dispersive spectroscopy (EDS) analysis was performed with an H JEOL JXA-840 EDX system attached to the SEM microscope. The X-ray photoelectronspectra (XPS) were taken using a VG ESCALAB 250 electronenergy spectrometer with Mg Kα (1253.6 eV) as the X-ray excitation source. The reflection spectra were calibrated with the reflection of white BaSO4 (reflection ~100%) in the wavelength region of 200 - 800 nm. The PL measurements were determined using Jobin Yvon FluoroMax-4 luminescence spectrophotometer equipped with a 150 W xenon lamp as the excitation source. All the measurements were performed at room temperature.
3. Results and Discussion
3.1. Thermal Analysis
Figure 1 showed the thermogravimetric analysis curve of the obtained SiO2: 4mol % Tb3+ nanofibers and nanobelts before calcination, which exhibited three weight loss steps. It is well known that the first step between 50˚C and 250˚C was due to the remove of volatile compound such as moisture solvent and monomer. The second step (the range of temperature was between 250˚C and 350˚C) with an exothermic peak at 358.5˚C might be due to the decomposition of the organic intermediates, mainly was the decomposition of side chain of PVP. The third step (350˚C to 570˚C) with an exothermic peak at 505˚C was due to decomposition of main chain of PVP [5] . There was no weight loss after calcined at 700˚C, which meant all the organic components were removed com-

Figure 1. The TGA and DTA patterns of PVP/SiO2:Tb3+ precursor fibers.

Figure 2. The SEM images of SiO2:Tb3+ fibers (a) pre-calcination, (b) post-calcination of low-magnification, (c) high- magnification and (d) TEM image.
pletely and pure SiO2:Tb3+ nanofibers and nanobelts were obtained.
3.2. Morphology and Structure Properties
Figure 2 shows The SEM and TEM images of the sample before and after calcination. In (Figure 2(a)) and (Figure 2(b)), with different magnification we can see that these randomly oriented uniform fibers have smooth surface, due to the bending instability related to the spinning jet. In addition, after calcination process didn’t break the fiber-like morphology but the diameters of calcined SiO2:Tb3+ fibers were greatly decreased because of the decomposition of the organic components (such as PVP) and the formation of inorganic phase. From Figure 2(a) and Figure 2(c) we could see that the obtained SiO2:Tb3+ fibers were smooth and the diameters were about 352 nm (Figure 2(c)) otherwise, that most of the obtained SiO2:Tb3+ fibers were belt-like which may be due to incomplete drying before the fiber reaches the grounded collector [6] . Figure 2(d) gives the TEM image of sample after they had been calcined in air at 700˚C.
The particle morphology, size, and composition are investigated by using SEM. Figure 3 shows the SEM images of SiO2 nanofibers doped with various concentrations 2, 3, 4, 5, and 6 (mol %) of Tb3+ ions. It’s apparently that, highly uniform nanofiberes in a belt-like morphology are obtained with high yield approach 100%. This is due to the partial dying of the injected solution before reaching to the jet that is spreading out on the surface followed by rebounding the jet edges in order to be dried. This led to formation of belt-like fibers with a shallow groove in the middle [7] [8] . The size of the as-synthesized nanofibers ranged between 993 and 142 nm (Figure 3). It’s obvious that, the fiber diameters decrease significantly with increasing the Tb3+ concentrations attributed to the addition of high concentration Tb(NO3)3 solution. That facilitates prompt hydrolysis of Tb3+ to generate a network in the polymer matrix through reaction with the moisture in surrounding air. The direct hydrolysis and condensation raise the viscosity of the PVP/SiO2 solution. This led to increase the durability of the spinning jet and the strength of the sheath in the electrified jet which make the jet spin the solution continuously without any coagulation for the spine fibers [9] [10] . The size distributions of the SiO2:Tb3+ fibers doping different Tb3+ concentrations were displayed in Figure 3, which measured from the SEM images by Image J.
The XRD patterns of SiO2 nanofibers doped with various concentrations of Tb3+ ions are shown in (Figure 4). There only obtains one broad diffraction peaks at 2θ = 24˚ - 25˚ could be assigned to the amorphous silica [11] . Interestingly, the peak shifts to higher angler θ value and became weaker with increasing the Tb3+ concentration implying the successful doping of Tb with SiO2 without undesired impurities in agreement with the SEM and EDX results. This owing to Tb3+ ions occupation the vacancy of matrix SiO2, which has effects on the structural Si-O bond distance and/or Si-O-Si angles by strongly interacted with the O atoms [12] , and then deformed the Si-O-Si network structure and reduced the symmetry of SiO2 framework.
Figure 5 showed a comparison of the FT-IR spectra of SiO2:4 mol % Tb3+ nanofibers before and after calcination at 700˚C. The two samples are referred to as SiO2-untreated and SiO2-700˚C, respectively. The bands at 3430 cm−1 in two lines are attributed to the vibration of ?OH of the absorbed water. For SiO2-untreated sample, the bands from 2800 to 3000 cm−1 and 1465 cm−1 to 1421 cm−1 are assigned to the bending vibration of C-H and C=O. The bands around 1650 cm−1 and 1292 cm−1 can be ascribed to be the bending vibration of C-N [13] . Meanwhile, the bands at 1148 cm−1 and 954 cm−1 were assigned to the asymmetric stretching vibration of the Si-O-Si bond and the bending vibration of the Si-OH bond. For SiO2-700˚C sample, all the peaks related to PVP are disappeared and the vibration of Si-O-Si was prominent. And the position of Si-O-Si bond blue shifted from 1148 cm−1 to 1088 cm−1, which meant the doping

Figure 3. SEM images of SiO2:xTb3+ nanofibers and nanobelts with different concentration after calcination: (a) x = 0.02; (b) x = 0.03; (c) x = 0.04; (d) x = 0.05; (e) x = 0.06.

Figure 4. XRD patterns of The SiO2:xTb3+ nanofibers and nanobelts doping different concentration after calcined at 700˚C (a) x = 0.00; (b) x = 0.02; (c) x = 0.04; (d) x = 0.06.

Figure 5. FT-IR spectra of SiO2:Tb3+ nanofibers and nanobelts (a) before calcination, (b) after calcination.
of Tb3+ has effects on the structure of SiO2 matrix. Interestingly the intensity of the -OH peak at 3430 cm−1 is decreased significantly, and the peak at 954 cm−1 is disappeared completely, which is due to the remove of water and the condensation of Si-OH. The results mentioned above are all in consistent with the TGA curve.
3.3. Component Analysis
The EDX spectra of PVP/SiO2:Tb3+ precursor fibers and SiO2:Tb3+ fibers were shown in Figure 6. The EDX characterization showed that four elements carbon (C), silicon (Si), oxygen (O) and terbium (Tb) were existed in the precursor fibers, in which the atomic percent of C was very high. After calcination at 700˚C, it could be seen only three elements, Si, O and Tb were existed in the SiO2:Tb3+ fibers, which meant that C element resulting from organic component (such as PVP) was completely removed after heat treatment and pure SiO2:Tb3+ fibers were obtained. The element-mapping images described the distribution of Si, O and Tb elements in SiO2:Tb3+ fibers by mapping the same region as the SEM

Figure 6. The EDX spectra of PVP/SiO2:Tb3+ precursor fiber (a); SiO2:Tb3+ fibers (b) and elemental mapping of SiO2:Tb3+ fibers.
image, which clearly indicated that Si, O and Tb atoms were homogeneously distributed in the SiO2:Tb3+ fibers. All the results above demonstrated that the luminescent one-dimensional Tb3+ doped SiO2 fibers were prepared successfully.
XPS analysis is conducted to get more insight into the chemical composition and electronic structure of the as-prepared SiO2:Tb3+ fibers. Figure 7 reveals the presence of Si 2p, O 1s, Tb3d, and Tb 4d peaks respectively indicating the formation of SiO2:Tb3+ fibers. The atomic ratio of Si 2P/O 1s/Tb 3d is estimated to be 38.6/61.19/0.77 and 37.6/61.43/0.88 via using 2 and 4 mol % of Tb3+. Intriguingly, the binding energy of Si 2P in SiO2:Tb3+ is blue shifted by 0.12 eV and 0.18eV upon increasing Tb concentration, similarly the biding energy of O1S is blue shifted by 0.06 eV and 0.12 eV (Figure 7). This is ascribed to the doping effect, which alter the electronic structure of Si [14] . Meanwhile, the binding energy of Tb 4d3/2 is 154.35 and 154.6 eV via using 2 and 4 mol % of Tb3+. The same results were shown in Tb 3d spectra, two new intense peaks around 1277 eV and 1242.9 eV were assigned to the Tb 3d5/2 and Tb 3d3/2, respectively (Figure 7). These slightly difference arising from change the chemical environment of Tb3+ element by doping into the SiO2 matrix [15] .
3.4. Formation Mechanism
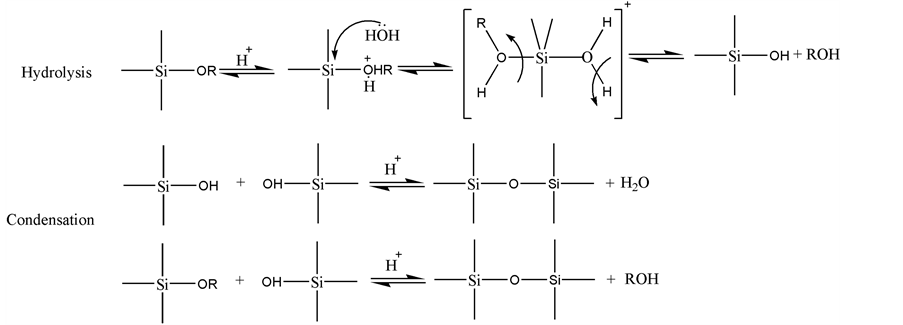
According to the characteristic analysis results mentioned above, we speculated that PVP played an important role in the formation of SiO2:Tb3+ fibers. The driving force in this self-assembly process was mainly because of the hydrogen bond interaction between SiO2 molecular and PVP template, which could be completely removed by annealing process. Based on these, we speculated the mechanism of this reaction as shown in Figure 8.
First, TEOS molecules experienced a series of hydrolysis and condensation reactions after acetic acid was added into the system and formed Si-O-Si bond network structure with a byproduct of ethanol. And Tb3+ ions were incorporated into the clearance sites through the pseudo-covalent bond (Tb3+…[SiO4]4−…Tb3+). It should be noted that TEOS could be fiercely hydrolyzed under much water, so we kept the sum of volume of water and Tb(NO3)3 solution to be constant. Acetic

Figure 7. Wide-scan XPS spectra and high-resolution Si (2p), O (1s), Tb (3d) and Tb (4d) XPS spectra of SiO2:Tb3+ fibers.

Figure 8. The formation mechanism of SiO2:Tb3+ fibers.
acid as catalyst in this system helped to promote the hydrolysis of TEOS andsilica sol was formed completely after stirring for 2 h.
Then PVP was added to assist spinning by tuning the viscoelastic properties of silica sol-gel through the hydrogen bond between the OH groups on the surface of silica sol and the carbonyl groups of the PVP [16] . After stirring for several hours, all PVP were dissolved and connected around the silica sol molecules. The final result of these crosslinking processes was the formation of larger composite gel consisted of SiO2-PVP supramolecular molecules. The linear structure of PVP also helped the supramolecular arrange orderly and form a fibrous morphology during electrospinning and it also could be regarded as soft templates, which were located at the junction sites among the silica molecules.

Finally, the PVP and other volatile (such as Dimethyl formamide, acetic acid and residual water, TEOS) were removed from the obtained composite electrospun fibers after calcination at high temperature (700˚C in this system), while the fibers morphology of the inorganic framework remains. Then pure SiO2:Tb3+ fibers were obtained.
3.5. Photoluminescence Propertie
The luminescent properties of the Tb3+ doped silica nanofibers and nanobelts were shown in Figure 9. The excitation spectra of the Tb3+ doped silica nanofibers and nanobelts after calcination at 700˚C was shown in Figure 10(a), the PL excitation spectra obtained by monitoring a green emission with various concertation of Tb3+ at 542 nm revealed a single broadband peaking at 208 - 252 nm with a maximum at about 229 nm due to 4f8 → 4f75d1 transition of Tb3+ ions [17] . The emission spectrum (λex = 229 nm) of SiO2:Tb3+ nanofibers and nanobelts exhibited several sharp peaks between 400 nm to 700 nm due to 5D4 → 7FJ(J=6,5,4,3) transition of Tb3+ (Figure 10(b)), which was assigned to the electronic transition as following: 466 nm (5D4 → 7F6), 486 nm (5D4 → 7F6), 542 nm (5D4 → 7F5), 584 nm (5D4 → 7F4) and 619 nm (5D4 → 7F3) correspondingly. Among them the intensity of 5D4 → 7F5 transition peaks at 542 nm was much higher than other emission peaks, which was the characteristic peak of Tb3+ ion [14] . From these luminescence spectra we could find that the spectra were almost same irrespective of the Tb3+ concentration, but with the increasing of the Tb3+ concentration from 2 mol % to 6 mol %, the PL intensity of the 5D4 → 7FJ (J=6,5,4,3) transition increased at first, reaching a maximum value at the concentration of 4 mol %, and then decreased with the increasing of Tb3+ content due to the concentration quenching effect [18] . This might be due to the cluster of activators at high concentration would lead to the energy transfer by cross-relaxation between Tb3+ ions in the SiO2:Tb3+ fibers. For most of rare-earth activators, the concentration quenching effect was ascribed to the non-radiative energy transfer from rare-earth ions to nearby quenching centers, which usually through the exchange interaction and multipole-multipole interaction [19] . At the same time, other non-radioactive processes such as energy transfer to hydroxyl ions and the defects in silica also could contribute to the luminescence quenching effects. It could be indicated that the optimal doping concentration of Tb3+ ions was 4 mol % of nanofibers and nanobelts. The luminescence property of the Tb3+ doped SiO2 nanofibers and nanobelts was predominantly attributed to 5D4 → 7F6 and 5D4 → 7F5, and the -

Figure 9. Photoluminescence excitation (a) and emission (b) spectra of SiO2:xTb3+ nanofibers and nanobelts prepared by electrospinning method with various concentrations.

Figure 10. The decay kinetics behaviors of SiO2:xTb3+ fibers for x = 0.02 (a); x = 0.03 (b); x = 0.04 (c); x = 0.05 (d); x = 0.06 (e).
5D4 → 7F5 peak was dominant in comparison with other peaks, which was a hypersensitive forced electric dipole transition. It was known that the f-f transition arising from a forced electric dipole was forbidden and became partially allowed when the rare-earth ion was situated at a low symmetry site [20] . Therefore, the Tb3+ concentration as well as the silica framework structure affected the efficient luminescence of Tb3+ ions [12] . From the results discussed above, it can be deduced that the optimal efficient luminescence was observed at the 4 mol % Tb3+, which means that the concentration quenching was occurred above 4 mol % Tb3+.
The decay kinetics behaviors of Tb3+ in SiO2:xTb3+ fibers were investigated. The lifetime decay curves for the 5D4 - 7F5 transition of Tb3+ (542 nm) at different concentration were measured at room temperature under excitation at 229 nm. As illustrated in Figure 10, the decay curves for the 5D4 - 7F5 transition of Tb3+ in all samples could be fitted well by a single-exponential decay [21] :
 (1)
(1)
where It is the luminescence intensities at time t, I0 is the luminescence intensities at time t = 0 and τ is the decay lifetime [22] . All the curves can be fitted by single exponential procedures, and the lifetime values of SiO2:Tb3+ are 0.92, 1.062, 1.23, 1.20 and 1.12 ms corresponding to the Tb3+ concentration of 2%, 3%, 4%, 5% and 6%, respectively. As seen in Figure 10, with the increase of the Tb3+ content, the lifetime values of SiO2:xTb3+ fibers gradually extended until up to x = 0.04, then tended to decrease. The variation tendency of decay lifetime sequence was consisted with the luminescence intensity of samples. That means both the strongest luminescence intensity and longest lifetime value were at x = 0.04 in SiO2:xTb3+ fibers. As we all know that the luminescence intensity was proportional to radiative transition probability, while the decay lifetime was the inverse of the sum of the radiative transition and the non-radiative transition probability. Therefore, the non-radiative transition probability of Tb3+ from the 5D4 energy level in the SiO2:xTb3+ fibers was small due to the decrease of surface defects [23] .
4. Conclusions
In summary, 1D SiO2:xTb3+ nanofibers and nanobelts with various Tb3+ concentrations were successfully prepared by electrospinning technique combined with sol-gel approach. The as-synthesized samples have a well-defined nanofiber and belt-like morphologies, which exhibit high PL intensities determined by the concentration of Tb3+ ions and a maximum PL intensity of 6.48154 × 10⁶ (a.u) was achieved at 4 mol % Tb3+. The presented approach may pave a new way towards the preparation of other 1D structures of lanthanide doped silica materials for various PL applications.
Acknowledgements
This work is financially supported by the National Natural Science Foundation of China (Grant No. 21171066) and the Opening Research Funds Projects of the State Key Laboratory of Inorganic Synthesis and Preparative Chemistry, College of Chemistry, Jilin University (2016-01). Murad M.A. Abualrejal greatly appreciates Chinese government scholarship 2013.
Cite this paper
Abualrejal, M.M.A., Zou, H.F., Chen, J., Song, Y.H. and Sheng, Y. (2017) Electrospinning Synthesis and Photoluminescence Properties of One-Dimensional SiO2:Tb3+ Nanofibers and Nanobelts. Advances in Nanoparticles, 6, 33-47. https://doi.org/10.4236/anp.2017.62004
References
- 1. Armelao, A.L., Dell’Amico, D.B., Bellucci, L., Bottaro, G., Labella, L., Marchetti, F. and Samaritani, S. (2016) Smart Grafting of Lanthanides onto Silica via N,N-Dialkylcarbamato Complexes. Inorganic Chemistry, 55, 939-947.
https://doi.org/10.1021/acs.inorgchem.5b02535 - 2. Binnemans, B.K. (2009) Lanthanide-Based Luminescent Hybrid Materials. Chemical Reviews, 109, 4283-4374.
https://doi.org/10.1021/cr8003983 - 3. Ikeda, H., Murata, T. and Fujino, S. (2014) Preparation and Photoluminescence of Monolithic Silica Glass Doped with Tb3+ Ions Using SiO2-PVA Nanocomposite. Optical Materials, 36, 1119-1122.
- 4. Yang, R., Qin, G., Zhao, D., Zheng, K. and Qin, W. (2012) Synthesis and Upconversion Properties of Ln3+ Doped YOF Nanofibers. Journal of Fluorine Chemistry, 140, 38-42.
- 5. Cui, Q.Z., Dong, X.T., Wang, J.X. and Li, M. (2008) Direct Fabrication of Cerium Oxide Hollow Nanofibers by Electrospinning. Journal of Rare Earths, 26, 664-669.
- 6. Dong, G.P., Xiao, X.D., Chi, Y.Z., Qian, B., Liu, X.F., Ma, Z.J., Ye, S., Wu, E., Zeng, H.P., Chen, D. and Qiu, J.R. (2009) Polarized Luminescence Properties of TiO2:Sm3+ Microfibers and Microbelts Prepared by Electrospinning. Journal of Physical Chemistry C, 113, 9595-9600.
https://doi.org/10.1021/jp900819w - 7. Wang, A.L., Liu, X., Hou, Z., Li, C., Yang, P., Cheng, Z., Lian, H. and Lin, J. (2008) Electrospinning Synthesis and Luminescence Properties of One-Dimensional Zn2SiO4:Mn2+ Microfibers and Microbelts. The Journal of Physical Chemistry C, 112, 18882-18888.
https://doi.org/10.1021/jp806392a - 8. Shin, M.K., Kim, S.-K., Lee, H., Kim, S.I. and Kim, S.J. (2008) The Fabrication of Polymeric Nanochannels by Electrospinning. Nanotechnology, 19, Article ID: 195304.
- 9. Li, A.D. and Xia, Y. (2004) Direct Fabrication of Composite and Ceramic Hollow Nanofibers by Electrospinning. Nano Letters, 4, 933-938.
- 10. Ahmed, B.F.E., Lalia, B.S. and Hashaikeh, R. (2015) A Review on Electrospinning for Membrane Fabrication: Challenges and Applications. Desalination, 356, 15-30.
- 11. Zulkifli, N.S.C., Rahman, I.A., Mohamad, D. and Husein, A. (2013) A Green Sol-Gel Route for the Synthesis of Structurally Controlled Silica Particles from Rice Husk for Dental Composite Filler. Ceramics International, 39, 4559-4567.
- 12. Tagaya, M., Ikoma, T., Yoshioka, T., Motozuka, S., Xu, Z. and Minami, F. and Tanaka, J. (2011) Synthesis and Luminescence Properties of Eu (III)-Doped Nanoporous Silica Spheres. Journal of Colloid and Interface Science, 363, 456-464.
- 13. Ren, L., Simmons, T.J., Lu, F., Rahmi, O. and Kotha, S.P. (2014) Template Free and Large-Scale Fabrication of Silica Nanotubes with Centrifugal Jet Spinning. Chemical Engineering Journal, 254, 39-45.
- 14. Kim, D., Jin, Y.-H., Jeon, K.-W., Kim, S., Kim, S.-J., Han, O. H., Seo, D.-K. and Park, J.-C. (2015) Blue-Silica by Eu2+-Activator Occupied in Interstitial Sites. RSC Advances, 5, 74790-74801.
https://doi.org/10.1039/C5RA15641F - 15. Yan, M., Zou, H., Zhao, H., Song, Y., Zheng, K., Sheng, Y., Wang, G. and Huo, Q. (2014) Fabrication and Photoluminescence Properties of TiO2:Eu3+ Microspheres with Tunable Structure from Solid to Core-Shell. CrystEngComm, 16, 9216-9223.
https://doi.org/10.1039/C4CE01048E - 16. Pirzada, T., Arvidson, S.A., Saquing, C.D., Shah, S.S. and Khan, S.A. (2014) Hybrid Carbon Silica Nanofibers through Sol-Gel Electrospinning. Langmuir, 30, 15504-15513.
https://doi.org/10.1021/la503290n - 17. Cheng, Q., Dong, Y., Kang, M. and Zhang, P. (2014) Preparation and Tunable Luminescence of CaCO3: Eu3+, Tb3+ Phosphors. Journal of Luminescence, 156, 91-96.
- 18. Koao, L., Swart, H., Obed, R. and Dejene, F. (2011) Synthesis and Characterization of Ce3+ Doped Silica (SiO2) Nanoparticles. Journal of Luminescence, 131, 1249-1254.
- 19. Du, P., Song, L., Xiong, J., Cao, H., Xi, Z., Guo, S., Wang, N. and Chen, J. (2012) Electrospinning Fabrication and Luminescent Properties of SrMoO4:Sm3+ Nanofibers. Journal of Alloys and Compounds, 540, 179-183.
- 20. Tang, Z., Zhou, L., Yang, L. and Wang, F. (2010) Preparation and Luminescence Study of Eu(III) Titanate Nanotubes and Nanowires Using Carbon Nanotubes as Removable Templates. Journal of Luminescence, 130, 45-51.
- 21. Li, D., Yu, W., Dong, X., Wang, J. and Liu, G. (2013) Synthesis and Luminescence Properties of YF3:Eu3+ Hollow Nanofibers via the Combination of Electrospinning with Fluorination Technique. Journal of Fluorine Chemistry, 145, 70-76.
- 22. Zhu, Z., Liu, D., Liu, H., Li, G., Du, J. and He, Z. (2012) Fabrication and Luminescence Properties of Al2O3:Tb3+ Microspheres via a Microwave Solvothermal Route. Journal of Luminescence, 132, 261-265.
- 23. Wang, L.-L., Wang, Q.-L., Xu, X.-Y., Li, J.-Z., Gao, L.-B., Kang, W.-K., Shi, J.-S. and Wang, J. (2013) Energy Transfer from Bi3+ to Eu3+ Triggers Exceptional Long-Wavelength Excitation Band in ZnWO4:Bi3+, Eu3+ Phosphors. Journal of Materials Chemistry C, 1, 8033-8040.
https://doi.org/10.1039/c3tc31160k