American Journal of Plant Sciences
Vol.4 No.3A(2013), Article ID:29454,11 pages DOI:10.4236/ajps.2013.43A086
Metapontum Forest Reserve: Salt Stress Responses in Pinus halepensis
![]()
1Department of Biological and Environmental Sciences, University of Sannio, Benevento, Italy; 2Department of Bioscience and Territory, University of Molise, Campobasso, Italy; 3Institute of Methodologies for Environmental Analysis (IMAA)-CNR, Tito Scalo, Italy.
Email: antonio.satriani@imaa.cnr.it
Received January 8th, 2013; revised February 11th, 2013; accepted February 28th, 2013
Keywords: Aleppo Pine; Salinity Soil; 2D Electrophoresis; Stress Response
ABSTRACT
Metapontum Forest Reserve is an artificial formation located between mouths of Bradano and Basento river, it is composed prevalently of Aleppo pine (Pinus halepensis). In recent years, the Metapontum coast is characterized by a strong erosive process which has really removed the dune behind the beach moving in the inland and causing the decline of the historical pinewood. This negative effect on plant was induced by an increase in soil salinity, which is one of the major abiotic stresses. A clear understanding of the molecular mechanisms involved in plants response to salt stress is fundamentally important for plant biology. The salinity soil causes broad variety of physiological and biochemical processes, as oxidative damage, also has a negative effect on energy metabolism, which unavoidably resulted in a decreased ATP production through photophosphorylation and, thus, affected the Calvin cycle in photosynthesis. A proteomic approach was utilized to identify key protein which result to be directly responsive to salt stress. Total proteins were extracted from the leaves by a combination of TCA—acetone and phenol, and separated by two-dimensional gel electrophoresis at pH 5 - 8. Spots were stained with Coomassie Brilliant Blue and analyzed with the software PDQuest 8.0 (Bio-Rad) to identify differentially expressed polypeptides. Preliminary analysis revealed around 29 differentially expressed proteins, and they were sequenced by MALDI TOF and LC-MS/MS. Sequenced spots were classified in different functional classes.
1. Introduction
Soil salinity is one of the most widespread problems that limits the productivity and geographical distribution of plants [1]. Natural events and human practices, such as irrigation, can cause salts to accumulate into environment [2]. Excess NaCl in the soil solution interferes with mineral nutrition and water uptake, indeed, land salinity inhibits plant access to water by increasing the osmotic strength of the soil solution, as the soil dries, the land solution becomes progressively more concentrated limiting the availability of water to the plant. Moreover it leads to accumulation of toxic ions in plants, and it represents a serious risk not only for agricultural crops but for all plant species of the whole earth.
To reduce these detrimental effects, the plants have to readapt their gene expression and subsequently the protein profile into whole plant. Several strategies were used to get well again cellular homeostasis association whit processes of repair and detoxification [3]. Usually salinity involves three different responses: dehydration of the cells as a result of the low water potential, nutritional imbalance caused by interference by saline ions in the uptake and translocation of essential nutrients, and toxicity as a result of accumulation of large amounts of Na+ and Cl− ions in the cytoplasm [4,5].
A clear understanding of the molecular mechanisms involved in response to salt stress is of fundamental importance to plant biology. Knowledge about these mechanisms is also crucial for thwart this problem and to improve tolerance and/or adaptation to stress in plant life. Molecular mechanisms underlying in cells exposed to environmental perturbation can be unveiled through proteins analyses. Proteomic approach has become a powerful tool to study plant responses to stress. A global protein expression profile can be investigated and compared using a 2D gel based protein separation method coupled with protein identification by Mass Spectrometer (MS).
In this study, we have focused our attention on proteomic profile of Aleppo pine leaves (needles), in a critical coastal area of Southern Italy (Ionian Coast, Basilicata Region). This analysis provided a view of the proteome level changes elicited by NaCl exposure for a better understanding of the mechanisms that govern plant responses to NaCl induced stress.
2. Sampling Area
Metapontum Forest Reserve (40˚22'N, 16˚51'E), is located between mouths of Bradano and Basento river, is an artificial formation, protecting the vegetable cultivations from salt sea wind (Figure 1). The forest is composed of Aleppo pine trees (Pinus halepensis) and domestic pine trees (Pinus pinea) prevalently. Secondary species are acacia saligna (Acacia cianophylla) and eucalyptus (Eucalyptus globulus, E. camaldulensis), besides to other species that are typical of Mediterranean scrub as Pistacia lentiscus, Juniperus macrocarpa and Juncos acutus, often mixed with the type of vegetation which prefers sandy soil (called “psammofila”). Marine erosion has really removed the dune behind the beach moving in the inland and causing the decline of the historical pinewood. Dunes and its vegetation are a natural defences against erosion by wind and sea and the variation of the line of the seashore is in close connection with the development of coastal dunes and their preservation [6].
Moreover, reduction of the coastal dune system in the study area, facilitates the entry of salt water; dunes in fact, for their elevation and good infiltration capacity, give a sufficient freshwater recharge and a pressure above sea level, allowing hydrostatic control of saline intrusion [7].
On the basis of meteorological data, the climate of the sampling site is semiarid with hot and dry summers [8].
To evaluate the level of salinization in this area, resistivity measurements were conducted as tomographies to determine variations with depth in soil resistivity. Resistivity values corresponding to layers saturated by seawater were found with different magnitude (brackishto-saline); in particular, along the area the vertical diffusion interests the layer active for plant roots limiting their development.
Needle leaves samples were obtained from wild Aleppo pine trees in this forest.
3. Evaluation Soil Salinity
The identification of seawater intrusion was done by various methods including geochemical and geophysical techniques. Geophysical resistivity methods are advantageous as they are indirect methods, rapid and relatively inexpensive [9-11].
To evaluate the soil salinity determined by seawater intrusion phenomenon, non invasive geoelectrical investigation was carried out, this survey allowed to assess the extent and depth of the saltwater intrusion process.
The electrical resistivity tomography (ERT) or electrical imaging is a geoelectrical method widely applied to obtain 2D and 3D high-resolution images of the resistivity subsurface patterns in areas of complex geology [12,13]. Electrical Resistivity Tomography (ERT) were obtained using the georesistivity meter Syscal R2 (Iris Instruments) connected to a 48-channel multiplexing unit, with electrodes spacing on the surface of 10.00 meters.
The electrical tomography was orthogonal to the coastline and in direction of trees sample utilized for detection and identification of salinity stress-responsive proteins (Figure 2).
Electrical resistivity values are related to geological parameters of the subsurface and, in particular, resistivity values are controlled by the types of rocks and fluid. Then, the high-resolution electrical images are a powerful tool to identify conductive zones for the saltwater intrusion phenomena.
Electrical imaging, in Figure 3, shows a significant trend of resistivity, in fact, the resistivity section is characterized by two zones with different resistivity values: the first zone, towards the inland of the Forest Reserve and throughout the thickness of soil explored, shows

Figure 1. Metapontum forest reserve location. The sampling area is mainly characterized by a narrow shore (10 - 30 m) of fine sandy formations and by a pine forest planted in the first decade of 50’s in order to preserve the coast and the inland cultivated areas.
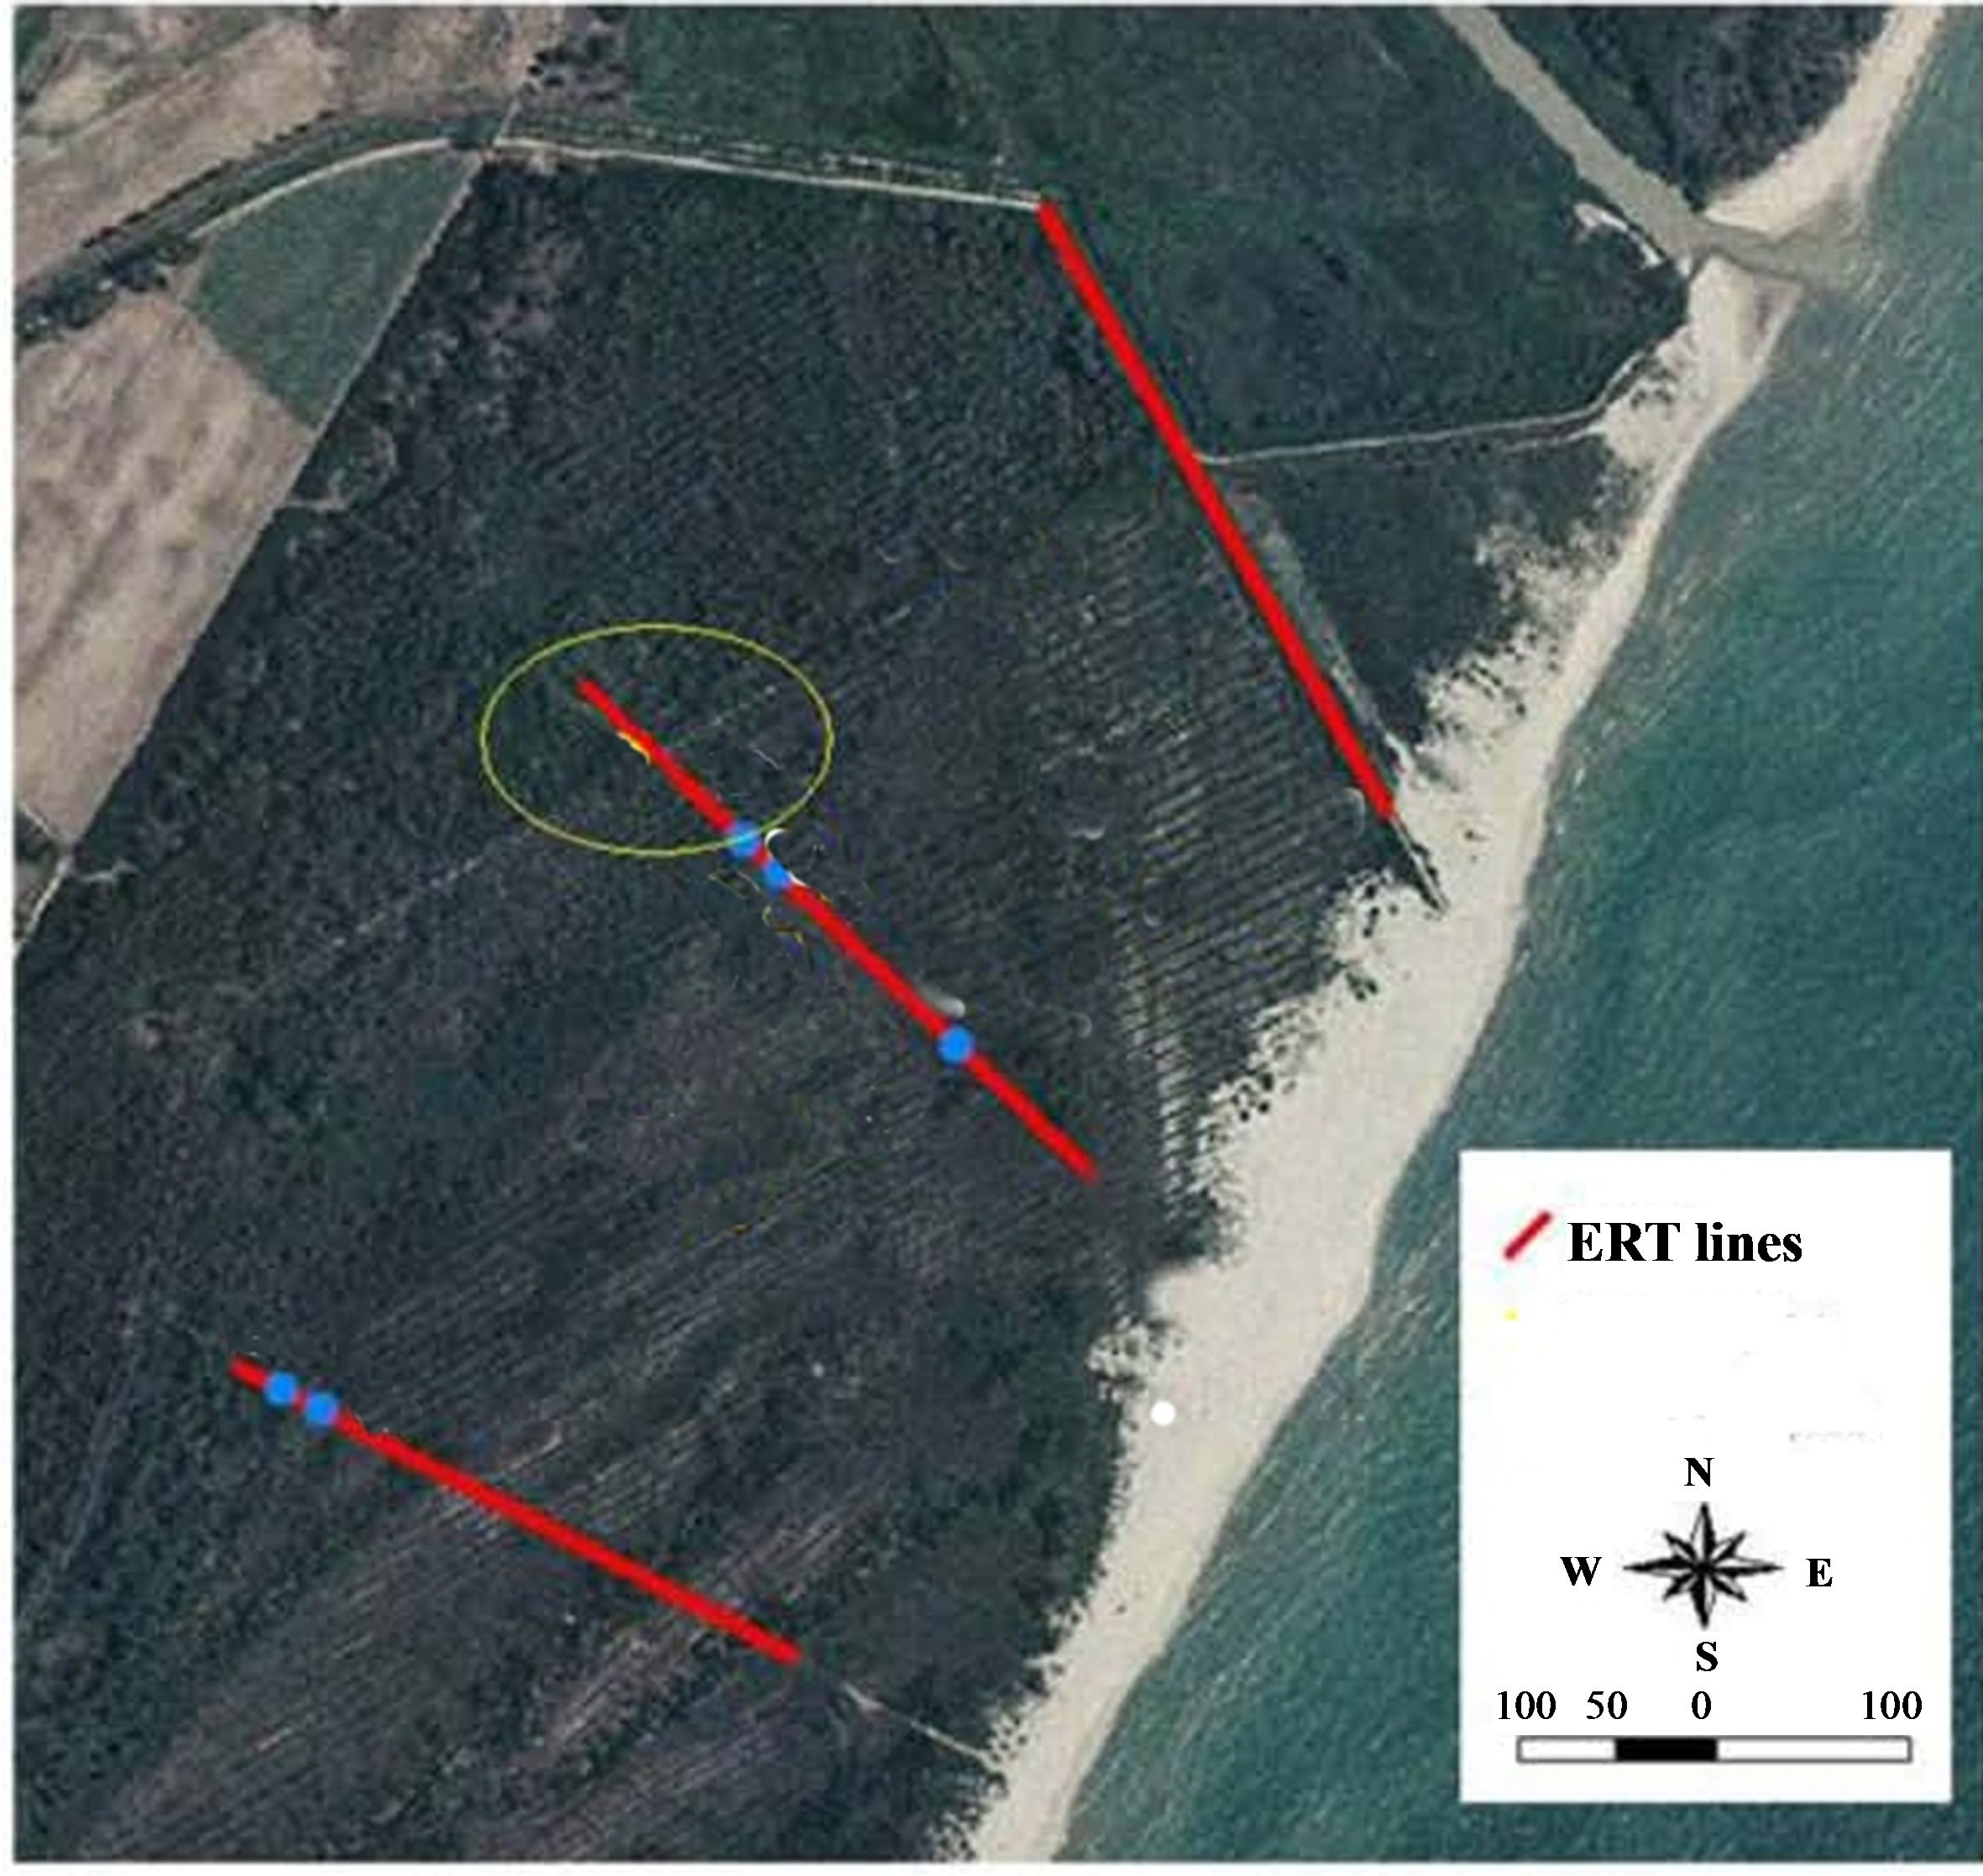
Figure 2. Location map geoelectrical surveys. In ellipse needle leaves sampling.
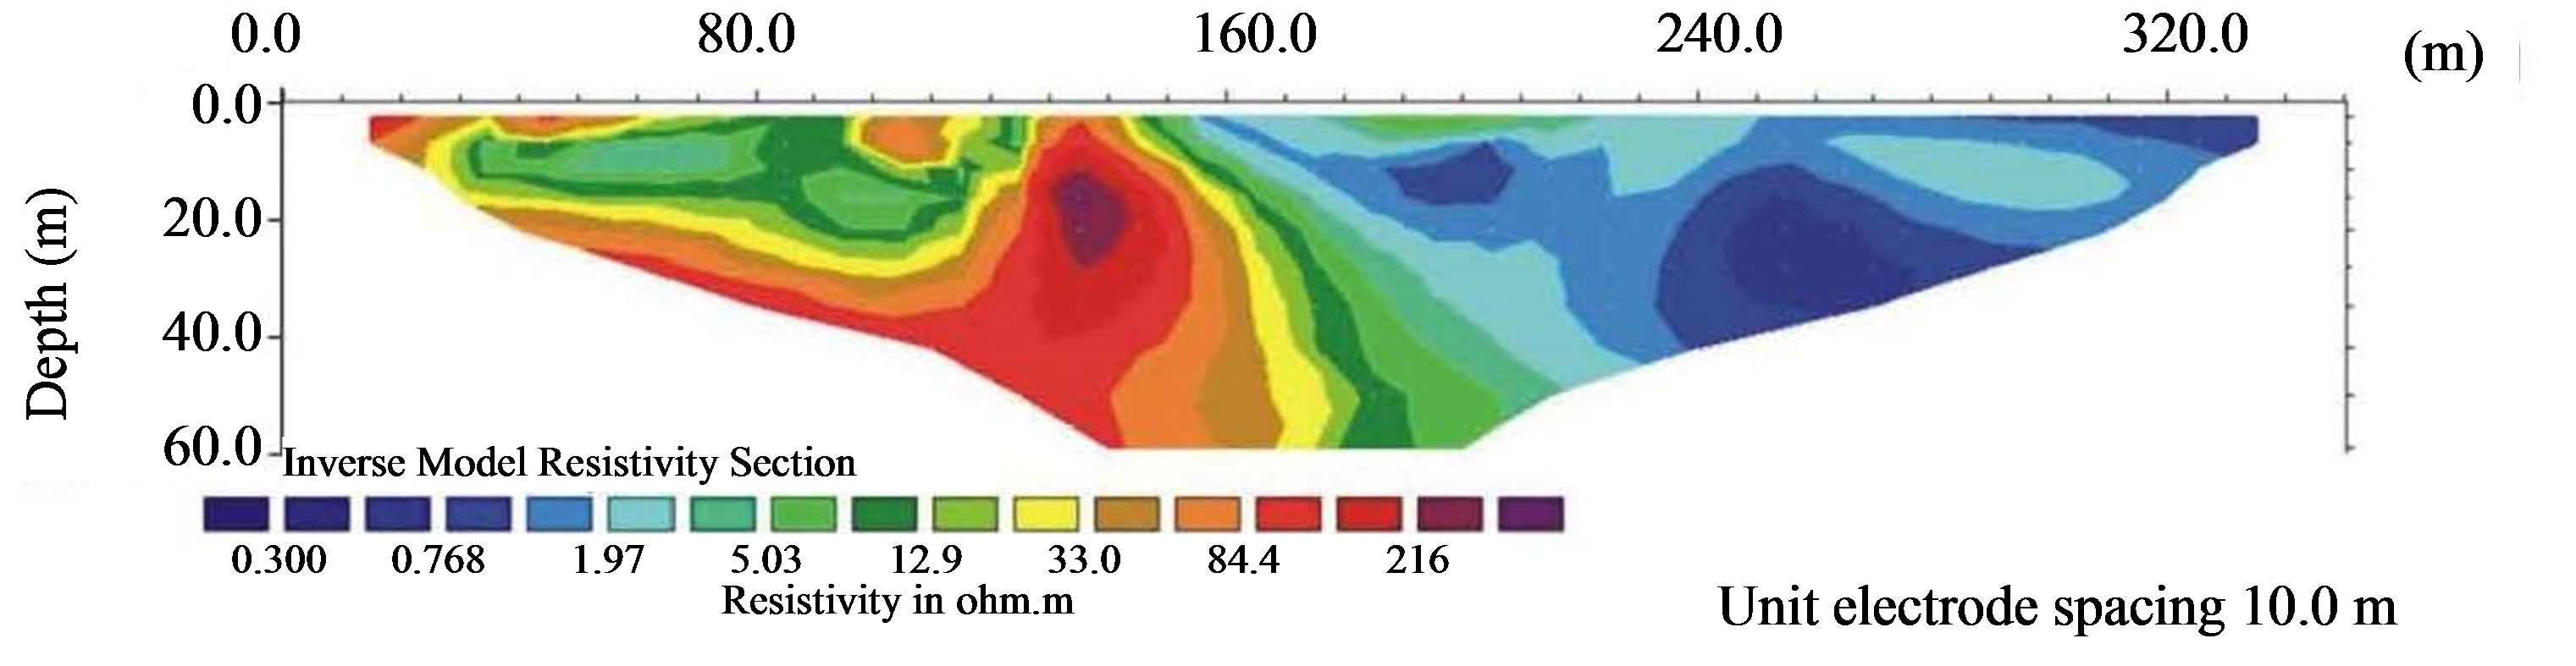
Figure 3. Electrical resistivity tomography obtained in direction of trees sample utilized for detection and identification of salinity stress-responsive proteins.
moderate to high resistivity values 10 - 220 Ω·m, while the second zone, towards the sea, shows very low resistivity values.
4. Materials and Methods
4.1. Sampling and Protein Extraction
Needle leaves were sampled by nine Aleppo pine trees in Metapontum Forest Reserve.
Particularly, three areas were localizated, each with different degree of salinity, in fact the salinity values increase from inland towards the sea, and in each area by three trees were collected needle leaves samples, obtaining nine samples per area.
Samples transported to the laboratory in liquid nitrogen were stored at −20 degrees Celsius until protein extraction.
Needles (2 g fresh weight per sample) were ground to a fine powder with liquid nitrogen using a mortar. The powder was suspended in 8 mL of 10% (w/v) trichloroacetic acid (TCA)/acetone solution containing 0.07% (w/v) polyvinylpyrrolidone (PVP). The mixture was filtered through Miracloth (pore size of 25 μm) to eliminate cell debris. Proteins were allowed to precipitate at −20˚C for 1 h; and the precipitate was recovered after centrifugation at 35 000 rpm for 30 min. The pellet was cleaned with 8 mL of cold (−20˚C) acetone, keeping the extract at −20˚C for 30 min, and then centrifuged at 20,000 rpm. The cleaning process was repeated once.
4.2. Two-Dimensional Electrophoresis (2DE)
Protein pellets were washed with ice-cold methanol (once) and ice-cold 80% acetone (3 times), dried under reduced pressure and dissolved in IEF buffer (9 M urea, 4% w/v CHAPS, 0.5% v/v Triton X-100, 20 mM DTT, 1% w/v carrier ampholytes pH 3 - 10 (Bio-Rad, Hercules, CA, USA). Protein concentration was quantified using the Bio-Rad protein assay, using BSA as a standard. IPG strips (17 cm pH 5 - 8, Bio-Rad ReadyStrip, Bio-Rad) were rehydrated overnight with 300 μL of IEF buffer containing 600 μg of total proteins. Proteins were focused using a Protean IEF Cell (Bio-Rad) at 20˚C, applying the following voltages: 250 V (90 min), 500 V (90 min), 1000 V (180 min) and 8000 V for a total of 54 KV·h. After focusing, the proteins were reduced by incubating the IPG strips with 1% w/v DTT for 15 min and alkylated with 2.5% w/v iodoacetamide in 10 mL of equilibration buffer (50 mM Tris-HCl pH 8.8, 6 M urea, 30% w/v glycerol, 2% w/v SDS and a dash of bromophenol blue) for 15 min. Electrophoresis in the second dimension was carried out on 12% polyacrylamide gels (18 × 24 cm × 1 mm) with the Protean apparatus (Bio-Rad), using electrophoresis buffer (25 mM Tris pH 8.3, 1.92 M glycine and 1% w/v SDS), with 70 V applied for 20 h, until the dye front reached the bottom of the gel. Samples were run in triplicate. Protein spots were annotated only if detectable in all gels.
4.3. Image Acquisition and Analysis
Gel image analysis was performed using the PDQuest software (Bio-Rad). Spot detection and matching between gels were performed automatically, followed by manual verification. Protein spots were annotated only if detectable in all gels. After normalization of the spot densities against the whole-gel densities, the percentage volume of each spot was averaged for six different (three replicates of two biological samples) gels and statistical analysis (by Student’s t test) was performed to find out significant protein fold changes between control and treated plants. A two-fold change in normalized spot densities was considered indicative of a differentially synthesized protein.
4.4. Protein Digestion of Proteins and LC-MS/MS Analysis
Stained protein spots were manually excised from the gel and destained according Valledor et al. (2007) with two washes at 37˚C for 30 min with 100 μL of 100 mM ammonium bicarbonate/50% (v/v) acetonitrile (ACN). Gel spots were washed twice in 20 μL of 25 mM ammonium bicarbonate and then dehydrated with 20 μL of 25 mM ammonium bicarbonate/50% (v/v) ACN followed by a wash with 20 μL of ACN. Gel pieces were fully dried in a SpeedVac. For digestion, the gel pieces were rehydrated in 20 μL of 25 mM ammonium bicarbonate solution containing 12.5 ng/μL trypsin (sequencing grade, Promega) and incubated on ice for 45 min. The supernatant was discarded, 10 μL of 25 mM ammonium bicarbonate was added to the gel, and then, this was heated for 2 × 5 min in a microwave oven at 200 W. The peptides were extracted in 0.5 μL of 10% trifluoroacetic acid (TFA), with frequent vortexing for 15 min. Samples were evaporated to dryness and stored at 4˚C until MS analysis.
Samples were reconstituted into 20 μL of loading buffer (2% ACN (v/v) vs 0.5% (v/v) formic acid) and analyzed by liquid chromatography/tandem mass spectrometry. Digest peptides were concentrated and desalted on a C18 trap column (PepMap C18, Dionex) using a Tempo 1D nanoLC system (Applied Biosystems). Peptide separation was achieved on a reversed phase C18 column (PepMap C18, 75 μm i.d., 15 cm) using an 18 min linear gradient of 5% - 35% (v/v) ACN versus 0.1% (v/v) aqueous formic acid. The eluent was analyzed on hybrid triple quadrupole/linear ion trap mass spectrometer (4000 Q TRAP LC/MS/MS System, Applied Biosystems) equipped with a heated Desolvation Chamber Interface set to 150˚C and operated under Analyst 1.4.1 software. Up to five peptide precursor ions detected by a linear ion trap MS scan were first subjected to a high resolution MS scan to determine charge state and molecular weight. Suitable precursors were then fragmented by Enhanced Product Ion Scans (EPI) [14] In this scan mode, precursors are selected in Q1, fragmented by collision with nitrogen in the Q2 collision cell, and mass analyzed in the Q3 linear ion trap. The collision energy was dynamically adjusted according to the charge state and MW of the precursors. The resulting spectra have been shown to be suitable for de novo sequence analysis [15]. The average cycle time for this experiment was 3.5 s.
4.5. Identification of Proteins from LC/MS/MS Data
Because of the poor protein and DNA sequence database coverage for Pinus, proteins were identified from the LC/MS/MS data using a novel approach that employs the recently introduced Paragon algorithm present in the commercial ProteinPilot software (Applied Biosystems) [16]. For each spot, the list of detected proteins was then consolidated using the ProGroup algorithm incorporated in the ProteinPilot software. A protein hit is only reported if it has at least one unique, high scoring peptide sequence assigned to it that is not implemented in other protein hits. This approach efficiently consolidates the large number of similar protein entries from different species expected in the given scenario, without obscuring valuable information about the existence of potential homologues.
5. Results
Proteomic approach has become a powerful tool to study plant responses to stress and to identify candidate proteins whose abundance changed upon stimulus exerted by salinity of plant basal defense.
2-DE has been criticized for its low reproducibility when a direct comparison of different gels is performed. These kinds of comparisons should only be performed after the definition of analytical and biological variations, which support gel-to-gel spot comparison statistics. The origin of the analytical variation is related both to experiment procedures (protein extraction, IEF, SDSPAGE, gel staining-destaining) and hardware/software accuracy (image acquisition and analysis), contributing to the variation in gel patterns and spot quantification. Biological variation is caused, among other factors, by environments and microenvironments. For the determination of the analytical variance, 3 independent protein extracts from homogeneous needles of the same branch of one tree were used, while for the biological variations, 3 different protein extracts, each one from a different tree, were used.
Proteins were extracted from the needle leaves and separated by 2D-PAGE electrophoresis within the pH range 5 - 8 and mass range 10 - 250 kDa. Representative gels are shown in Figure 4. To determine quantitative changes in relative spots densities for needle leavestreated compared to control, colloidal Coomassie-stained gels were subjected to comparative software-assisted image analysis.
Average proteomic maps showed 352 spots in control sample, 502 spots in “middle sea” sample and 416 spots in “near sea” sample, with a degree of similarity for the different treatments of 75% (“middle sea”/control) and 77% (“near sea”/control). Statistical evaluation (p < 0.05) of relative spot densities allowed to detect spots differenttially expressed in challenged needle leaves with at least a two-fold increase or decrease, as compared to control needle leaves. In total, 29 differential spots were detected between treated and control plants.
These spots were excised from gels, proteolyzed and subjected to LC/MS/MS analysis for protein identification. Identified protein, together with their quantitative variations, are reported in Table 1. To better comprehend the changes of differentially expressed proteins under different treatments, the mean value of optical density for

Figure 4. Proteomic maps of proteins extracted from needle leaves of Pine d’Aleppo. Master gel stained with colloidal Coomassie G250 to detect total proteins, Panels A to B representative Coomassie G250-stained gels of proteins from control, middle sea and near-sea.
Table 1. List of identifiaed proteins with spot number, protein name, organism, accession number, MW and pI theorical and experimental, protein score, sequence coverage and Fold change of two sample middle-sea and near-sea.

each differentially spots are shown in Figure 4.
We found that almost all of the identified proteins increase their expression levels as we move closer to the sea, in fact we have a steady enhance, in both samples, of proteins involved in the strees (spot 1, 2, 4, 5) that are all Heat shook protein, only spot 4 have a different trend, becouse it decrease in the middle and increase near the sea. Also the dehydroascorbate reductase (DHAR) (spot 21) is up-regulation, it is responsible to regenerate ascorbic acid (Asc) from an oxidized state regulating also his cellular redox state, this is significant as it is a major antioxidant in plants that detoxifies reactive oxygen species (ROS) and maintains photosynthetic function. We detected also other protein of oxidative stress whose levels enhance, dehydroascorbate reductase, thioredoxin peroxidise, glutathione peroxidase 1, Cu-Zn superoxide dismutase, peroxiredoxin, fragment (spot 21, 22, 23, 24, 25), that are involved on cell responsiveness and tolerance to environmental ROS. As for proteins involved in the metabolism/energy we have a down regulation of glyceraldehyde-3-phosphate dehydrogenase, cytosolic, fructose bisphosphate aldolase and ribulosio 1,5-biphosphate carboxylase, large subunit fragment (spot 12, 14, 15 and 20) into two treatments, whereas alcol dehydrogenase (spot 10) involved in the energy, malate dehydrogenase, mitochondrial precursor (spot 27) involved in the tricarboxylic acid cycle and glutamate-1 semialdehyde 2,1 aminomutase, chloroplastic precursor (spot 19) involved in the synthesis of chlorophylls increase their levels of expression.
Putative oxireductase, zinc-binding (spot 9) involved in cold stress with cysteine protease inhibitor 1, precursor (spot 18) result up-expresses in our study. Inorganic pyrophosphatase (spot 26) is another protein whose levels increase during salt stress. It is an enzyme that catalyzes the conversion of one molecule of pyrophosphate to two phosphate ions producing a high exergonic reaction available for cellular reactions. The functionality of this enzyme plays a critical role in lipid metabolism (includeing lipid synthesis and degradation), calcium absorption and DNA synthesis, as well as other biochemical transformations. Notable is the up-regulation of protein 3-beta hydroxisteroid dehydrogenase /isomerase, putative (spot 28) because it is involved in acid abscisic response and we know it is the hormone involved in different kinds of abiotic stress. In conclusion we have the Chalcone synthases (CHS) (spot 29) who is associate in the synthesis of Flavonoids, a class of organic compounds that perform a several function in the cell, including a roles in stress protection [17].
6. Discussion
The response of plants to an excess of salt is quite complex and implies several changes in morphology, physiology and metabolism, depending on many factors including the intensity of the stress, the natural capacity of plants to cope with stress situations, and the response or acclimation by induction of defence systems and metabolites which diminish dangerous or even deleterious effects [18]. The ability of plants to modify their behaveiour appropriately in response to these environmental constraints is a major factor in their adaptation to these specific conditions. These responses include physiological as well as biochemical and molecular changes. The development of plants with enhanced stress tolerances is crucial not only for food security but also for ecosystem conservation in the future. The aim of our study is to examine the effect of salt stress on the behavior of pine at the proteome level in order to identify proteins involved in the response of pine to salt stress.
Proteomic analysis of this study revealed that the proteins associated with defense was differentially expressed upon salt stress, in this group we found the Heat Shock Protein 70 kDa (spots 1, 2, 3, 4) and the chaperonine 60 kDa (spots 6,7).
Heat shock proteins (HSPs) are a group of variety and ubiquitous proteins universally found in organisms involved in several cellular processes including protein folding, protein transport across membranes, modulation of protein activity, regulation of protein degradation and prevention of irreversible protein aggregation [19]. Some HSPs are also induced upon exposure to abiotic stresses, such as cold, salinity, drought, oxidation and heavy metals, which suggests that HSPs are likely to be involved in a broad range of abiotic stress tolerances [20] HSPs primarily function as molecular chaperones under stress conditions by preventing protein denaturation and/or correcting folding of partially unfolded proteins [19]. The 70-kDa Hsp are located in the outer chloroplast membrane and stroma [21] probably there are involved in the process of stress acclimation. In our study, we observed that salt stress induce increase of expression of 70-kDa Hsp, above all in the stress.
We detected that the chaperonin 60 kDa (Cnp60) induces a significant increase of his expression in stressed sample compared with control. These proteins are key components contributing to cellular homeostasis in cells under both optimal and adverse growth conditions [22]. Chaperones after exposure to salt stress could play a pivotal role in preventing the aggregation of denatured proteins and facilitating refolding, and decreasing the intracellular level of ROS, thereby protecting PSII function during stress [23-25]. Heat-shock proteins have a wide range of cellular functions, including acting as molecular chaperones, and in literature has been shown that Cnp60 and HSP70 could associates with complex rieske ironsulfur protein in the chloroplast stroma, which contributes to the photoprotection and repair of photosystem II during stress [26,27].
As above, NaCl elicits ionic toxicity producing reactive oxygen species (ROSs) [28,29]. In fact Herna’ndez have been demonstrated in pea (Pisum sativum) plants, that the metabolism of chloroplasts and mitochondria under NaCl stress favoured the formation of O2 and H2O2 in two pea cultivars differing in NaCl sensitivity [30-32]. The excess production of ROSs affect cellular structures and metabolism, cause membrane damage that eventually leads to cell death [33] even if they can also have positive implications due to the possible signalling nature of some of the species produced [34-36]. Therefore, plant cells need different mechanisms, which enable the detoxification of excess ROS and keep the balance of the formation and removal of ROS. For protection against ROS, plants contain antioxidant enzymes such as superoxide dismutase (SOD), catalase (CAT) or ascorbate peroxidase (APX), as well as a wide array of non-enzymatic antioxidants [37,38].
The increased activities of glutathione peroxidase (spot 23), peroxiredoxin (Prx) (spot 25), thioredoxin peroxidase (Trx) (spot 22), dehydroascorbate reductase (spot 21) and Cu-Zn-superoxide dismutase (spot 24) detected in this study are presumed to limit cellular damage and enhance the plant’s antioxidative capacity to defend stress. The possible role of Trx and Prx in the response of plants to abiotic stress including salinity and their involvement in plant tolerance to stress has been less studied [39-41], although a role in redox sensing and signal transduction has been proposed [42]. In addition, a thioredoxin/peroxiredoxin (Trx/Prx) system which includes an NADPH-dependent thioredoxin reductase (NTR) and glutaredoxin has been described in plant mitochondria, similar to that in chloroplasts [43-45]. This system is involved in redox homeostasis and may also act as an antioxidant by eliminating hydroperoxides, including H2O2 [39,46].
The salinity induced an oxygen-limiting conditions, this affects on metabolism. In fact, in this condition pyruvate can either be converted into ethanol by pyruvate decarboxylase (PDC) and alcohol dehydrogenase (ADH) or to lactate by lactate dehydrogenase.
We observed that salt stress induce an increase expression of alcohol dehydrogenase (spot 10). The role of alcohol dehydrogenase in tolerance of crops to flooding stress has already been identified [47]. Under stress, plant respiration shifts from aerobic to anaerobic pathways (alcoholic fermentation) for generating ATP for growth and maintenance processes. Alcohol dehydrogenase was found up-regulated, in this study, indicating the main role of this enzyme produce ATP and consume glycolytic products under salt stress.
The decline in growth is a general phenomenon in many plants when subjected to salinity stress and is often associated with a decrease in their photosynthetic capacity. The decrease in photosynthesis induced by salt stress is mainly associated with the partial stomatal closure and/or the non-stomatal limitation, which is involved enzymatic processes of CO2 assimilation [48].
We have an alterated expression of another protein involved in energy/carbon metabolism, as glyceraldehyde-3-phosphate dehydrogenase (spot 12), fructosebisphospate aldolase (spots 14, 15) and rubisco large subunit (spot 20) that are down-regulated suggesting that they play a role in salt stress. Glyceraldehyde-3-phosphate dehydrogenase has a main role in tolerance to salt stress and there are several reports related to its relationship to improved salt tolerance in plants [49,50]. Under salt stress, which inhibits photosynthesis, the substrates for glycolysis decrease and there is a resulting decrease in the rate of the glycolytic reactions to conserve energy and limit further generation of ROS [51,52].
By contrast to other proteins involved in energy metabolism, our results showed that malate dehydrogenase mithocondrial (spot 27) is up-regulated, in fact was reported to be responsive to salinity stress in root and suspension cells of Arabidopsis [53,54] and pea roots as well [55]. In addition, malate dehydrogenase was upregulated by long-term salinity stress in Thellungiella halophila leaves [56].
In the present study we have found a negative modulation of auxin-induced protein (spot 13). This protein belong to the aldo/keto reductase 2 family and is involved in auxin signaling pathway. His down-regulation is probabily signal of low concentration of this hormones. Although we know that auxin’s effects on abscission and senescence was first reported >50 years ago [57], the involvement of this hormone in senescence is much less understood than that of ABA, ethylene, or CKs, and it is difficult to conclude that it antagonizes senescence [58]. Therefore, although a low IAA content could stimulate senescence on the basis that this compound has been generally seen as a senescence-retarding factor [59] decreases the expression of the SAG12 (senescence promoter) [60]; however it seems unlikely to be a primary factor in the onset of salt-induced senescence, but probably could interactions with other hormones, such as ethylene, and metabolic fluxes [59].
In conclusion taking into account all the result collected in this study the effects of salt stress can be summarized as follows: salinity stress decreased water availability; increased amount of ROS and electrolyte suggest that salinity causes cellular damage, whereas the increases of antioxidant enzymes and Heat shock protein enhance the salt tolerance.
Nevertheless, futher more work is needed to identify another salt-responsive proteins which may be involved in physiological and biochemical responses to salt stress including signal transduction, mRNA processing and the regulation of the cell cycle.
7. Conclusions
Metapontum Forest Reserve is an area that was established since 1934 and plays an important role in the landscape hosting to a large and diverse groups not only of plant species, but also animals, that found in this area an ideal habitat for their survival. Our study was aimed to characterizing the responses of d’Aleppo pine to NaCl stress at proteome level. It is particularly important understand how plants acquire stress tolerances due to their sessile nature. The proteins in pine needle leaves that were identified as being affected by salt stress include proteins involved in photosynthesis (down-regulated), defense and protein folding (up-regulated). This protein pattern is more visible as we approach the sea, due to increased soil salinity. Taken together these results suggest that exposure to high concentrations of salt causes gross up-regulation of the defense-related proteins in pine neddle leaves, which is possibly the reason of ability to protect cells against salt stress.
Using 2-DE electrophoresis, we identified 29 proteins that significantly up-regulated or down-regulated due to NaCl stress. This study may reflect the fact that, these identified proteins seems to be involved in diverse biochemical reactions imparting tolerance to NaCl stress in pinus. Our findings reveal a series of changes at the protein level that may provide insight into stress tolerance nature.
REFERENCES
- M. Sharifi, M. Ghorbanli and E. Ebrahimzadeh, “Improved Growth of Salinity Stressed Soybean after Inoculation with Salt Pre-Treated Mycorrhizal Fungi,” Journal of Plant Physiology, Vol. 164, No. 9, 2007, pp. 1144- 1151. doi:10.1016/j.jplph.2006.06.016
- B. H. Wiebe, R. G. Eilers, W. D. Eilers and J. A. Brierley, “Application of a Risk Indicator for Assessing Trends in Dryland Salinization Risk on the Canadian Prairies,” Canadian Journal of Soil Science, Vol. 87, 2007, pp. 213- 224. doi:10.4141/S06-068
- V. Chinnusamy, A. Jagendorf and J.-K. Zhu, “Understanding and Improving Salt Tolerance in Plant,” Crop Science, Vol. 45, No. 2, 2005, pp. 437-448. doi:10.2135/cropsci2005.0437
- A. A. Ehsanpour and N. Fatahian, “Effect of Salt and Proline on Medicago Sativa Callus,” Plant Cell Tissue Organ Culture, Vol. 73, No. 1, 2003, pp. 53-56. doi:10.1023/A:1022619523726
- J. K. Zhu, “Salt and Drought Stress Signal Transduction in Plants,” Annual Review of Plant Biology, Vol. 53, 2002, pp. 247-273. doi:10.1146/annurev.arplant.53.091401.143329
- E. Valpreda and U. Simeoni, “Assessment of Coastal Erosion Susceptibility at the National Scale: The Italian case,” Journal of Coastal Conservation, Vol. 9, No. 1, 2003, pp. 43-48. doi:10.1652/1400-0350(2003)009[0043:AOCESA]2.0.CO;2
- B. M. S. Giambastiani, M. Antonellini,G. H. P. Oude Essink and R. J. Stuurman, “Saltwater Intrusion in the Unconfined Coastal Aquifer of Ravenna (Italy), A Numerical Model,” Journal of Hydrology, Vol. 340, No. 1-2, 2007, pp. 91-104. doi:10.1016/j.jhydrol.2007.04.001
- A. Satriani, A. Loperte, T. Simoniello, M. D’Emilio, C. Belviso and V. Lapenna, “A Multidisciplinary Approach for Studying the Forest Reserve of Metapontum (Southern Italy) Affected by Saltwater Intrusion Phenomena,” EGU Geophysical Research Abstracts, Research ID: 909525, 2007, pp. 1607-7962.
- A. M. Ebraheem, M. W. Hamburger, E. R. Bayless and N. C. Krothke, “A Study of Acidmine Drainage Using Earth Resistivity Measurements,” Groundwater, Vol. 28, No. 3, 1990, pp. 361-368. doi:10.1111/j.1745-6584.1990.tb02265.x
- A. A. M. Ebraheem, M. M. Senosy and K. A. Dahab, “Geoelectrical and Hydrogeochemical Studies for Delineating Ground-Water Contamination Due to Salt-Water Intrusion in the Northern Part of the Nile Delta, Egypt,” Groundwater, Vol. 35, No. 2, 1997, pp. 216-222. doi:10.1111/j.1745-6584.1997.tb00077.x
- A. S. El Mahhmoudi, “Geoelectric Resistivity Investigations of Kafr Saqr Sheet, Sharrqiya Governorate, East Nile Delta,” Journal of Petroleum and Mining Engineering, Vol. 2, No. 1, 1999, pp. 84-108.
- D. H. Griffiths and R. D. Barker, “Two-Dimensional Resistivity Imaging and Modelling in Areas of Complex Geology,” Journal of Applied Geophysics, Vol. 29, No. 3- 4, 1993 pp. 211-226. doi:10.1016/0926-9851(93)90005-J
- T. Dahlin, “2D Resistivity Surveying for Environmental and Engineering Applications,” First Break, Vol. 14, No. 7, 1996, pp. 275-283.
- J. W. Hager and J. C. Y. Le Blanc, “Production Scanning Using a Q-q-QLinear Ion Trap (Q TRAPTM) Mass Spectrometer,” Rapid Communications in Mass Spectrometry, Vol. 17, No. 10, 2003, pp. 1056-1064. doi:10.1002/rcm.1020
- I. Jorge, R. M. Navarro, C. Lenz and D. Ariza, “The Holm Oak Leaf Proteome: Analytical and Biological Variability in the Protein Expression Level Assessed by 2-DE and Protein Identification Tandem Mass Spectrometry de Novo Sequencing and Sequence Similarity Searching,” Proteomics, Vol. 5, No. 1, 2005, pp. 222-234. doi:10.1002/pmic.200400893
- I. V. Shilov, S. L. Seymour, A. A. Patel and A. Loboda, “The Paragon Algorithm, a Next Generation Search Engine That Uses Sequence Temperature Values and Feature Probabilities to Identify Peptides from Tandem Mass Spectra,” Molelular Cellular Proteomics, Vol. 6, No. 6, 2007, pp. 1638-1655. doi:10.1074/mcp.T600050-MCP200
- B. Winkel-Shirley, “Biosynthesis of Flavonoids and Effects of Stress,” Current Opinion in Plant Biology, Vol. 5, No. 3, 2002, pp. 218-223. doi:10.1016/S1369-5266(02)00256-X
- R. Munns and M. Tester, “Mechanisms of Salinity Tolerance,” Annual Review of Plant Physiology and Plant Molecular Biology, Vol. 59, 2008, pp. 651-681. doi:10.1146/annurev.arplant.59.032607.092911
- E. Vierling, “The Roles of Heat Shock Proteins in Plants,” Annual Review of Plant Physiology and Plant Molecular Biology, Vol. 42, 1991, pp. 579-620. doi:10.1146/annurev.pp.42.060191.003051
- N.-H. Song and Y.-J. Ahn, “DcHsp7.7, a Small Heat Shock Protein in Carrot, Is Tissue-Specifically Expressed under Salt Stress and Confers Tolerance to Salinity,” New Biotechnology, Vol. 28, No. 6, 2011, pp. 698-704. doi:10.1016/j.nbt.2011.04.002
- J. S. Marshall and K. Keegstra, “Isolation and Characterization of a cDNA Clone Encoding the Major Hsp70 of the Pea Chloroplastic Stroma,” Plant Physiology, Vol. 100, No. 2, 1992, pp. 1048-1054. doi:10.1104/pp.100.2.1048
- J. Wang, C. Zhao, B. Meng, J. Xie, C. Zhou, X. Chen, K. Zhao, J. Shao, Y. Xue, N. Xu, Y. Ma and S. Liu, “The Proteomic Alterations of Thermoanaerobacter Tengcongensis Cultured at Different Temperatures,” Proteomics, Vol. 7, No. 9, 2007, pp. 1409-1419. doi:10.1002/pmic.200500226
- B. K. Ndimba, S. Chivasa, W. J. Simon and A. R. Slabas, “Identification of Arabidopsis Salt and Osmotic Stress Responsive Proteins Using Two Dimensional Difference Gel Electrophoresis and Mass Spectrometry,” Proteomics, Vol. 5, No. 16, 2005, pp. 4185-4196. doi:10.1002/pmic.200401282
- M. Hajheidari, M. Abdollahian-Noghabi, H. Askari, M. Heidari and S. Y. Sadeghian, “Proteome Analysis of Sugar Beet Leaves under Drought Stress,” Proteomics, Vol. 5, No. 4, 2005, pp. 950-960. doi:10.1002/pmic.200401101
- S.-P. Yan, Q.-T. Zhang, Z.-C. Tang, W. A. Su and W.-N. Sun, “Comparative Proteomic Analysis Provides New Insights into Chilling Stress Responses in Rice,” Molecular and Cellular Proteomics, Vol. 5, No. 3, 2006, pp. 484- 496. doi:10.1074/mcp.M500251-MCP200
- F. Madueno, J. A. Napier and J. C. Gray, “Newly Imported Rieske Iron-Sulfur Protein Associates with Both Cpn6O and Hsp70 in the Chloroplast Stroma,” Plant Cell, Vol. 5, No. 12, 1993, pp. 1865-1876.
- M. Schroda, O. Vallon, F. A. Wollman and C. F. Beck, “A Chloroplast-Targeted Heat Shock Protein 70 (HSP70) Contributes to the Photoprotection and Repair of Photosystem II during and after Photoinhibition,” Plant Cell, Vol. 11, No. 6, 1999, pp. 1165-1178.
- A. Kader and S. Lindberg, “Cytosolic Calcium and pH Signaling in Plants under Salinity Stress,” Plant Signaling Behavior, Vol. 5, No. 3, 2010, pp. 233-238. doi:10.4161/psb.5.3.10740
- P. M. Hasegawa and R. A. Bressan, “Plant Cellular and Molecular Responses to High Salinity,” Annual Review of Plant Physiology and Plant Molecular Biology, Vol. 51, 2000, pp. 463-499. doi:10.1146/annurev.arplant.51.1.463
- J. A. Herna´ndez, F. J. Corpas, M. Go´mez, L. A. del Rı´o and F. Sevilla, “Salt-Induced Oxidative Stress Mediated by Activated Oxygen Species in Pea Leaf Mitochondria,” Physiologia Plantarum, Vol. 89, No. 1, 1993, pp. 103- 110. doi:10.1111/j.1399-3054.1993.tb01792.x
- J. A. Herna´ndez, E. Olmos, F. J. Corpas, F. Sevilla and L. A. del Rı´o, “Salt-Induced Oxidative Stress in Chloroplast of Pea Plant,” Plant Science, Vol. 105, No. 2, 1995, pp. 151-167. doi:10.1016/0168-9452(94)04047-8
- J. A. Herna´ndez, A. Jime´nez, P. M. Mullineaux and F. Sevilla, “Tolerance of Pea (Pisum sativum L.) to LongTerm Salt Stress Is Associated with Induction of Antioxidant Defences,” Plant Cell Environment, Vol. 23, No. 8, 2000, pp. 853-862. doi:10.1046/j.1365-3040.2000.00602.x
- D. Bartels and R. Sunkar, “Drought and Salt Tolerance in Plants,” Critical Reviews in Plant Science, Vol. 24, No. 1, 2005, pp. 23-58. doi:10.1080/07352680590910410
- J. Dat, E. Vandenabeele, M. Vranova´, M. Van Montagu, D. Inze´ and F. Van Breusegem, “Dual Action of the Active Oxygen Species during Plant Stress Responses,” Cellular and Molecular Life Sciences, Vol. 57, No. 5, 2000, pp. 779-795. doi:10.1007/s000180050041
- T. S. Gechev, F. Van Breusegem, J. M. Stone, I. Denev and C. Laloi, “Reactive Oxygen Species as Signals that Modulate Plant Stress Responses and Programmed Cell Death,” Bioessays, Vol. 28, No. 11, 2006, pp. 1091-1101. doi:10.1002/bies.20493
- G. Noctor, R. De Paepe and C. H. Foyer, “Mitochondrial Redox Biology and Homeostasis in Plants,” Trends in Plant Science, Vol. 12, No. 3, 2007, pp. 125-134. doi:10.1016/j.tplants.2007.01.005
- R. Mittler, “Oxidative Stress, Antioxidants and Stress Tolerance,” Trends in Plant Science, Vol. 7, No. 9, 2002, pp. 405-410. doi:10.1016/S1360-1385(02)02312-9
- O. Blokhina, E. Virolainen and K. V. Fagerstedt, “Antioxidants, Oxidative Damage and Oxygen Deprivation Stress,” Annals of Botany, Vol. 91, No. 2, 2003 pp. 179- 194. doi:10.1093/aob/mcf118
- S. Barranco-Medina, T. Krell, I. Finkemeie, F. Sevilla, J. J. Lazaro and K. J. Dietz, “Biochemical and Molecular Characterization of the Mitochondrial Peroxiredoxin PsPrxII F from Pisum sativum,” Plant Physiology and Biochemistry, Vol. 45, No. 10-11, 2007, pp. 729-739. doi:10.1016/j.plaphy.2007.07.017
- P. Pulido, R. Cazalis and F. J. Cejudo, “An Antioxidant Redox System in the Nucleus of Wheat Seed Cells Suffering Oxidative Stress,” Plant Journal, Vol. 57, No. 1, 2009, pp. 132-145. doi:10.1111/j.1365-313X.2008.03675.x
- N. B. Tripathi, I. Bhatt and K. J. Dietz, “Peroxiredoxins: A Less Studied Component of Hydrogen Peroxide Detoxification in Photosynthetic Organisms,” Protoplasma, Vol. 235, No. 1-4, 2009, pp. 3-15. doi:10.1007/s00709-009-0032-0
- N. Rouhier and J. Jacquot, “The Plant Multigenic Family of Thiol Peroxidase,” Free Radical Biology and Medicine, Vol. 38, No. 11, 2005, pp. 1413-1421. doi:10.1016/j.freeradbiomed.2004.07.037
- V. Bernier-Villamor, D. A. Sampson, M. J. Matunis and C. D. Lima, “Structural Basis for E2-Mediated SUMO Conjugation Revealed by a Complex between UbiquitinConjugating Enzyme Ubc9 and RanGAP1,” Cell, Vol. 108, No. 3, 2002, pp. 345-356. doi:10.1016/S0092-8674(02)00630-X
- N. Rouhier, A. Villarejo and M. Srivastava, “Identification of Plant Glutaredoxin Targets,” Antioxidants and Redox Signalin, Vol. 7, No. 7, 2005, pp. 919-929. doi:10.1089/ars.2005.7.919
- I. Finkemeier, M. Goodman, P. Lamkemeyer, A. Kandlbinder, L. J. Sweetlove and K. J. Dietz, “The Mitochondrial Type II Peroxiredoxin F Is Essential for Redox Homeostasis and Root Growth of Arabidopsis Thaliana under Stress,” Journal of Biological Chemistry, Vol. 280, No. 13, 2005, pp. 12168-12180. doi:10.1074/jbc.M413189200
- C. Laloi, N. Rayapuram, Y. Chartier, J. M. Grienenberger, G. Bonnard and Y. Meyer, “Identification and Characterization of a Mitochondrial Thioredoxin System in Plants,” Proceedings of the National Academy of Sciences, USA, Vol. 98, No. 24, 2001, pp. 14144-14149. doi:10.1073/pnas.241340898
- C. T. Liao and C. H. Lin, “Physiological Adaptation of Crop Plants to Flooding Stress,” Proceedings of the National Science Council, Republic of China. Part B, Vol. 25, No. 3, 2001 pp. 148-157.
- N. Qiu and C. Lu, “Enhanced Tolerance for Photosynthesis against High Temperature Damage in Salt Adapted Halophyte Atriplex Centralasiatica,” Plant Cell Environment, Vol. 26, No. 3, 2003, pp. 1137-1145. doi:10.1046/j.1365-3040.2003.01038.x
- M. J. Jeong, S. C. Park and M. O. Byun, “Improvement of Salt Tolerance in Transgenic Potato Plants by Glyceraldehyde-3 Phosphate Dehydrogenase Gene Transfer,” Molecules and Cells, Vol. 12, No. 2, 2001, pp. 185-189.
- N. Holmberg and L. Bulow, “Improving Stress Tolerance in Plants by Gene Transfer,” Trends Plant Science, Vol. 3, No. 2, 1998, pp. 61-66. doi:10.1016/S1360-1385(97)01163-1
- I. M. Moller, “Plant Mitochondria and Oxidative Stress: Electron Transport, NADPH Turnover and Metabolism of Reactive Oxygen Species,” Annual Review of Plant Physiology and Plant Molecular Biology, Vol. 52, 2001, pp. 561-591. doi:10.1146/annurev.arplant.52.1.561
- H. Sobhanian, R. Razavizadeh, Y. Nanjo, A. A. Ehsanpour, F. R. Jazii, N. Motamed and S. Komatsu, “Proteome Analysis of Soybean Leaves, Hypocotyls and Roots under Salt Stress,” Proteome Science, Vol. 8, No. 19, 2010, pp. 19-33. doi:10.1186/1477-5956-8-19
- B. K. Ndimba, S. Chivasa, W. J. Simon and A. R. Slabas, “Identification of Arabidopsis Salt and Osmotic Stress Responsive Proteins Using Two-Dimensional Difference Gel Electrophoresis and Mass Spectrometry,” Proteomics, Vol. 5, No. 16, 2005, pp. 4185-4196. xdoi:10.1002/pmic.200401282
- Y. Jiang, B. Yang, N. S. Harris and M. K. Deyholos, “Comparative Proteomic Analysis of NaCl Stress-Responsive Proteins in Arabidopsis Roots,” Journal of Experimental Botany, Vol. 58, No. 13, 2007, pp. 3591-3607. doi:10.1093/jxb/erm207
- N. N. V. Kav, S. Srivastava, L. Goonewardene and S. F. Blade, “Proteome-Level Changes in the Roots of Pisum sativum in Response to Salinity,” Annals of Applied Biology, Vol. 145, No. 2, 2004, pp. 217-230. doi:10.1111/j.1744-7348.2004.tb00378.x
- G. Fei, Y. Zhou, L. Huang, D. He and G. Zhang, “Proteomic Analysis of Long-Term Salinity Stress-Responsive Proteins in Thellungiella halophila Leaves,” Chinese Science Bulletin, Vol. 53, No. 22, 2008, pp. 3530-3537. doi:10.1007/s11434-008-0455-6
- L. D. Noode`n and A. C. Leopold “The Phenomenon of Senescence and Aging in Plants,” Academic Press, San Diego, 1988, pp. 2-50.
- S. Gan and R. M. Amasino, “Inhibition of Leaf Senescence by Autoregulated Production of Cytokinin,” Science, Vol. 270, No. 5244, 1995, pp. 1986-1988. doi:10.1126/science.270.5244.1986
- J. H. M. Schippers, H. C. Jing, J. Hille and P. P. Dijkwe, “Developmental and Hormonal Control of Leaf Senescence,” In: S. Gan, Ed., Senescence Processes in Plants, Blackwell Publishing, Oxford, 2007, pp. 145-170. doi:10.1002/9780470988855.ch7
- [61] Y. S. Noh and R. M. Amasino, “Identification of a Promoter Region Responsible for the Senescence-Specific Expression of SAG12,” Plant Molecular Biology, Vol. 41, No. 2, 1999, pp. 181-194. doi:10.1023/A:1006342412688