American Journal of Plant Sciences
Vol.4 No.3(2013), Article ID:28686,10 pages DOI:10.4236/ajps.2013.43063
Chemically Induced Mutants of Brassica oleracea var. botrytis Maintained Stable Resistance to Drought and Salt Stress after Regeneration and Micropropagation
![]()
1Plant Physiology Laboratory, School of Biological and Biomedical Sciences, University of Plymouth, Plymouth, UK; 2Department of Biotechnology, University of Malakand, Khyber Pakhtunkhwa, Pakistan.
Email: *dr.fhadi@uom.edu.pk, fazalbiotech@yahoo.com
Received January 18th, 2013; revised February 20th, 2013; accepted February 28th, 2013
Keywords: Drought; Salt Stress Resistance; Proline; In-Vitro; In-Vivo; Cauliflower
ABSTRACT
Investigation was made to confirm the stability of drought and salt stress tolerance in cauliflower (Brassica oleracea var. botrytis) mutants after regeneration and micropropagation. The N-nitroso-N-ethyleurea (NEU) and N-nitroso-Nmethylurea (NMU) induced mutants of cauliflower were created and screened for drought and salt stress tolerance. The highly tolerant mutants were selected, regenerated by tissue culture techniques, screened again for drought and salt tolerance under in-vitro and in-vivo conditions, correlated the response of in-vitro and in-vivo plants within a clone. Free proline levels in clones were correlated with stress tolerance. Results confirmed the persistence of mutations in clones with enhanced resistance levels to stresses over control plants. The regenerated in-vitro and in-vivo plants within a clone showed a positive significant correlation for drought (R2 = 0.663) and salt (R2 = 0.647) resistance that confirms the stability of mutation in clones after generations. Proline showed a positive and significant correlation with drought (R2 = 0.524) and salt (R2 = 0.786) tolerance. Conclusively, drought and salt resistance can be successfully enhanced in cauliflower by chemical mutagenesis. Further molecular analysis is recommended to study these mutants.
1. Introduction
Abiotic stresses such as drought and salinity due to their wide range occurrence may cause the most fatal economic losses in agriculture. It is estimated that such stresses can potentially reduce the yield of crop plants by more than 50% [1-3]. It is accepted that the human population of the world is increasing day by day at an alarming rate and crop productivity is decreasing due to various abiotic stresses [4]. The minimization of these losses is a major area of concern for crop scientists. Since it is often difficult and about impossible to eliminate or reduce the stresses themselves, so there ultimate way is to develop the stress tolerant genotypes [4]. Breeding for abiotic stress resistance in crop plants for food supply is therefore important and should be given high research priority. The classical methods of breeding is time consuming and sometime inefficient while through DNA mutation or direct gene transfer the cultivar might be improved for stress resistance without disrupting the genotype and breaking of gene linkages [5]. Mutation offers the possibility of inducing desired attributes that either cannot be expressed in nature or have been lost during evolution [6].
The chemical mutagens that induce mutation in plant cell cultures could be divided into two groups, base analogous and alkaline agents. Alkaline agents include N-nitrose-N-ethylurea (NEU), N-nitrose-N-methylurea (NMU), alkyl sulphate and nitrogen mustards. NEU or NMU are biofunctional agents [7] and can induce depurination and depyrimination. Both NEU or NMU have been shown to induce gene mutation (deletion), transition mutation, unscheduled DNA synthesis (UDS), sister chromatid exchange (SCE) and induce DNA-DNA and DNA protein crosslink [8,9]. Chemical mutagenesis have the ability to induce resistance to multiple stresses in plant and generating crops having multi-stress resistance capability and should be priority strategy of future research program [10]. The better understanding of the specific roles of various osmo-protectent such as proline can give rise to a strategy for the metabolic engineering of crop resistance of drought and salt stress [11]. Proline accumulation under stress was reported for the first time in plant tissues of rye grass [12].
Cauliflower is one of the varieties of the highly polymorphic species Brassica oleracea. The other varieties are acephala (Kale), capitata (Cabbage), gemmifera (Brussels sprouts), kohlrabi and broccoli [13]. Cauliflower is grown for its white curd and cannot resist drought and salt stresses. It is a low-calorie vegetable, a rich source of vitamins C, K, and A (beta-carotine), and folic acid, fiber, and flavonoids, which gives the cauliflower anti-inflammatory and antioxidant proprieties, as well as it is an important source for animal feed [13,14] reported them to be a group of potentially cancer preventative vegetables.
In previous study the cauliflower mutants were created in-vitro using chemical mutagens (NEU and NMU) and screening was mad for selection of abiotic stress tolerant mutants and selected mutants were denoted as S1, S2, S3 and so on [15]. The mutant lines and control plants were maintained in-vitro through shoot tips sub-culturing. In present investigation, the highly tolerant (to drought and salt stress) mutant lines were selected and then regenerated. The regenerated mutants were denoted with symbol K throughout this paper. In this paper we report the analysis of regenerated mutants and control plants for drought and salt stress tolerance under in-vitro and invivo (weaned) conditions. The objective of this investigation was to screen out the mutants after regeneration for the confirmation of the stability of mutation over regeneration in relation to the increased resistance to drought and salt stress under in-vitro and in-vivo conditions.
2. Materials and Methods
2.1. Mutagenesis and Selection of Stress Resistant Mutants
The January heading Roscoff F1 hybrid cauliflower Medaillon (courtesy of Elsoms Seeds Ltd) was grown in the field of the Seale-Hayne Estate, University of Plymouth, Devon, UK. The curds were harvested and taken to the laboratory where in-vitro micro-shoots were produced in liquid culture according to the method of Kieffer et al. [16]. The mutagenesis was carried out using N-nitroso-N-ethyleurea (NEU) and N-nitroso-N-methylurea (NMU) as mutagens [17]. A population of nonmutated/selected control clones was also prepared from the same curd materials. For the present investigation, eight highly tolerant (to drought and salt stress) mutants were selected on the bases of previous screening of mutated population by Fuller et al. [15]. A set of the in-vitro clones were transferred to in-vivo condition through weaning process. Plantlets were uprooted and agar from the roots was gently removed by hand. A systemic general fungicide was sprayed on the roots to protect from soil borne pathogenic fungi, and then transferred to pots (6 cm × 6 cm) containing moist compost and kept in a growth chamber at 20˚C with 16 hours light (light intensity 180.8 µmol·m−2·s−1). After 5 days the lids of the culture pots were perforated using a hot needle to reduce humidity inside the pots and left for 5 days, then lids were taken off and for 5 days regular water checking was carried out. The bases of pots were then perforated with a hot needle and after 5 days the pots were transferred to the green house under shade. After 5 days under shade the plantlets were transferred to bigger pots (12 cm × 13 cm) containing moist compost and exposed to full natural light in the green house (min 15˚C, 16 h long day photoperiod) and allowed to grow in in-vivo conditions.
2.2. Regeneration and Micropropagation of Clones
The curds from in-vivo clones (grown in greenhouse) were collected and used as explants for regeneration and multiplication of clones using medium of Kieffer et al. [18]. The regenerated in-vitro cultures were maintained in a growth chamber at 23˚C, and 16 h photoperiod. On the bases of agar concentrations, three different media S23M [18] were prepared for proliferation to compare their response on shoot induction and growth rate. The agar was added as 7 g·L−1, 4 g·L−1 and 0 g·L−1 denoted as T1, T2 and T3 respectively. The pH of media was adjusted to 5.8 and autoclaved. 20 ml·pot−1 of medium was poured into each sterile plastic pot (5 cm × 4 cm) under aseptic conditions in a laminar flow cabinet; a lid was then placed on each pot and allowed to cool overnight at room temperature prior to inoculation.
2.3. Drought Stress Resistance Investigation
Drought resistance assessment of genotypes was carried out by leaf disc assays to compare their resistance potential. For this evaluation 4 g·L−1 MS medium [19] was dissolved in distilled water with different test concentrations of Mannitol added (0, 150, 250, 350 and 450 mM) denoted by T0, T1, T2, T3 and T4 respectively. The pH of all of the media was adjusted to 5.8 prior to being autoclaved. The sterilized media were poured into sterile Petri dishes under aseptic conditions in a laminar flow cabinet. Leaves from both in-vivo (weaned) from green house as well as in-vitro clones were tested. Two fully expanded upper leaves from each plant (clone) were collected from the green-house and surface sterilised in 70% ethanol for a few seconds and then in 10% bleach for 10 minutes followed by three rinses with sterile distilled water. Leaf discs were cut using a 1.0 cm diameter cork borer from the leaf blade areas avoiding the major vascular bundles and leaf discs of each genotype were transferred to a specifically labelled and sterilized Petri dish containing sterilized distilled water and allowed to stand overnight at room temperature in order to become turgid. The following day the turgor weight (TW) of each leaf disc was recorded, using a 5 decimal place balance, and then the discs were allocated to each one of the different media contained in Petri dishes and incubated for seven days in an incubator at 23˚C with 16 h photoperiod. Three and two divisions replicate Petri plates were used for in-vivo and in-vitro clones respectively for each treatment, and each plate contained three discs which had been individually labelled on the leaf surface (1, 2, 3) using a permanent marker pen during discs preparation. After seven days the weight of each disc was re-measured and noted as the fresh weight (FW). Discs were then freeze dried and the dry weight (DW) of each of the discs recorded. Percent relative water content (RWC) for each disc was measured using the formula RWC% = (FW−DW)/(TWvDW) × 100. The mean value of replicates discs and then of replicate Petri plates was analysed. The total number of petri plates used for each of in-vivo and in-vitro clone screening were = 9 genotypes × 3 rep × 5 treatments = 135.
2.4. Salt Stress Resistance Evaluation
The clones analysed for drought were also tested for salt resistance. Both in-vivo as well as in-vitro clones were analysed. Liquid media of three different concentrations of sodium chloride (NaCl) were prepared in distilled water i.e. 0 mM (control), 350 mM and 550 mM (approximately the concentration of sea water) and labelled as T0, T1 & T2 respectively, then 4 g·L−1 MS salts [19] were added to each of T0, T1 and T2. The pH of all media was adjusted to 5.8, and then autoclaved. Media were poured into sterile Petri dishes under aseptic conditions in a laminar flow cabinet. Three replicate Petri dishes were used for each clone under each treatment. Two fully expanded upper leaves were detached from each genotype clone in the green-house (in-vivo) and brought to lab in a cooled insulation box. Leaves were surface sterilized with 70% ethanol for a few seconds and then in a solution of 10% bleach for 10 min followed by 3 rinses with sterile distilled water. Leaf discs of 1 cm diameter were prepared in a laminar flow hood under aseptic conditions and 3 discs/Petri dish were floated on each liquid media. Petri dishes were properly labelled and three replicate petri plates were used for each genotype and each treatment and placed in an incubator at 23˚C with 16 h photoperiod. Leaf discs from in-vitro clones were prepared direct from pots and analysed in a similar way used for in-vivo clones analyses. The total petri dishes used for each of in-vitro or in-vivo clones analyses were = 9 genotypes × 3 rep × 3 treatments = 81 plates. The effect of salt concentrations on leaf discs was recorded after 3, 5 & 7 days treatments. Change in leaf discs color was used as a score to differentiate resistance strength. Color change of leaf discs was categoriesed as 1) Dark green (100% greenness); 2) Light green-no white (75% greenness); 3) Half light green half white (50% greenness); 4) Small amount of light green (25% greenness); 5) White (0% greenness).
2.5. Proline (Pro) Extraction and Estimation
Proline extraction and biochemical quantification was carried out following the method of Bates et al. [20]. 100 mg powder of frozen leaf tissue was homogenized in 1.5 ml of 3% sulfosalicylic acid in 2 ml tubes. Centrifugation was carried out at 13,000 xg for 5 minutes. 300 µl of the supernatant was treated with 2 ml glacial acetic acid and 2 ml acid ninhydrin (1.25 g ninhydrin warmed in 30 ml glacial acetic acid and 20 ml 6 M phosphoric acid until dissolved) in test tubes at 100˚C in a boiling water bath for 1 h. The reaction was then ended immediately by dipping the tubes in ice. The reaction mixture was extracted with 1 ml toluene by mixing vigorously for 10 - 30 seconds. The chromophore containing toluene was pipetted from the aqueous phase, warmed to room temperature and the absorbance was read at 520 nm by spectrophotometer using toluene for a blank. The concentration of proline in different samples was determined from a standard curve. Three replicates were used for each sample.
2.6. Statistical Analysis
Analysis of variance (ANOVA) was performed using Minitab 15 and the mean values of three replicate plants within a clone along with standard error presented. Mean values were compared using Tukey’s honestly significant difference test at p ≤ 0.05. Correlation among the different parameters was investigated using Excel fitting curve and values of the correlation coefficient for different levels of significance investigated according to Fisher and Frank [21].
3. Results
3.1. Regeneration and Weaning
Responses to different media was different for the regeneration of the same genotype, the medium with 4 g·L−1 agar (T2) was found to be best for shoot induction and subsequent growth rate whilst the medium with 7 g·L−1 agar (T1) was better than the medium without agar (T3) which tended to leave the explants vitrified. The difference in shoot induction and growth was observed after three weeks period but this difference was more clear after 15 days period as shown in Figure 1(a). The invitro regenerated clones were transferred to in-vivo conditions through weaning process (Figure 1(b)) and this weaning process demonstrated 100% successful transfer of in-vitro clones to in-vivo conditions without any damageable symptom observed even in a single plant.
3.2. Assessment of In-Vivo and In-Vitro Clones (Mutants and Control) for Drought Resistance
Results showed clear differences in leaf disc relative water contents of in-vivo (Figure 2(a)) and in-vitro (Figure 2(b)) clones after treatment with different mannitol concentrations. Overall the relative water content was reduced while increasing the mannitol concentration showing the dehydration effect of the treatments and there was differentiation between the genotypes. The mutant genotypes maintained more water even at 450 mM mannitol (T4) as compared to control plant indicating drought resistance. All the mutant genotypes showed more than 50% RWC at 450 mM (T4) while control plant maintained less than 50% RWC at T4 (Figure 2(a)). The highly resistant mutants K21, K1, K19 and K18 showed 73%, 69%, 62% and 57% respectively at 450 mM (Figure 2(a)). The in-vitro clones showed similar response to in-vivo plants with increasing mannitol concentration reducing the water contents of leaf discs. Even at the highest concentration of mannitol (450 mM) some mutants like K1, K19, and K21 maintained higher water content compared to the control (KC) (Figure 2(a) and (b)). It can be concluded that mutants like K1, K13, K19, and K21 showed overall highly significant resistant to mannitol induced drought as compared to control plant (Figure 2(c)).
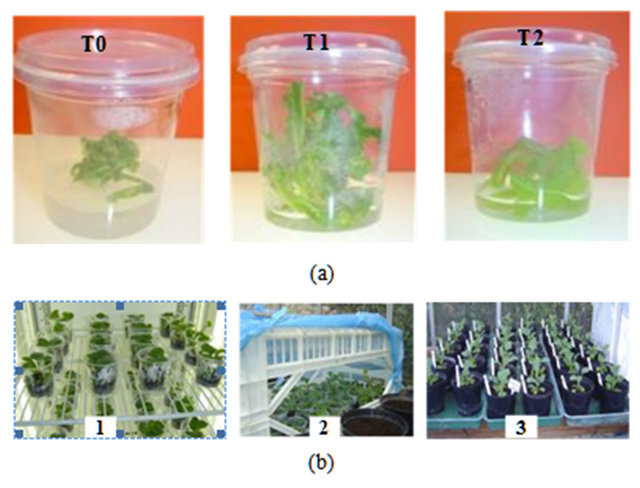
Figure 1. (a) = Regeneration response of plant on different media based on agar concentrations (T1) 7 g·L−1, (T2) 4 g·L−1, (T0) without agar; (b) = Steps in weaning process (1-3).
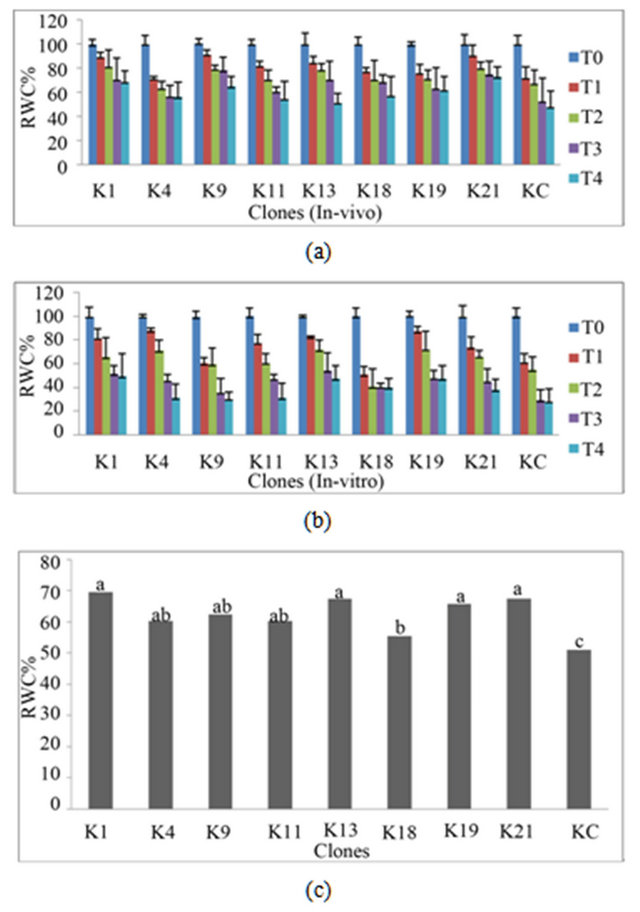
Figure 2. Relative water contents (RWC%) in leaf discs of clones at different concentrations of Mannitol in media, T0 = control without mannitol, T1 = 150 mM, T2 = 250 mM, T3 = 350 mM and T4 = 450 mM. (a) In-vivo clones; (b) In-vitro clones. The values represent mean of three clones of each genotype and bar shows standard error; (c) Overall response (means of in-vitro and in-vivo plants within a clone at all treatments of mannitol) of each genotype was compared and different letters indicate significant difference (Tukey’s test at p ≤ 0.05). Clones KC is control and K1- K21 are mutants. Higher RWC indicate resistance to drought.
3.3. Evaluation of Clones (Mutants and Control) for Salt Resistance
The increase in salt concentration and time of exposure showed a decrease in greenness in both in-vivo (Figure 3(a)) and in-vitro (Figure 3(b)) clones. After 3 days incubation the differences between genotypes was not obvious but by day 5 differences were clear and on day 7 there was a clear differentiation between mutants and control in the presence of 350 mM NaCl in media, while this difference was further increased when the NaCl concentration increased to 550 mM as shown in Figures 3(c)-(d) and Figures 3(e)-(f) respectively for in-vivo and in-vitro clones at 350 and 550 mM NaCl each. Some mutants had also progressed from green to white and the highest concentration of NaCl (550 mM) in liquid media
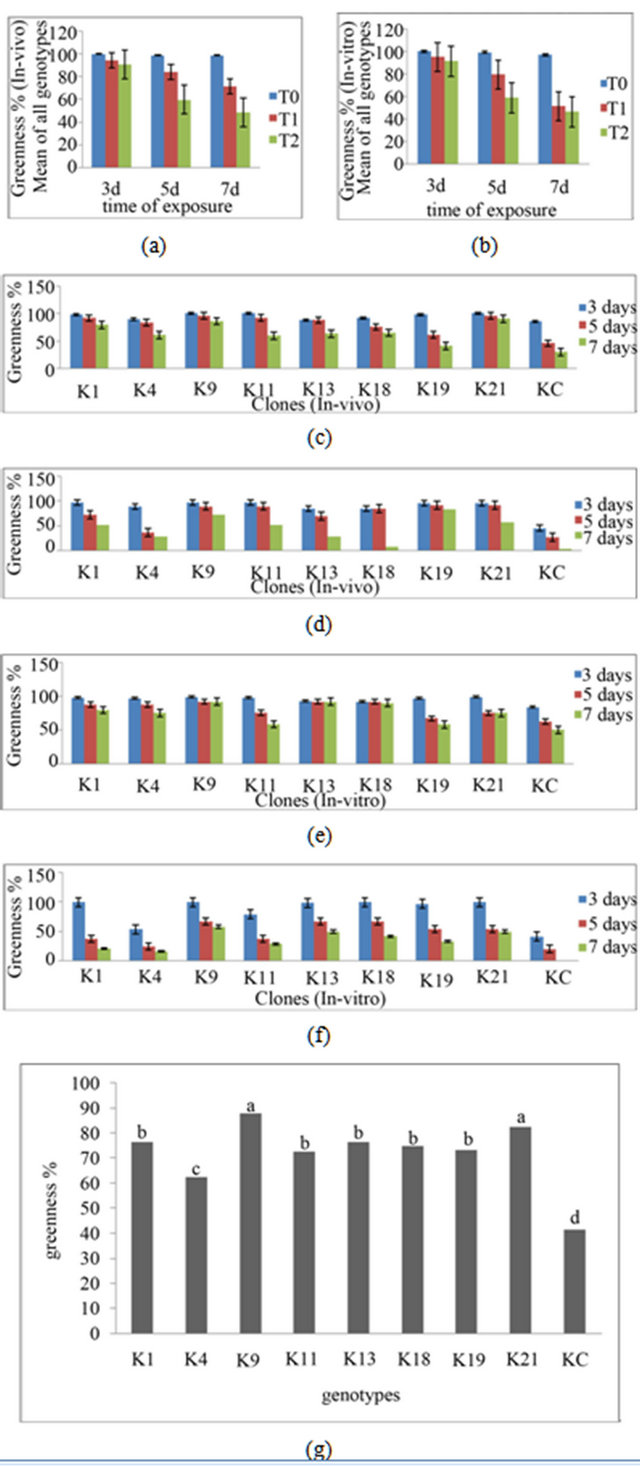
Figure 3. Salt stress resistance of clones after 3, 5 and 7 days treatments with different concentrations of salt (T0 = without salt, T1 = 350 mM NaCl, T2 = 550mM NaCl): mean of all in-vivo clones (a); and mean of all in-vitro clones (b); The individual genotype response of in-vivo clones at 350 mM (c); 550 mM NaCl in media (d); and in-vitro clones at 350 mM (e); and 550 mM NaCl (f). The values represent mean of three clones of each genotype. (g) Overall response of each genotype and different letters indicate significant difference (Tukey’s test p ≤ 0.05). Higher greenness % indicates the salt resistance.
showed clear differences in colour change from dark green to white with control leaf discs after seven days treatments (Figure 4). Some mutants, e.g. K19, K9, showed a high level of resistance and maintained 83% and 73% greenness respectively at 550 mM NaCl after 7 days treatment (Figure 3(d)). Control leaf discs showed less than 20% greenness after 7 days treatment at 550 mM NaCl in in-vivo (Figure 3(d)) and less than 10% in in-vitro (Figure 3(f)) clones. All the selected mutants showed significant increase in salt resistance when compared with control (Figure 3(g)) and among the mutants the response of each mutant was different.
3.4. Correlations between In-Vitro and In-Vivo Clones for Drought and Salt Resistance
The leaf discs either from in-vivo or in-vitro clones, both showed damage on exposure to salt and drought stresses. There was a positive and significant linear correlation between the in-vitro and in-vivo clones for drought (Figure 5) and salt (Figure 6) stress resistance.
3.5. Correlation of Proline with Drought and Salt Resistance in Clones
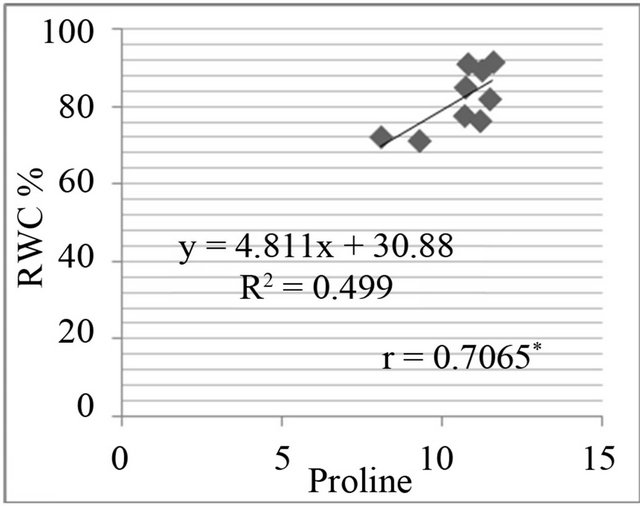
The proline level was measured in in-vivo clones and correlated with relative water content % (drought stress) and greenness % (salt stress). A positive and significant correlation was found between percent relative water content and proline (Figure 7) and also found positive and significant correlation between greenness % and proline level in clones (Figure 8).
3.6. Stress Resistance Summary of Mutants
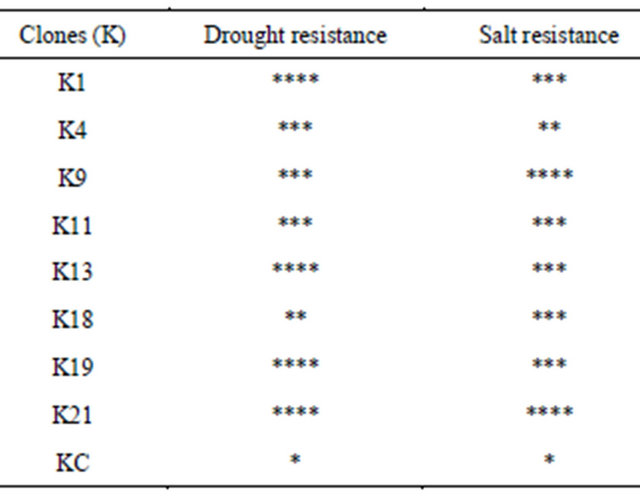
The summarize data are presented in Table 1. All of the mutants except a few showed higher resistance over control for drought and salt stresses, which clearly demonstrated the existence and stability of the chemically in-
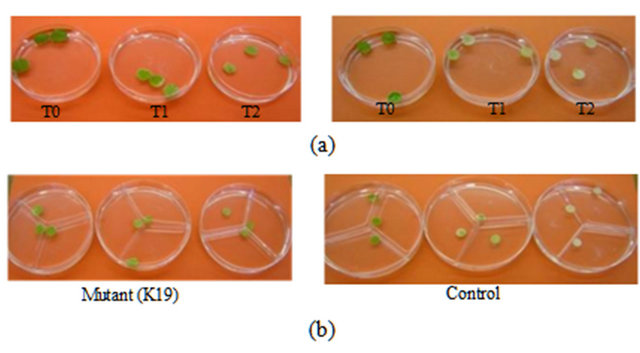
Figure 4. The effect of NaCl concentrations on leaf discs after 7 days treatments. (a) = In-vivo clones (mutant and control); (b) = In-vitro clone. T0 = Control media without NaCl; T1 = 350 mM NaCl in media; T2 = 550 mM NaCl in media, Greenness indicate resistance.
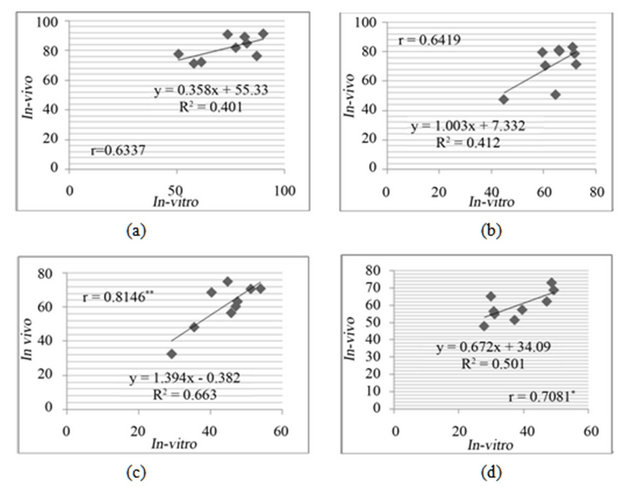
Figure 5. Correlation of relative water content (RWC%) between in-vivo and in-vitro clones at different concentration of mannitol, (a) 150 mM; (b) 250 mM; (c) 350 mM; (d) 450 mM mannitol in media.
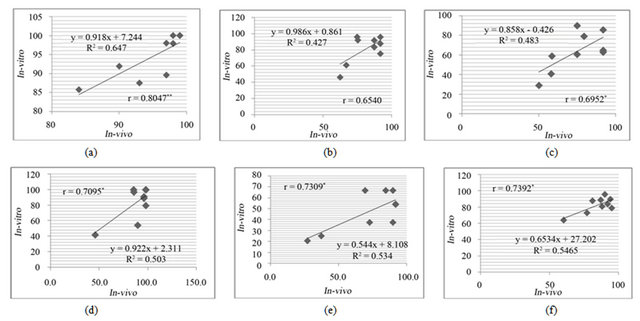
Figure 6. The correlation of % greenness between in-vivo and in-vitro clones, in the presence of 350 mM NaCl in media after 3 days (a) 5 days (b) 7 days (c), and in the presence of 550 mM NaCl in media after 3 days (d) 5 days (e) and 7 days (f) of treatments.
duced mutations after regeneration and micro-propagation. Some mutants were resistant to single stress while other mutants like K1, K9, K13, K19 and K21 were highly resistant to double stresses.
4. Discussion
The results clearly demonstrated altered stress resistance in chemically (NEU & NMU) induced mutants of cauliflower compared to control plants. This confirmed the persistence of mutations after regeneration and over long time storage through many sub-cultures. In addition, the in-vivo forms of these mutants correlated positively with in-vitro screening of resistance. This correlation between in-vitro and in-vivo plants within a clone shows the stability of phenotypes as well as might also indicate the mutation stability in relation to enhanced drought and salt stress resistance in mutants on comparison with con-
 (a)
(a)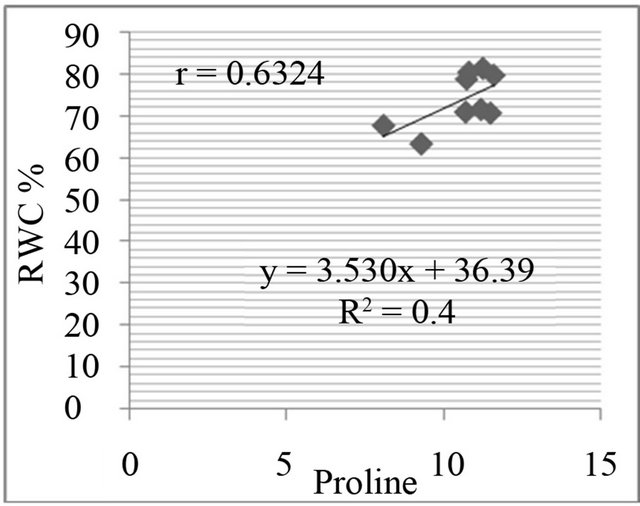 (b)
(b)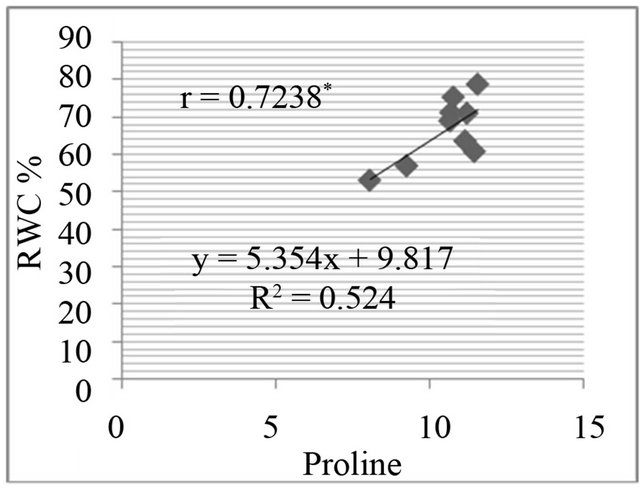 (c)
(c)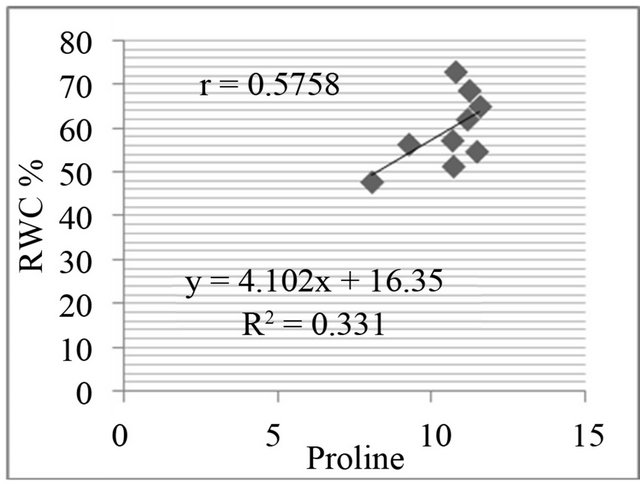 (d)
(d)
Figure 7. Correlation between relative water content (RWC%) and free proline level (µg·g−1) in genotypes. RWC% in leaf discs under different concentrations of manitol in media (a) 150 mM; (b) 250 mM; (c) 350 mM; (d) 450 mM mannitol.
 (a)
(a)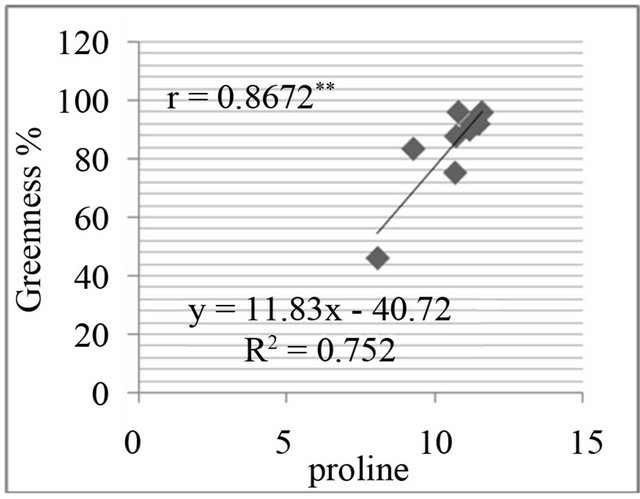 (b)
(b)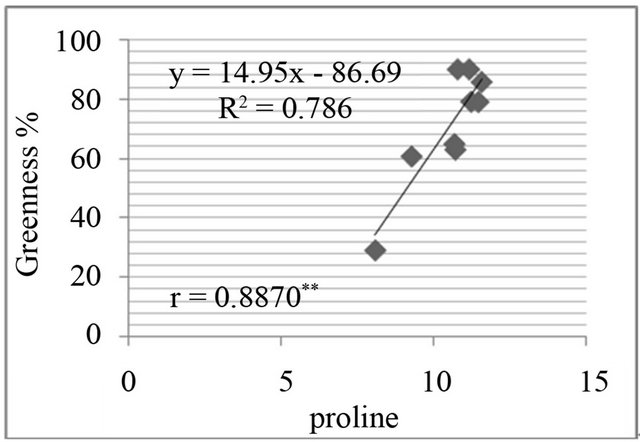 (c)
(c)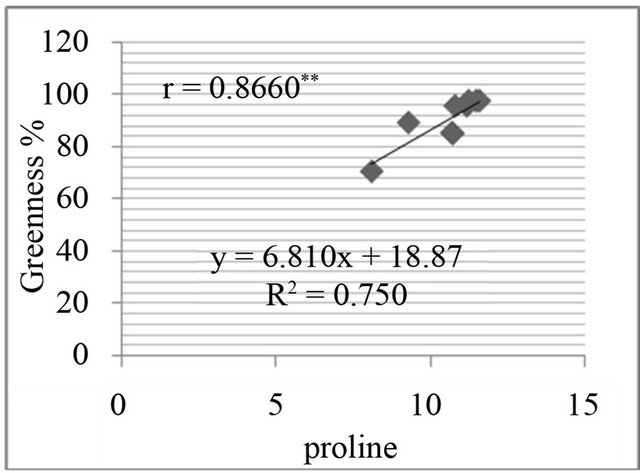 (d)
(d)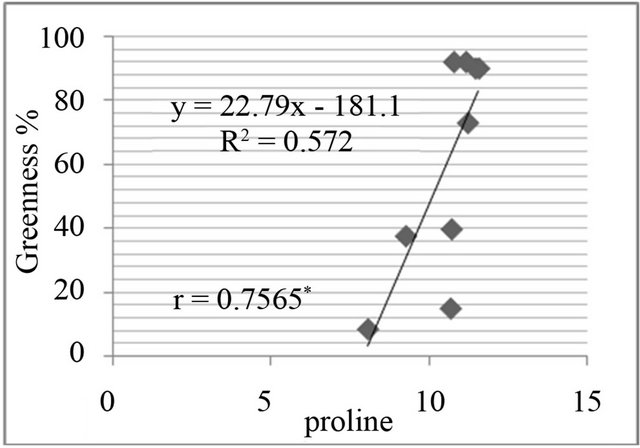 (e)
(e)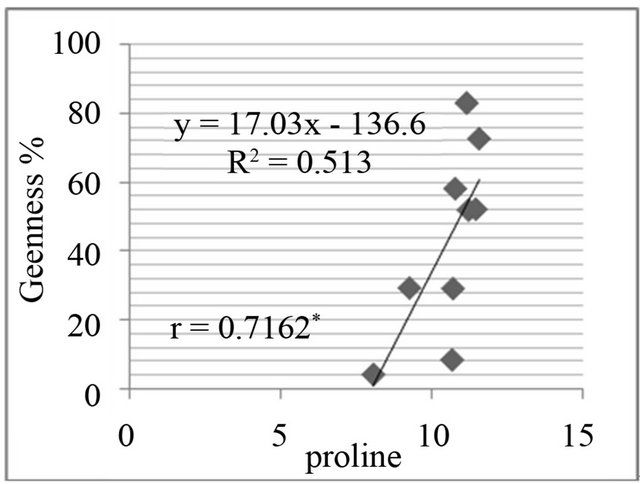 (f)
(f)
Figure 8. Correlation between salt resistance in terms of greenness % and free proline(µg·g−1) in genotypes, in the presence of 350 mm NaCl in medium after 3 days (a), 5 days (b), 7 days (c) and in the presence of 550 mM NaCl after 3 days (d), 5 days (e), and 7 days (f) of treatments.
trol. These findings show that this approach (chemical mutagenesis) is successful in producing mutant lines with improved drought and salt resistance and suggest that the NEU and NMU could be used in plant breeding programs for Brassica oleraceae, as already been used in other breeding programmes [8,9].
The simple leaf disc assay refined in this investigation was found to successfully differentiate the control and mutant clones for drought and salt stress resistance and the selection process used in this investigation clearly show that this type of selection in cauliflower is very useful to generate abiotic stress resistant genotypes like in other Brassica species [22,23].
The response of each genotype was different at each mannitol concentration. Some mutants such as K1, K9 and K21 showed about 70% RWC even in the presence
Table 1. Summary of the resistance to multi-stresses. K1- K21 are mutants, KC is control. Highly significant resistance (****) to low resistance (*), Drought resistance bases on % relative water content and salt resistance on greenness % as shown respectively in Figures 2(c) and 3(g).
of high 450 mM mannitol in the media with no symptoms of necrosis. Chandler and Thorpe [24] also reported similarly that mannitol up to 440 mM concentration was not toxic in the screening medium and all unselected replicate explants remained green and healthy. The present findings suggest the safe use of mannitol with B. oleraceae indicating it was a suitable stressor for induced drought stress resistance screening of cauliflower leaf discs. Many crop genotypes have been screened for drought resistance using mannitol induced drought e.g. in-vitro screening of Prunus accessions [25], legumes [26] and sugar beet [27].
Relative water content (RWC) is suggested as a sound index of water status in plant tissues [28]. In the present investigation the mechanisms leading to genotypes variation on the basis of RWC are unknown but one might be osmotic adjustment allowing uptake of water from the mannitol supplemented media. Osmotic adjustment in plants under stress has been reported in Brassica species [24,29], in sorghum [30] and in wheat [31]. Cell wall elasticity may also be the cause for variable RWC [32] and both osmotic adjustment and cell wall elasticity might have adaptive mechanisms to drought stress. The results clearly showed differentiation in mutants for salt resistance and this difference was very prominent after 7 days of salt treatments. All of the mutants showed higher resistance compared to the control clone. These results confirm the previous findings of Fuller et al. [15] who reported 80% damage for control population and signifycant degree of resistance with less than 50% damage for selected population. Kingsbury et al. [33] reported that sensitive species were more impaired by salt stress than resistant one due to osmotic shock.
Leaf discs of control clones lost their greenness (chlorophyll) resulting in a bleaching effect under salt stress. It might be suggested that leaf discs of control clone lost chlorophyll as a symptom of salt stress injury or that the plasmalemma is damaged and the cell contents leak out and the cell dies. Gibon et al. [34] hypothesised that the loss of chlorophyll was a result of stress induced sensecence and Huang and Redman [35] proposed the death of leaves due to the build up of Na in tissues. Different selection methods in Brassicas have been used for salt resistance by using different concentration of NaCl e.g. Jain et al. [36] performed in-vitro selection for salt tolerance in Brassica juncea using cotyledon explants, callus and cell suspension cultures in media supplemented with 0%, 0.25%, 0.50%, 0.75%, 1.0% and 1.25% (w/v) NaCl. Some genotypes found to exhibit salt resistance might have some osmo-protective or specific ion toxicity resistance mechanisms. Osmo-protective mechanism for salt resistance depends upon the genetic makeup of plants [37] and specific ion toxicities depend upon adaptation to sodium toxicity [38].
Fuller et al. [15] reported that cauliflower in-vivo having the damage of greenness of leaf discs less than 50% showing significant degree of resistance. Following this criteria at day 5 of NaCl treatment, the in-vivo mutants K1, K9, K11, K19, and K21 showed less than 50% loss of colour and therefore showed salt resistance, while others showed a colour change of 50% or more and were classified as moderate and sensitive to NaCl. Present findings could provide base for molecular investigation. One of the possible molecular mechanisms might be the over-expression of DREB/CBF genes family for increase in tolerance. The expression and quantification study of these genes family in correlation with these stresses resistance is recommended for future research on these mutants
5. Acknowledgments
The authors would like to thanks Angela Harrop (technical manger) and Sarah (lab technician) in the plant physiology Laboratory University of Plymouth (UK) for their help during this project. The first author would like to acknowledge the Higher Education Commission of Pakistan for providing full financial support for this project.
REFERENCES
- J. S. Boyer, “Plant Productivity and Environment,” Science, Vol. 218, No. 4571, 1982, pp. 443-448. doi:10.1126/science.218.4571.443
- E. A. Bray, “Genes Commonly Regulated by WaterDeficit Stress in Arabidopsis Thaliana,” Journal of Experimental Botany, Vol. 55, No. 407, 2004, pp. 2331- 2341. doi:10.1093/jxb/erh270
- V. Shubha and K. T. Akhilesh, “Emerging Trends in the Functional Genomics of the Abiotic Stress Response in Crop Plants,” Plant Biotechnology Journal, Vol. 5, No. 3, 2007, pp. 361-380.
- M. Shilpi and T. Narendra, “Cold, Salinity and Drought Stresses: An Overview,” Archives of Biochemistry and Biophysics, Vol. 444, No. 2, 2005, pp. 139-158.
- J. Zhang, N. Klueva, Z. Wang, R. Wu, T. David and H. Nguyen, “Genetic Engineering for Abiotic Stress Resistance in Crop Plants,” In Vitro Cellular and Developmental Biology—Plant, Vol. 36, No. 2, 2000, pp. 108-114.
- H. Brunner, “Radiation Induced Mutations for Plant Selection,” Plant Breeding Unit Joint FAO/IAEA Programme IAEA Laboratories, Seibersdorf, 1995.
- A. Charlotte, “Mutation Research: Problems, Results, and Perspectives,” Trowbridge, 1976.
- International Atomic Energy Agency, “Manual on Mutation Breeding,” Technical Report Series No. 119, 2nd Edition, Vienna, 1977.
- I. Negrutu, “In-Vitro Mutagenesis,” In: P. Dix, Ed., Plant Cell Line Selection, VCH Publishers, Cambridge, 1990.
- R. Mittler, “Abiotic Stress, the Field Environment and Stress Combination,” Trends in Plant Science, Vol. 11, No. 1, 2006, pp. 15-19. doi:10.1016/j.tplants.2005.11.002
- V. Babu and T. N. Henry, “Understanding Regulatory Networks and Engineering for Enhanced Drought Tolerance in Plants,” Current Opinion in Plant Biology, Vol. 9, No. 2, 2006, pp. 189-195. doi:10.1016/j.pbi.2006.01.019
- A. R. Kemble and H. T. MacPherson, “Liberation of Amino Acids in Perennial Rye Grass during Wilting,” Biochemical Journal, Vol. 58, No. 1, 1954, pp. 46-59.
- W. B. Christopher, “Cancer Preventive Properties of Varieties of Brassica oleracea: A Review,” The American Journal of Clinical Nutrition, Vol. 59, No. 5, 1994, pp. 166S- 170S.
- S. Tossaint, “History of Food,” Blackwell Publishing, Hoboken, 1994.
- M. P. Fuller, E. M. R. Metwali, M. H. Eed and A. J. Jellings, “Evaluation of Abiotic Stress Resistance in Mutated Populations of Cauliflower (Brassica oleracea var. botrytis),” Plant Cell, Tissue and Organ Culture, Vol. 86, No. 2, 2006, pp. 239-248. doi:10.1007/s11240-006-9112-4
- M. Kieffer, N. Simkins, M. P. Fuller and A. J. Jellings, “A Cost Effective Protocol for In-Vitro Mass Propagation of Cauliflower,” Plant Science, Vol. 160, No. 5, 2001, pp. 1015-1024. doi:10.1016/S0168-9452(01)00347-8
- M. P. Fuller and M. Eed, “The Development of Multiple Stress-Resistance Cauliflower Using Mutagenesis in Conjunction with a Micro-Shoot Tissue Culture Technique,” Acta Horticulturae, Vol. 618, 2003, pp. 71-76.
- M. Kieffer, M. P. Fuller and A. J. Jellings, “Rapid Mass Production of Cauliflower Propagule from Fractionated and Graded Curd,” Plant Science, Vol. 107, No. 2, 1995, pp. 229-235. doi:10.1016/0168-9452(95)04110-G
- T. Murashige and K. F. Skoog, “Revised Medium for Rapid Growth and Bio Assays with Tobacco Tissue Cultures,” Physiologia Plantarum, Vol. 15, No. 3, 1962, pp. 473-497. doi:10.1111/j.1399-3054.1962.tb08052.x
- L. S. Bates, R. P. Waldren and I. O. Teare, “Rapid Determination of Free Proline for Water Stress Studies,” Plant Soil, Vol. 39, No. 1, 1973, pp. 205-207. doi:10.1007/BF00018060
- R. A. Fisher and Y. Frank, “Statistical Tables for Biological, Agricultural and Medical Research,” 3rd Edition, W. C. Edinburgh Tweeddale Court, London, 1948.
- M. Ashraf and P. Harris, “Potential Biochemical Indicators of Salinity Tolerance in Plants,” Plant Science, Vol. 166, No. 1, 2004, pp. 3-16. doi:10.1016/j.plantsci.2003.10.024
- M. Ashraf and T. McNeilly, “Salinity Tolerence in Brassica Oilseeds,” Critical Reviews in Plant Sciences, Vol. 23, No. 2, 2004, pp. 157-174. doi:10.1080/07352680490433286
- S. F. Chandler and T. A. Thorpe, “Characterization of Growth, Water Relations, and Proline Accumulation in Sodium Sulfate Tolerant Callus of Brassica napus L. cv Westar (Canola),” Plant Physiology, Vol. 84, No. 1, 1987, pp. 106-111. doi:10.1104/pp.84.1.106
- G. Rajasheker, D. Palmquist and C. A. Ledbetter, “InVitro Screening Procedure for Osmotic Tolerance in Prunus,” Plant Cell, Tissue and Organ Culture, Vol. 41, No. 2, 1995, pp. 159-164.
- S. Grezesiak, W. Filek, D. Skrudilk and B. Niziol, “Screening for Drought Tolerance: Evaluation of Seeds Germination and Seedling Growth for Drought Resistance in Legume Plants,” Journal of Agronomy and Crop Science, Vol. 177, No. 4, 1996, pp. 245-252. doi:10.1111/j.1439-037X.1996.tb00242.x
- S. Y. Sadighian and N. Yavari, “Effect of Water Stress on Germination and Early Seedling Growth in Sugar Beet,” Journal of Agronomy and Crop Science, Vol. 190, No. 2, 2004, pp. 138-144. doi:10.1111/j.1439-037X.2004.00087.x
- J. C. Diaz-Perez, K. A. Shackel and E. G. Sutter, “Relative Water Content and Water Potential of Tissue-Cultured Apple Shoots under Water Deficits,” Journal of Experimental Botany, Vol. 46, No. 282, 1995, pp. 111- 118. doi:10.1093/jxb/46.1.111
- A. Kumar, P. Singh, D. P. Singh, H. Sigh and H. C. Sharma, “Differences in Osmo-Regulation in Brassica Species,” Annals of Botany, Vol. 54, No. 4, 1984, pp. 537- 541.
- A. Blum and C. Y. Sallivan, “The Comparative Drought Resistance of Landraces of Sorghum and Miller from Dry and Humid Regions,” Annals of Botany, Vol. 57, No. 6, 1986, pp. 835-846.
- R. A. Moinuddin, K. D. Fischer and M. P. Renolds, “Osmotic Adjustment in Wheat in Relation to Grain Yeild under Water Deficit Environments,” Agronomy Journal, Vol. 97, 2005, pp. 1062-1071.
- A. Kumar and J. Elston, “Genotypic Differences in Leaf Water Relations between Brassica juncea and Brassica napus,” Annals of Botany, Vol. 70, No. 1, 1992, pp. 3-9.
- R. V. Kingsburry, E. Epstein and R. W. Pearcy, “Physiological Responses to Salinity in Selected Lines of Wheat,” Plant Physiology, Vol. 74, No. 2, 1984, pp. 417-423. doi:10.1104/pp.74.2.417
- Y. Gibon, R. Sulpice and F. Larther, “Proline Accumulation in Canola Leaf Discs Subjected to Osmotic Stress Is Related to Loss of Chlorophylls and to Decrease of Mitrochondria Activity,” Physiologia Plantarum, Vol. 110, No. 4, 2000, pp. 469-476. doi:10.1111/j.1399-3054.2000.1100407.x
- J. Huang and R. Redmann, “Responses of Growth, Morphology, and Anatomy to Salinity and Calcium Supply in Cultivated and Wild Barley,” Canadian Journal of Botany, Vol. 73, No. 12, 1995, pp. 1859-1866. doi:10.1139/b95-198
- R. K. Jain and S. Jain, “In-Vitro Selection for Salt Tolerence in Brassica juncea L. Using Cotyledon Explants, Callus and Cell Suspension Cultures,” Annals of Botany, Vol. 67, No. 6, 1991, pp. 517-519.
- R. E. A. Moghaieb, H. Saneoka and K. Fujita, “Effect of Salinity on Osmotic Adjustment, Glycinbetaine Accumulation and the Betaine Aldehyde Hydrogenase Gene Expression in Two Halophytic Plants, Salicornia europaea and Suaeda maritime,” Plant Science, Vol. 166, No. 5, 2004, pp. 1345-1349. doi:10.1016/j.plantsci.2004.01.016
- R. W. Kingsburry and E. Epstein, “Salt Sensitivity in Wheat, a Case for Specific Ion Toxicity,” Plant Physiology, Vol. 80, No. 3, 1986, pp. 651-654. doi:10.1104/pp.80.3.651
NOTES
*Corresponding author.