American Journal of Plant Sciences
Vol.3 No.8(2012), Article ID:22171,4 pages DOI:10.4236/ajps.2012.38126
Comparison of the S-, Nor P-Deprivations’ Impacts on Stomatal Conductance, Transpiration and Photosynthetic Rate of Young Maize Leaves
![]()
Plant Physiology Laboratory, Division of Plant Biology, Department of Agricultural Biotechnology, Agricultural University of Athens, Athens, Greece.
Email: bouranis@aua.gr
Received June 15th, 2012; revised July 12th, 2012; accepted July 20th, 2012
Keywords: S-Deprivation; N-Deprivation; P-Deprivation; Hydroponics; Zea Mays; Stomatal Conductance; Transpiration Rate; Photosynthetic Rate; Response Ratios; Fluctuation Analysis
ABSTRACT
Seven-day-old maize (Zea mays) plants were grown hydroponically for ten days in deprived nutrient solutions against the corresponding control grown under full nutrition; the effects of S-, Nor P-deprivation on laminas’ mean stomatal conductance (gs), transpiration rate (E) and photosynthetic rate (A) were monitored, along with the impact on the laminas’ total dry mass (DM), water amount (W), length and surface area (Sa). Furthermore, a time series analysis of each parameter’s response ratios (Rr), i.e. the treatment’s value divided by the corresponding control’s one, was performed. Under S-deprivation, the Rr of laminas’ mean gs, E, and A presented oscillations within a ±15% fluctuation zone, notably the “control” zone, whilst those of laminas’ total DM, water amount, surface area, and length included oscillation during the first days and deviation later on, presenting deviation during d10. Under the N-deprivation conditions all Rr time courses except the A one, included early deviations from the control zone without recovering. The deviation from the control zone appeared at d4. Under P-deprivation, all Rr time courses represented oscillations within the control zone. P-deprivation’s patterns resembled those of S-deprivation. Compared to the one of the S-deprivation, the P-one’s oscillations took place within a broader zone. Linear relationships among the various Rr patterns were found between gs-E, gs-A, E-A, DM-W and DM-Sa. In conclusion, the impact of P-deprivation appeared in an early stage and included an alleviation action, the one of N-deprivation appeared early with no alleviation action, whilst that of S-deprivation appeared later, being rather weaker when compared to the impact of the P-deprivation’s impact.
1. Introduction
Nitrogen (N), sulfur (S) and phosphorus (P) are constituents of important primary metabolites; therefore, deficiency in any one of these elements affects plant metabolism. Within certain limits of nutrient deprivation, plants are able to adjust their metabolism to the current nutrient supply. A scheme combining current information regarding the effects of S, N, and P on metabolism has been developed by Amtmann and Armengaud (2009) [1]. It has been observed that S-, N-, or P-deficiencies result in major reductions of root hydraulic conductivity, which, in turn, may lead to lower stomatal conductance (gs). Although transported, metabolized and utilized in different ways, all the aforementioned nutrients, under deficiency conditions, produce similar effects on gs and hydraulic conductivity. Clarkson et al. (2000) [2] have discussed in depth the question whether stomatal closure and diminished hydraulic conductivity are the primary effects of nutrient-stress’s response.
By definition, gs is the measure of the passage’s rate of carbon dioxide (CO2) entering, or water vapour existing through the stomata of a leaf. The exchange of gases is regulated by opening and closing the stomatal pore. Effects of nutrient deficiencies on plant water relations, stomatal behaviour or hydraulic performance have been described for several plant species, mostly with regard to N and P nutrition [e.g. 3-5]. Nitrate deficiency can induce stomatal closure and cause reductions in plant’s leaf growth rates [6]. This environmental cue generates a signal (or signals) within plants carrying information about soil nutrient levels from the roots to the stomata and growing leaves in the shoot [7]. The stomatal closure procedure includes abscisic acid (ABA) action. The effects of S-, N-, or P-deficiency on ABA in maize plant parts in various developmental stages have been reported [8]. The degree of stomatal closure regulates both the transpiration (E) and the photosynthetic (A) rates. Stomatal transpiration accounts for most of the plant’s water loss by a plant; and among other functions it enables mass flow of mineral nutrients and water from the roots to the shoots. In Marschner’s Mineral Nutrition of Higher Plants (2011, p. 101) [9], the decrease of A in plants via hydraulic or hormonal signals is stressed out as another example of an indirect mode of nutrients’ action on photosynthesis; the signals reduce gs and thus the leaf’s gas exchange. Transpiration can be regulated by root hydraulic conductance, which in turn is affected by nutrients through control of aquaporins, for example by nitrate, P and S. Nutrient deficiency can regulate gs also via alteration of supply of guard cells with rootor leaf-sourced hormones such as ABA and cytokinines [9].
This work aimed at comparatively monitoring the effects of S-, Nor P-deprivation on gs, E and A of young maize laminas. To this end, seven-day-old maize plants were grown hydroponically for ten days in deprived nutrient solutions against the corresponding controls grown under full nutrition. The laminas’ total dry mass (DM), water amount (W), length and surface area (Sa) were also monitored. The time courses of the aforementioned physiological and morphometric parameters under each deprivation, as well as the patterns of the statistically significant deviations of the treatment values from the control ones are discussed. A time series analysis of each parameter’s response ratios (Rr), i.e. the treatment value divided by the corresponding control one, was performed. Furthermore, the fluctuation patterns of each parameter under each deprivation were compared and discussed.
2. Materials and Methods
2.1. Plant Material and Hydroponics Set Up
Maize (Zea mays “Cisko”, Syngenta Hellas) seeds were kept on wet filter paper, in the dark (28˚C, relative humidity 76%) until germination. Four days later, the most uniform of those plants were selected and maintained in a hydroponic batch culture for 3 days in well-aerated distilled H2O. A controlled environment of 170 μmol photons m−2·s−1 PPFD and a 14-h light photoperiod with day/night growth conditions at shoot base 28/23˚C and RH 36/40% was used. Complete nutrient solution (control) contained 5 mM ΚΝΟ3, 1 mM KH2PO4, 2 mM Mg(NO3)2, 2.5 mM CaSO4, 1 mM MgSO4, 0.07 mM EDTAFeNa, 4 mM Ca(NO3)2, 0.9 μM ZnCl2, 30 μM H3BO3, 0.9 μM CuCl2, 0.5 μM MoO3 and 20 μM MnCl2. S-deprived nutrient solution (-S) contained 5 mM ΚΝΟ3, 1 mM KH2PO4, 2 mM Mg(NO3)2, 0.07 mM EDTAFeNa, 4 mM Ca(NO3)2, 0.86 mM CaCl2, 0.9 μM ZnCl2, 30 μM H3BO3, 0.9 μM CuCl2, 0.5 μM MoO3 and 20 μM MnCl2. N-deprived nutrient solution (-N) contained 2 mM K2HPO4, 3 mM CaSO4, 1.3 mM CaCl2, 2 mM MgSO4, 0.07 mM EDTAFeNa, 0.9 μM ZnCl2, 30 μM H3BO3, 0.9 μM CuCl2, 0.5 μM MoO3 and 20 μM MnCl2. P-deprived nutrient solution (-P) contained 5 mM ΚΝΟ3, 2 mM Mg(NO3)2, 1.5 mM CaSO4, 1 mM MgSO4, 0.07 mM EDTAFeNa, 4 mM Ca(NO3)2, 0.9 μM ZnCl2, 30 μM H3BO3, 0.9 μM CuCl2, 0.5 μM MoO3 and 20 μM MnCl2. At d7 and for the next 10 days, four hydroponic batch cultures were run by using the respective nutrient solutions. All nutrient solutions were constantly aerated and replaced every 3 days (Table 1).
2.2. Measurements
Stomatal conductance (gs, mol H2O m−2·s−1), transpiration rate (E, mmol H2O m−2·s−1) and photosynthetic rate (A, μmol CO2 m−2·s−1) were measured by means of the LCPro+ (ADC BioScientific Ltd.). Measurements were conducted at 200 μmol photons m−2·s−1 (PAR) under the same climatic conditions as above and at 370 ppm CO2. From each lamina three measurements were averaged and used for data analysis. A photograph of each of the plant’s laminas was taken and by means of the Image-J softwear the lamina’s length and surface area were calculated. Fresh weight of every plant’s laminas per each experimental day was recorded, the plant material was oven-dried at 80˚C, and the dry weight was recorded.
2.3. Statistical Analysis
Each hydroponic treatment was repeated three times. Two plants were measured per treatment per day; thus, for each leaf position, eighteen measurements were taken in total. The comparisons between the corresponding -S, -N, or -P values and the control ones were duly submitted to t-test variance analysis with two tailed distribution and two-sample equal variance, at p ≤ 5%. In those cases, where the differences between means of C and the treatment values were statistically significant, the percentage of the relative change was calculated (Table 2). A trend line of second-order moving average type was applied to the data within each time course, in order to smooth the fluctuations during the treatment in each case (i.e., for each day the average between the current day and the previous one was calculated; after that initial step, the averages were connected by a line).
A time series analysis of each parameter’s “response ratios” fluctuations (Rr, i.e. the treatment value divided by the corresponding control one,) was performed. In this Rr fluctuation analysis the control is represented by the straight line y = 1; the time courses of the examined Rr
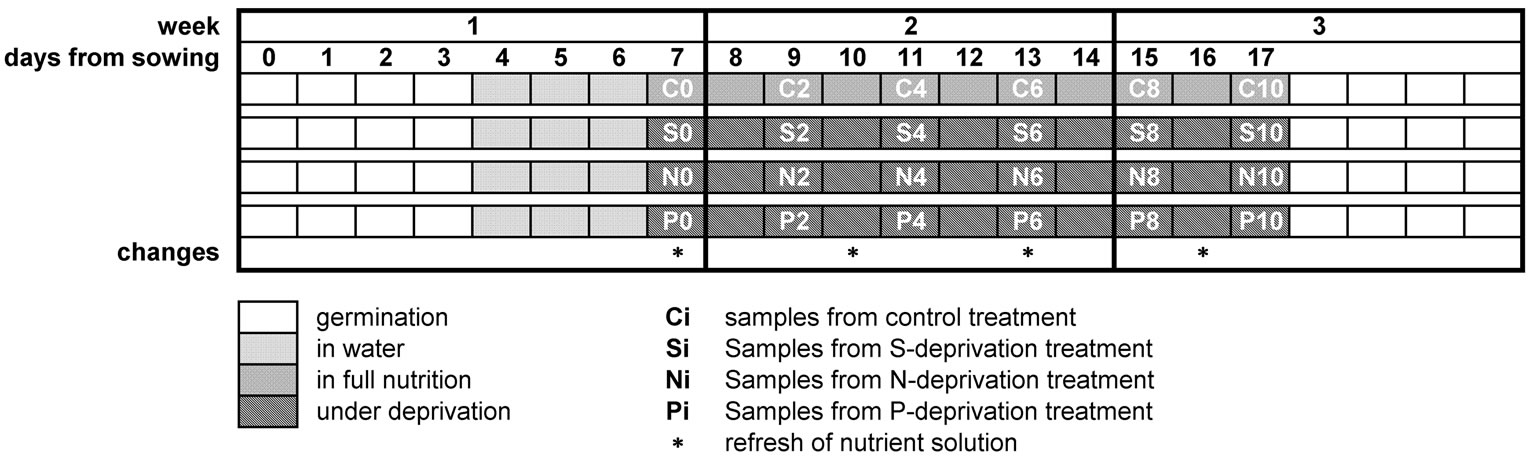
Table 1. Time-table of the experimental schedule.
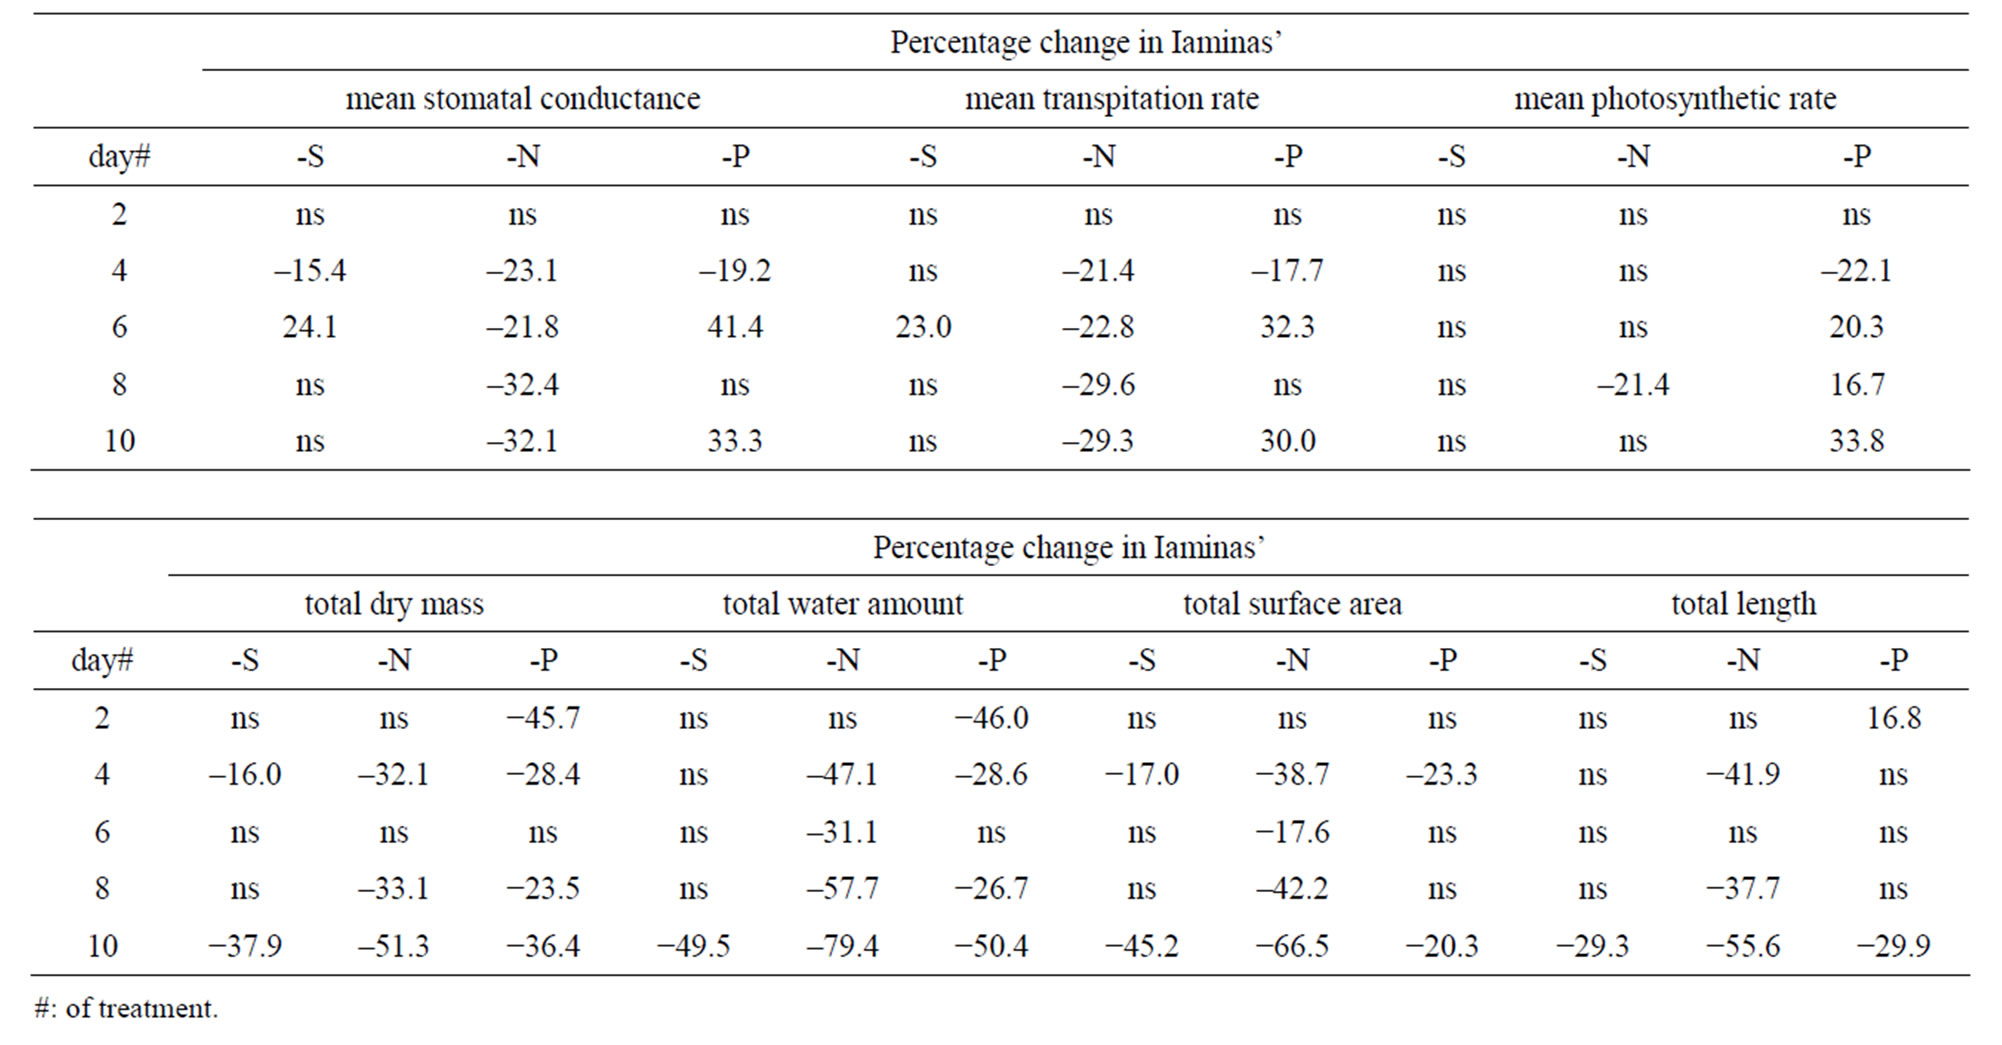
Table 2. Time course of the mean values’ percentage changes per treatment and per day in laminas’ mean stomatal conductance, transpiration rate, photosynthetic rate, along with the corresponding total dry mass, water amount, surface area and length, relative to control ones; “ns” indicates no statistically significant mean values.
were analyzed according to their fluctuation around value 1.0 (i.e., the control value). The points outside the range 0.85 - 1.15 indicate the existence of statistically significant fluctuations; this range represents the “control zone”.
3. Results
3.1. Effects of Each Deprivation on Laminas Stomatal Conductance, Transpiration Rate and Photosynthetic Rate
Stomatal conductance—In plants under full nutrition, gs fluctuated around 0.08 mol·m−2·s−1. S-deprivation caused a 15.4% decrease in gs at d4 followed by a 24.1% increase at d6 (Table 2, Figure 1(a)). Likewise, P-deprivation caused a 19.2% decrease in gs at d4 followed by a 41.4 increase at d6 (Figure 1(g)). In contrast, N-deprivation progressively decreased gs by 23.1% at d4 and by 32.1% at d8 (Figure 1(d)). The time course of Rr values showed a fluctuation in the gs values during the S- (Figure 2(a)) or P-deprivation (Figure 2(g)). In both deprivations the inflection point took place between d4 and d6. In P-deprived plants after d6, the Rr values fluctuated above the control zone, which was not the case for Sdeprived plants.
Transpiration rate—S-deprivation caused a 23.0% increase at d6 (Figure 1(b)). P-deprivation caused a 17.7% decrease in E at d4 followed by a 32.3 increase at d6 (Figure 1(h)). N-deprivation progressively decreased E by 21.4% at d4 and by 29.3% at d8 (Figure 1(e)). The time course of the corresponding Rr values indicated a definite fluctuation in the E values during the S- (Figure 2(b)) or P-deprivation (Figure 2(h)). In both deprivations the inflection point occured between d4 and d6. In all three deprivations the Rr fluctuations were similar to
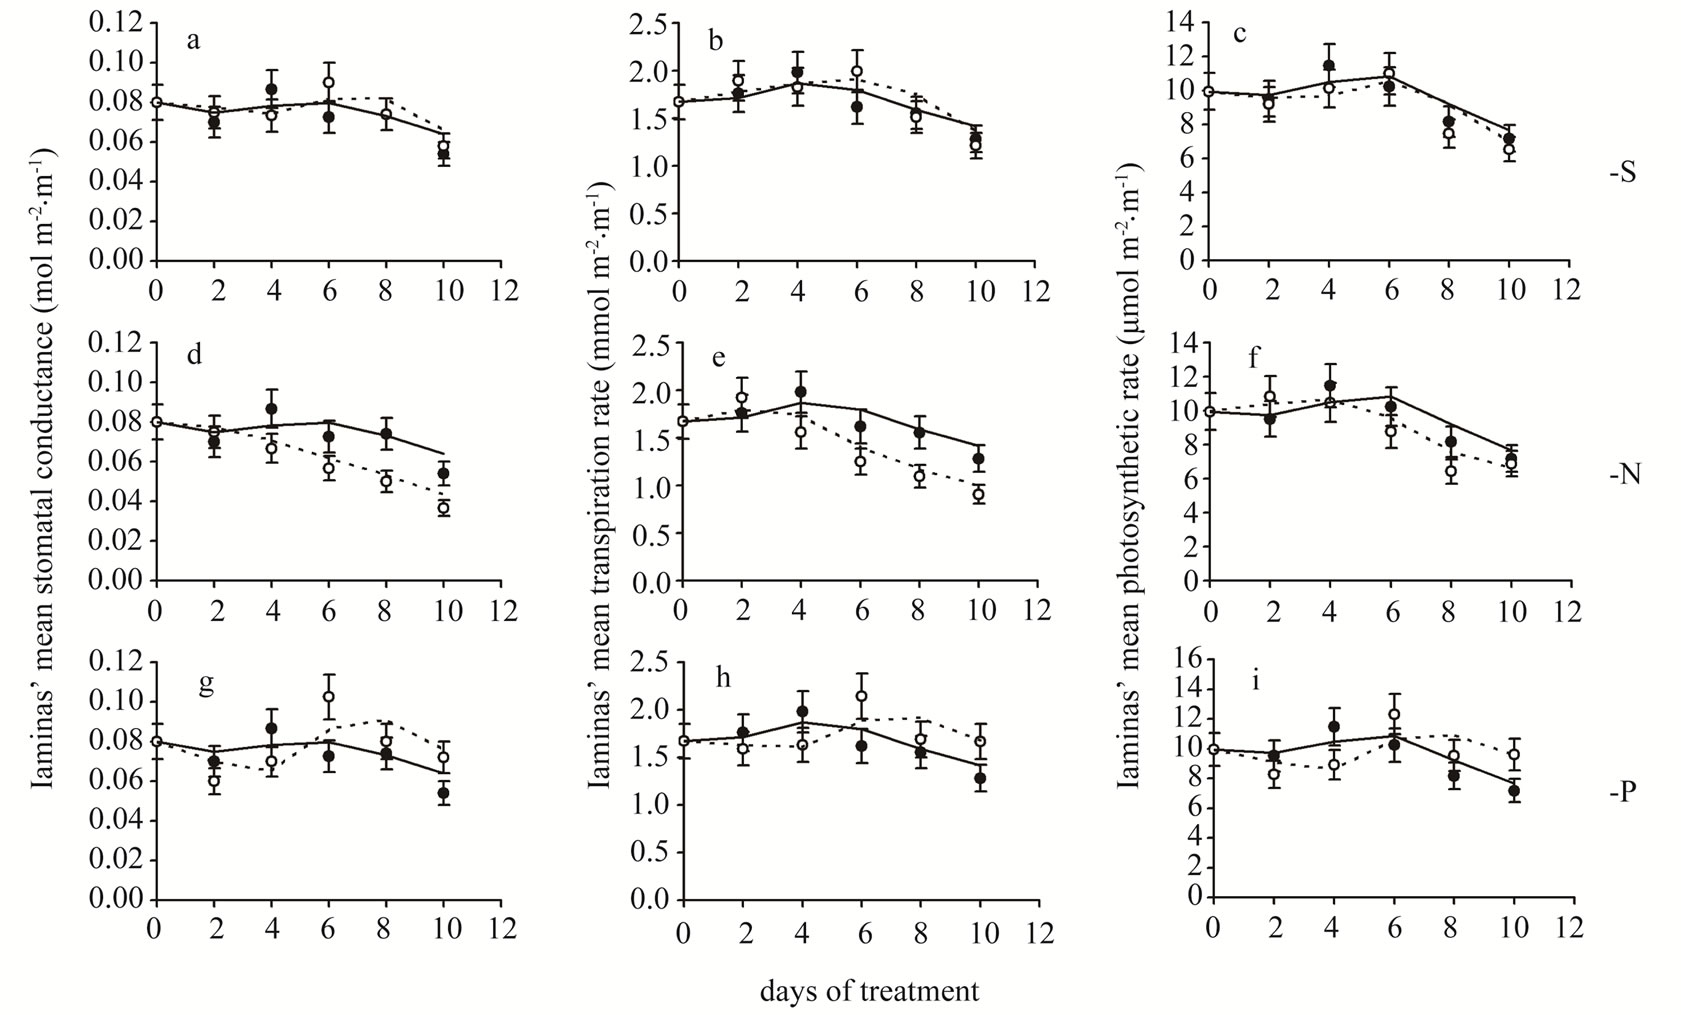
Figure 1. Time course of stomatal conductance (a,d,g), transpiration rate (b,e,h) and photosynthetic rate (c,f,i) mean values of all leaf laminas. Closed circles and solid lines: plants under full nutrition, open circles and dashed lines: plants in S-, or N-, or P-deprived nutrient solutions. Error bars represent SE. Day 0: Seven-day-old maize plants.
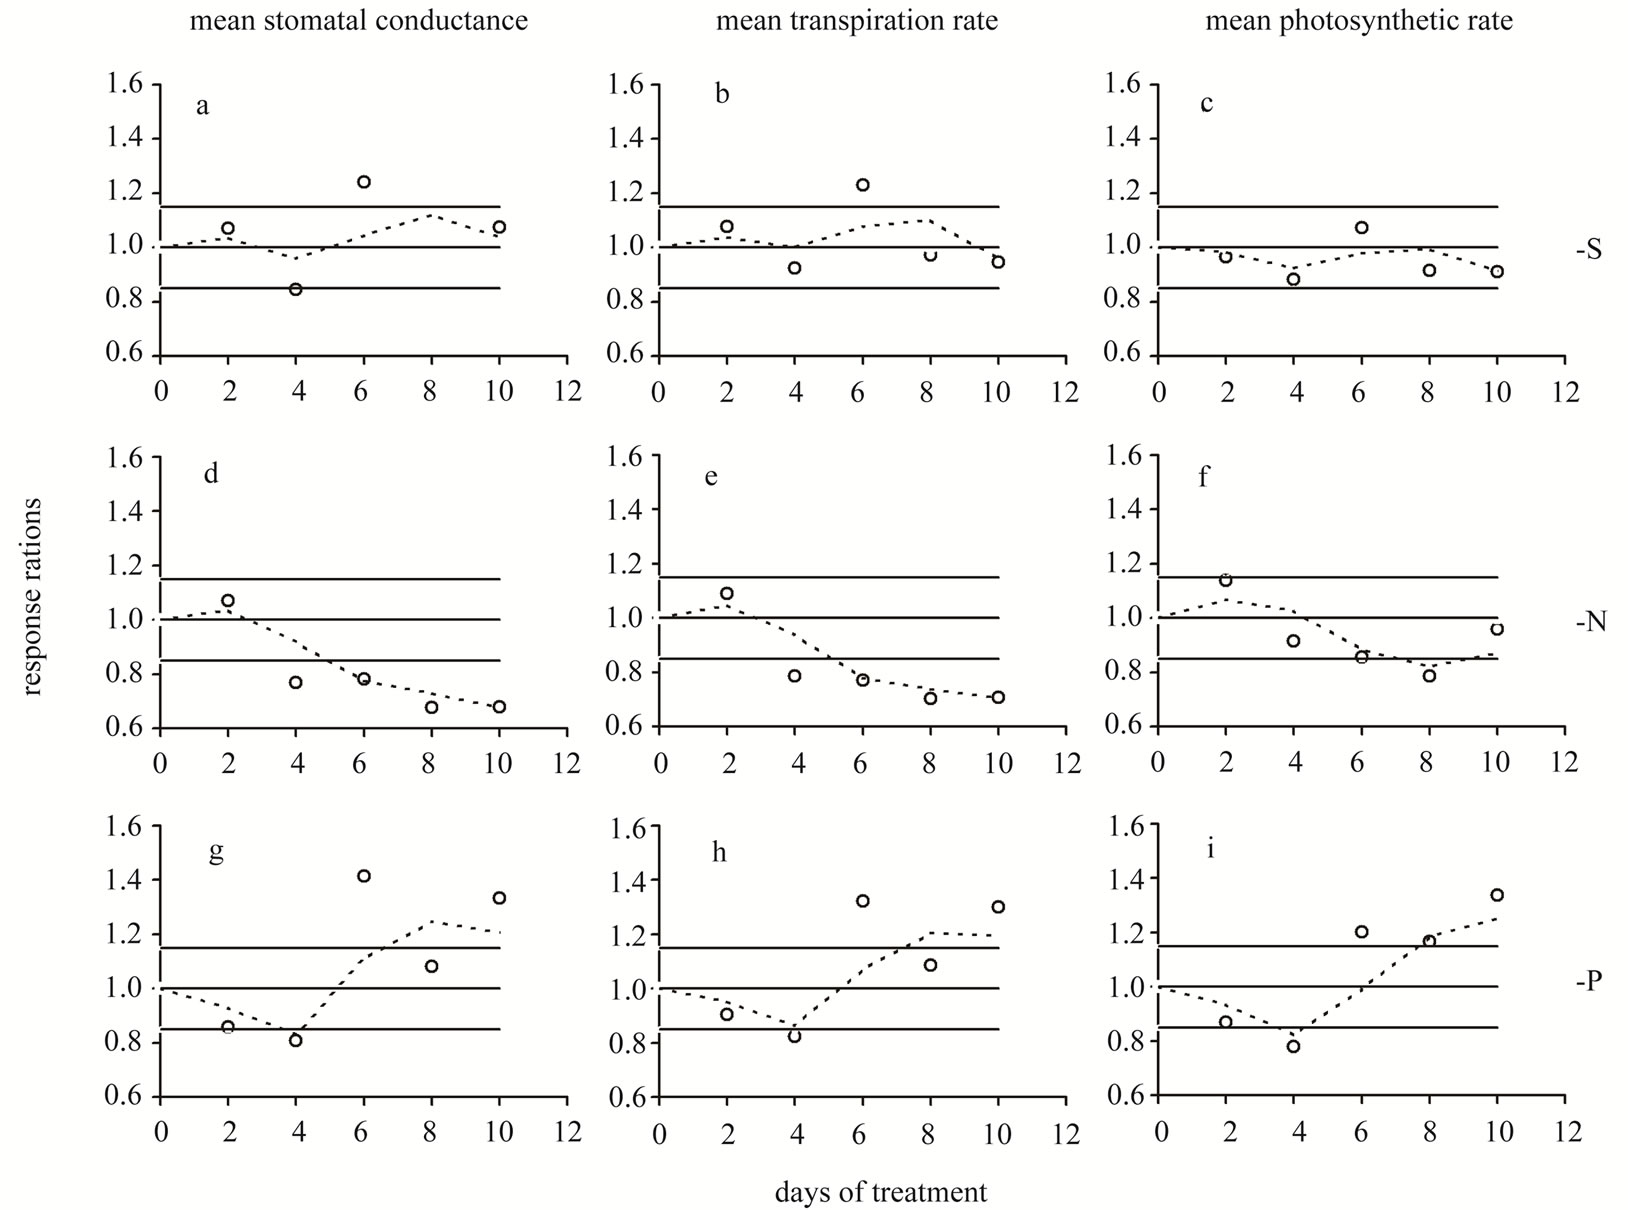
Figure 2. Time course of the response ratio (i.e. the ratio of the -S or -N or -P value divided by the corresponding control value within each experimental day) for stomatal conductance (a,d,g), transpiration rate (b,e,h) and photosynthetic rate (c,f,i) mean values of all leaf laminas. Οpen circles and dashed lines: plants in S-, or N-, or P-deprived nutrient solutions relatively to the control. Day 0: Seven-day-old maize plants. Points outside the range 0.85 - 1.15 indicate statistically significant fluctuations; this range represents the “control zone”.
those of gs.
Photosynthetic rate—S-deprivation caused no substantial changes of A (Figure 1(c)). P-deprivation caused a 22.1% decrease in A at d4 followed by significant increases thereafter (20.3%→33.8%) (Figure 1(i)). N-deprivation presented a decreased A by 21.4% only at d8 (Figure 1(f)). The corresponding Rr time-course indicated a fluctuation in the A values during the S- (Figure 2(c)), N-deprivation (Figure 2(f)) or P-deprivation (Figure 2(i)). In Sand P-deprivations the inflection point occured between d4 and d6, whilst in N-deprivation it appeared after d8; this was rather surprising and made a strike difference compared with Figures 2(d) and (e). Other than that, in all three deprivations the Rr fluctuations were similar those of gs.
3.2. The Corresponding Effects of Each Deprivation on the Laminas Total Mass, Water Amount, Surface Area and Length
Dry mass (DM)—Under S-deprivation dry mass accumulation was found to be reduced by 16.0% at d4 and by 37.9% at d10 (Table 2, Figure 3(a)). N-deprivation resulted in a decrease in DM accumulation by 32.1% at d4 and after d6 (33.1% and 51.3% at d8 and d10 respectively, Figure 3(e)). Under P-deprivation, DM was 45.7% and 28.4% less than control at d2 and d4, as in control at d6 and below control thereafter (23.5% and 36.4% at d8 and d10 respectively, Figure 3(i)). It must be stressed out that P-deprivation (Figure 4(i)) presented significant delays in DM accumulation at d2, probably indicating an alleviation effort-process of the negative impact; N-deprivation (Figure 4(e)) and S-deprivation (Figure 4(a)) presented such negative impact at d4 immediately followed by a temporary alleviation.
Water amount—Under S-deprivation water accumulation was unaffected for the first 8 days; at d10 it was 49.5% less than control (Figure 3(b)). N-deprivation resulted in a decrease in water accumulation after d2 (47.1%→79.4% less than control up to d10, Figure 3(f)). Under P-deprivation, the water amount was less than control in all days but d6 (during d10 it was 50.4% less than control, Figure 3(j)). Each deprivation’s Rr timecourse of resembled remarkably the DM one.
Surface area—Under S-deprivation, the total surface area was found to be reduced by 17.0% at d4 and by 45.2% at d10 (Figure 3(c)). In a similar fashion, P-deprivation reduced the total surface area during d4 (23.3%) and d10 (20.3%, Figure 3(k)). On the contrary, N-deprivation resulted in a reduced total surface area from d4 onwards (38.7%→66.5% less than control up to d10, Figure 3(g)). The Rr time-course of each deprivation resembled that of DM, with an exception at d2 under P-deprivation, where the Rr value lied within the control zone (Figure 4(k)).
Length—Under S-deprivation total lamina length remained unaffected for the first 8 days; at d10 it was 29.3% less than control (Figure 3(d)). N-deprivation resulted in a decrease in water accumulation after d2 (at
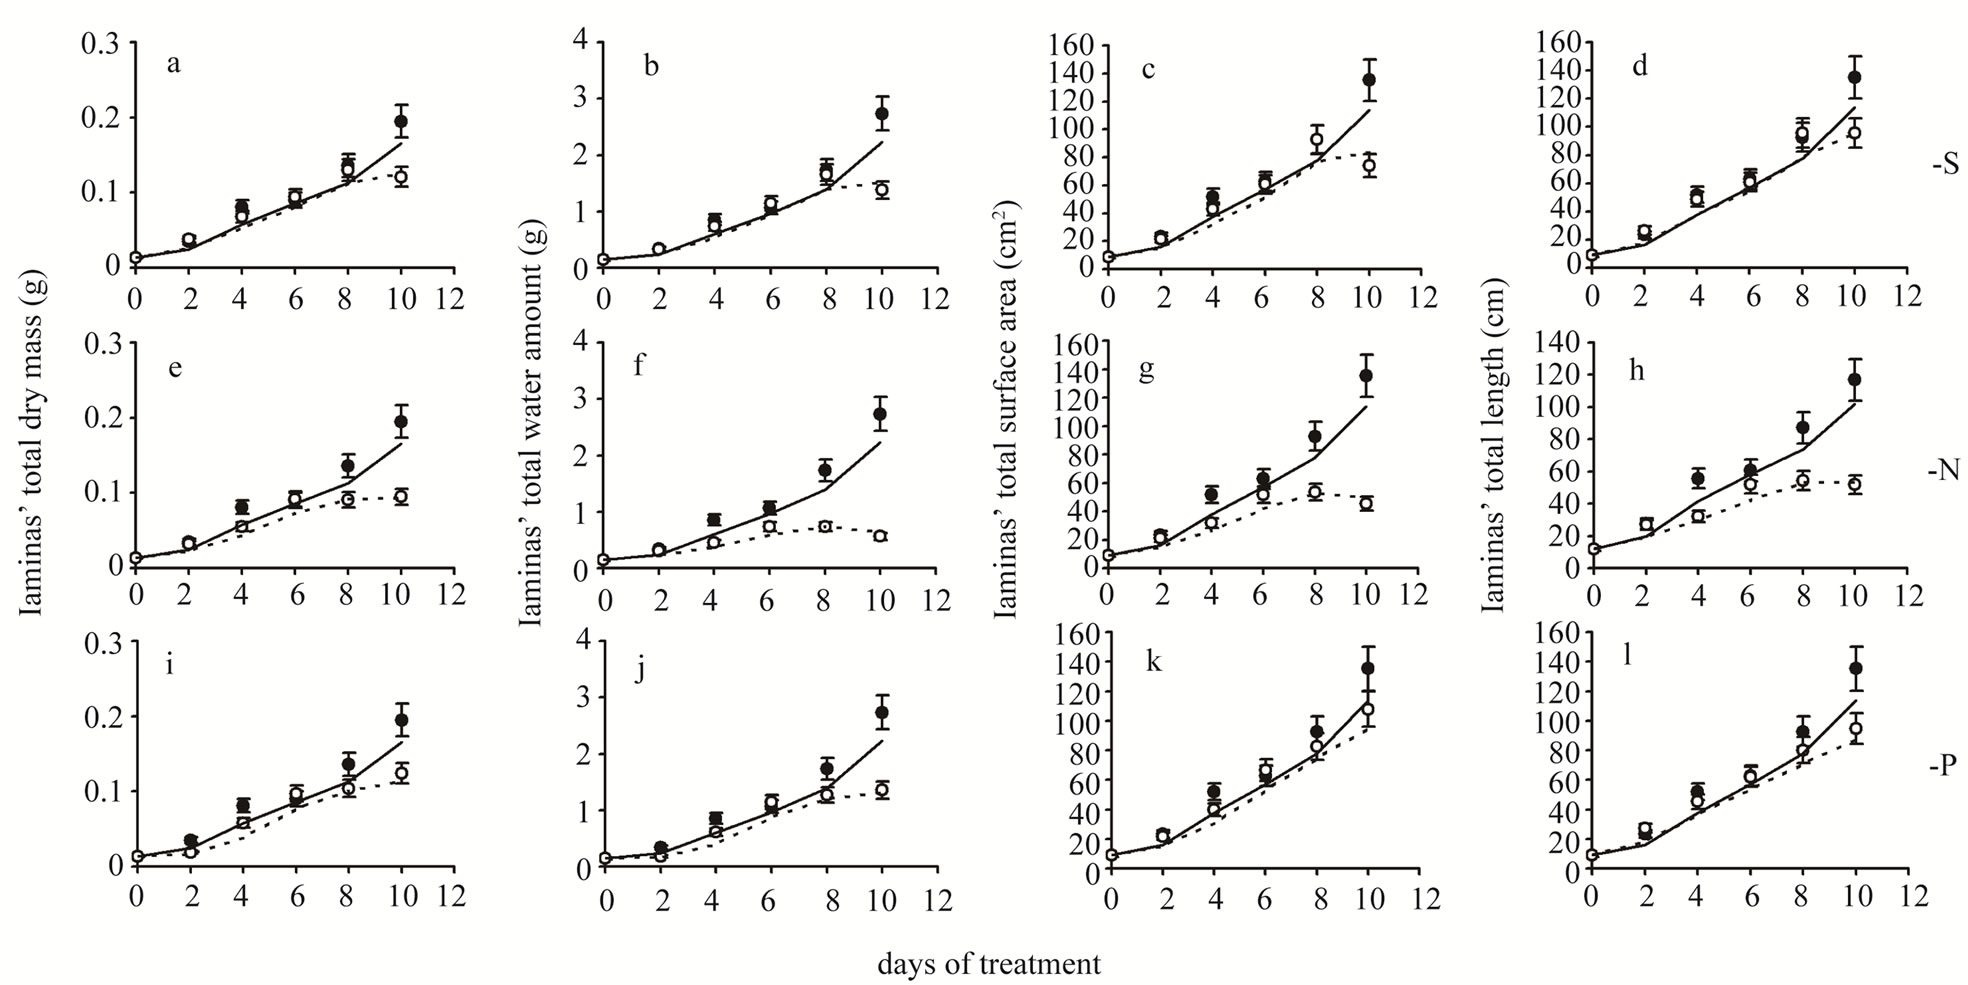
Figure 3. Time course of total dry mass (a,e,i), water amount (b,f,j), surface area (c,g,k) and length (d,h,l) values of all leaf laminas. Closed circles and solid lines: plants under full nutrition, open circles and dashed lines: plants in S-, or N-, or P-deprived nutrient solutions. Error bars represent SE. Day 0: Seven-day-old maize plants.
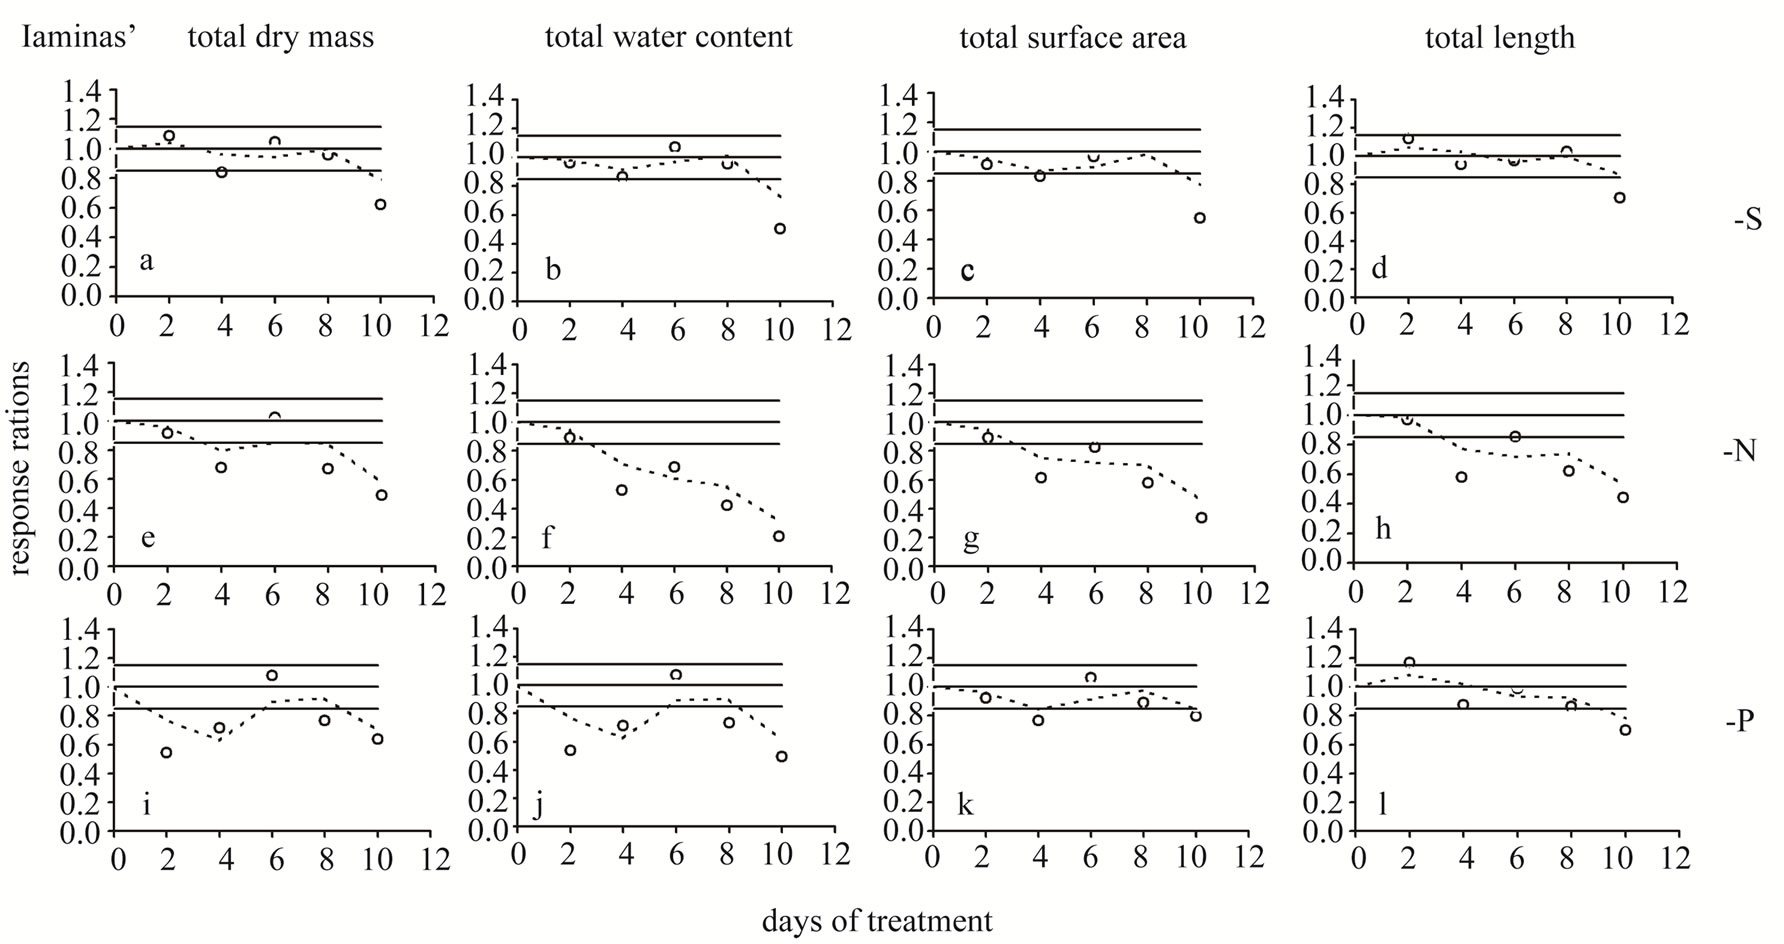
Figure 4. Time course of the response ratio (i.e. the ratio of the -S or -N or -P value divided by the corresponding control value within each experimental day) for total dry mass (a,e,i), water amount (b,f,j), surface area (c,g,k) and length (d,h,l) values of all leaf laminas. Open circles and dashed lines: plants in S-, or N-, or P-deprived nutrient solutions compared to the control. Day 0: Seven-day-old maize plants. The points outside the range 0.85 - 1.15 indicate statistically significant fluctuations; this range represents the “control zone”.
d10 it was 55.6% lower than control, Figure 3(h)). Under P-deprivation, total length was found to be 16.8% higher than control at d2. From then onwards, it remained statistically unchanged up to d8; at d10 it was 29.9% less than control, Figure 3(l)). The Rr time-course of each deprivation was similar to that of total surface area, with an exception at d2 under Sand P-deprivation where the Rr value lied at the upper limit of the control zone (Figures 4(d) and (l)).
4. Discussion
Strong interactions are ever existent between the plant’s nutrient and water status. The integration of these interactions appears as a major aspect of plants’ response to the deficiencies. According to Maurel et al. (2008) [10], deprivation of N, P, or S in plants results, after a few days, in a significant inhibition of water transport. The in depth analysis of each deprivation’s impact on the laminas’ total DM, P-deprivation (Figure 4(i)) exhibited a negative impact on DM accumulation at d2. Furthermore, Sand N-deprivation presented a similar negative impact at d4. Comparing the time courses of dry mass together with the corresponding water amount in all three deprivations, two points are clearly apparent: 1) a remarkably similar response progress and 2) the -N impact appearance in an earlier stage being also stronger than the -S and -P ones (Figure 3). Although plants were grown in hydroponics, a condition which provided high water availability from the growth medium, the laminas’ water amount significantly declined at certain time points during each deprivation’s time-course.
In the time courses of the examined Rr, it is highly notable that although not statistically significant, the lied within the control zone values, tended to present rather synchronized positive and negative fluctuations. Taking this behaviour into account, we further moved on to the analysis of the Rr fluctuations. From the overview of Figures 2 and 4 it derives that either the time course oscillates, thus returning to this zone (type-1, for example see Figure 4(a)) or the time course deviates for the control zone without recovering (type-2, as for example in Figure 4(f)). A mixed type including oscillation during the first days and deviation later on (type-3, as for example in Figure 4(b)) also appears. Under S-deprivation, the response ratios of laminas’ mean gs (Figure 2(a)), E (Figure 2(b)), and A (Figure 2(c)) followed type-1, whilst those of laminas’ total DM (Figure 4(a)), water amount (Figure 4(b)), surface area (Figure 4(c)), and length (Figure 4(d)) followed type-3 exhibiting deviation during d10. Under the N-deprivation all response ratios’ time courses but the A ones (Figure 2(f)) presented the type-2 response. The deviation from the control zone appeared at d4. Under P-deprivation, all response ratios’ time courses presented a type-1 behaviour. An interesting observation in this deprivation is that compared to the -S one, the oscillations take place within a broader zone. P-deprivation’s patterns resembled the
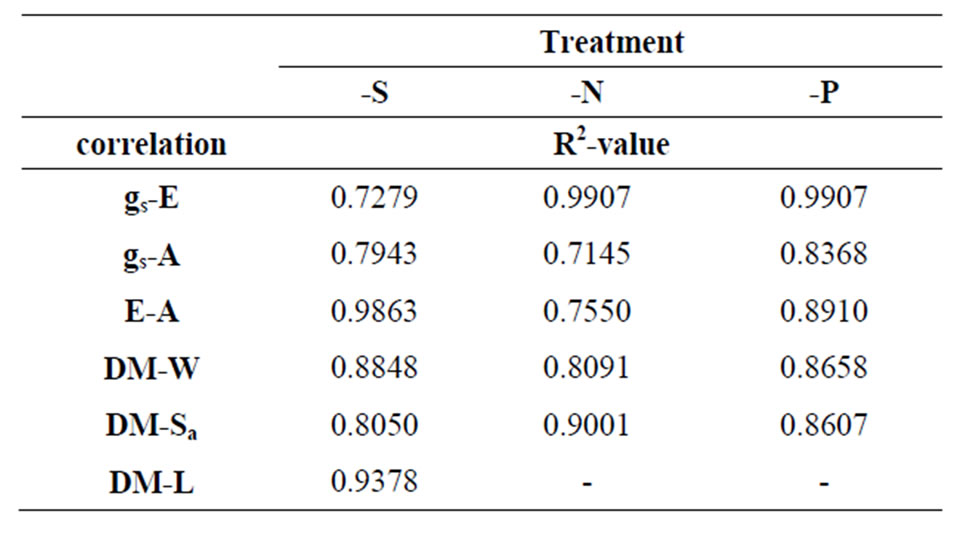
Table 3. The pairs of parameters, the Rr of which is correlated in a linear fashion. The dash indicates poor linear relationship.
patterns of S-deprivation.
Photosynthesis and transpiration are both physiologically complex processes. Plants are thought to optimize water use efficiency by adjusting the rate of photosynthesis in relation to the rate of transpiration [11]. This is achieved through tight stomatal control of water loss in most terrestrial plants as well as other traits which in turn reduce water consumption, e.g. C4 photosynthesis as in the case of maize. Nutrient regulation of transpiration may function through the concerted regulation of: 1) root hydraulic conductivity through control of aquaporins by nitrate; 2) shoot stomatal conductance gs through NO production and 3) pH and phytohormone regulation of gs [12]. In order to conserve water, nutrients and carbohydrates, necessary for survival, plants respond to stresses by short term (i.e. closing stomata) and long term acclimation (i.e. reducing leaf area). When nitrate supply is limited (regardless of soil water availability), the stomata close, the leaves grow on a slower pace, root growth is maintained, and is often characterized by greater lateral root proliferation. All of these responses are common symptoms of water stress [13]. There is much evidence that responses to N-deprivation are governed by fast root-to-shoot or shoot-to-root chemical signals. ABA in low nitrate-grown barley was solely increased in the xylem and not in the leaves [14]. Low nitrate availability may modulate responses in the shoot via the sensitization of stomatal/leaf growth receptors to ABA. Radin et al. (1982) [15] have shown that N or P deficiency can both enhance stomatal sensitivity to ABA signals, whereas Ndeficiency does not always lead to increases in leaf ABA concentration. Laminas’ E time-course pattern resembled that of gs. This fact led to the same response pattern in each deficiency. Sand P-deficiencies presented a transition from lower to higher rates between d4 and d6; moreover, a deviation in the response at d10 (in -S the deviation tended to be lower). In N-deficiency, the transpiration rate decreased progressively after d4. Searching for linear relationships among the various response ratio patterns, several linear correlations were found, the R2- values of which are summarized in Table 3.
As a final remark it must be stressed out that the impact of P-deprivation on the examined physiological and morphometric traits appeared early and there has been an alleviation action; the impact of N-deprivation appeared early with no alleviation action, whilst the impact of Sdeprivation appeared later, being rather weaker in comparison.
5. Acknowledgements
We would like to express our appreciation to Syngenta Hellas and G. Pontikas for the supply of maize seeds.
REFERENCES
- A. Amtmann and P. Armengaud, “Effects of N, P, K and S on Metabolism: New Knowledge Gained from MultiLevel Analysis,” Current Opinion in Plant Biology, Vol. 12, No. 3, 2009, pp. 275-283. Hdoi:10.1016/j.pbi.2009.04.014
- D. T. Clarkson, M. Carvajal, T. Henzler, R. N. Waterhouse, A. J. Smyth, D. T. Cooke and E. Steudle, “Root Hydraulic Conductance: Diurnal Aquaporin Expression and the Effects of Nutrient Stress,” Journal of Experimental Botany, Vol. 51, No. 342, 2000, pp. 61-70. Hdoi:10.1093/jexbot/51.342.61
- J. W. Radin, “Responses of Transpiration and Hydraulic Conductance to Root Temperature in Nitrogenand Phosphorus-Deficient Cotton Seedlings,” Plant Physiology, Vol. 92, No. 3, 1990, pp. 855-857. Hdoi:10.1104/pp.92.3.855
- E. J. Ward, R. Oren, D. Bjarn, B. D. Sigurdsson, P. G. Jarvis and S. Linder, “Fertilization Effects on Mean Stomatal Conductance Are Mediated through Changes in the Hydraulic Attributes of Mature Norway Spruce Trees,” Tree Physiology, Vol. 28, No. 4, 2008, pp. 579-596. Hdoi:10.1093/treephys/28.4.579
- T. Eichert, J. J. Peguero-Pina, E. Gil-Pelegrín, A. Heredia and V. Fernández, “Effects of Iron Chlorosis and Iron Resupply on Leaf Xylem Architecture, Water Elations, Gas Exchange and Stomatal Performance of Field-Grown Peach (Prunus persica),” Physiologia Plantarum, Vol. 138, No. 1, 2010, pp. 48-59. Hdoi:10.1111/j.1399-3054.2009.01295.x
- A. J. S. McDonald and W. J. Davies, “Keeping in Touch: Responses of the Whole Plant to Deficits in Water and Nitrogen Supply,” Advances in Botanical Research, Vol. 22, 1996, pp. 229-300. Hdoi:10.1016/S0065-2296(08)60059-2
- S. Wilkinson, M. A. Z. Bacon and W. J. Davies, “Nitrate Signalling to Stomata and Growing Leaves: Interactions with Soil Drying, ABA, and Xylem Sap pH in Maize,” Journal of Experimental Botany, Vol. 58, No. 7, 2007, pp. 1705-1716. Hdoi:10.1093/jxb/erm021
- P. Battal, M. Turker and B. Tileklioglu, “Effects of Different Mineral Nutrients on Abscisic Acid in Maize (Zea mays),” Annales Botanici Fennici, Vol. 40, 2003, pp. 301-308.
- P. Marschner, “Marschner’s Mineral Nutrition of Higher Plants,” 3rd Edition, Elsevier, 2012, p. 101.
- C. Maurel, L. Verdoucq, D.-T. Luu and V. Santoni, “Plant Aquaporins: Membrane Channels with Multiple Integrated Functions,” Annual Review of Plant Biology, Vol. 59, 2008, pp. 595-624. Hdoi:10.1146/annurev.arplant.59.032607.092734
- G. D. Farquhal, T. N. Buckley and J. M. Miller, “Optimal Stomatal Control in Relation to Leaf Area and Nitrogen,” Silva Fennica, Vol. 36, No. 3, 2002, pp. 625-637.
- M. D. Cramer, H.-J. Hawkins and G. A. Verboom, “The Importance of Nutritional Regulation of Plant Water Flux,” Oecologia, Vol. 161, No. 1, 2009, pp. 15-24. Hdoi:10.1007/s00442-009-1364-3
- S. Wilkinson and W. J. Davies, “ABA-Based Chemical Signalling: The Co-Ordination of Responses to Stress in Plants,” Plant, Cell & Environment, Vol. 25, No. 2, 2002, pp. 195-210. Hdoi:10.1046/j.0016-8025.2001.00824.x
- E. Brewitz, C.-M. Larsson and M. Larsson, “Influence of Nitrate Supply on Concentrations and Translocation of Abscisic Acid in Barley (Hordeum vulgare),” Physiologia Plantarum, Vol. 95, No. 4, 1995, pp. 499-506. Hdoi:10.1111/j.1399-3054.1995.tb05515.x
- J. W. Radin, L. L. Parker and G. Guinn, “Water Relations of Cotton Plants under Nitrogen Deficiency. V. Environmental Control of Abscisic Acid Accumulation and Stomatal Sensitivity to Abscisic Acid,” Plant Physiology, Vol. 70, No. 4, 1982, pp. 1066-1070. Hdoi:10.1104/pp.70.4.1066
Abbreviations
A—Photosynthetic rate;
DM—Dry mass;
E—Transpiration rate;
gs—Stomatal conductance;
Rr—Response ratio;
W—Water amount;
Sa—Surface area.