American Journal of Plant Sciences
Vol.3 No.3(2012), Article ID:17911,9 pages DOI:10.4236/ajps.2012.33038
Genetic Diversity of Pigeonpea (Cajanus cajan (L.) Millsp.) Cultivars and Its Wild Relatives Using Randomly Amplified Polymorphic DNA (RAPD) Markers
![]()
1Department of Biochemistry, University of Lucknow, Lucknow, India; 2Department of Microbiology, College of Basic Science & Humanities, Sardarkrushinagar Dantiwada Agricultural University, Palanpur, India.
Email: *anukusum@gmail.com
Received November 16th, 2011; revised December 5th, 2011; accepted December 30th, 2011
Keywords: Genetic diversity; RAPD; Pigeonpea
ABSTRACT
Genetic diversity among and between 16 cultivars of pigeonpea (Cajanus cajan (L) Millsp.) and its wild relatives (C. albicans and C. lineatus) analysed using RAPD. Twenty two random primers with an average of 71.2% polymorphism produced 151 polymorphic bands. Cluster analysis based on these 151 RAPD markers revealed relatively low level (0.434 - 0.714) of genetic diversity among cultivars and high level of diversity between cultivars and wild relatives. C. albicans and C. lineatus showed only 0.231 similarity with each other and C. albicans showed relatively higher similarity with C. cajan cultivars than that showed by C. lineatus. In dendrogram the 16 cultivars grouped into two distinct clusters comprising of seven and nine genotypes each while the wild species form out groups. Bootstrap analysis of the dendrogram was performed and resulted in significant bootstrap values. Principal components analysis (PCA) also revealed the similar results that of unweighted pair group method with arithmetic mean (UPGMA). The first, second and third PCs contributed 55.9%, 5.9%, and 5.6% of the variation, respectively, with cumulative variation of the first three PCs was 67.4%.
1. Introduction
Pulses are leguminous crops harvested exclusively for dry grains. Genetic improvement in pulses production could not achieved significantly in comparison to other cereal crops through conventional breeding methods. Major yield constraints are high susceptibility of pulses to biotic and abiotic stresses, and high genotype × environment interaction on the expression of important quantitative traits which lead to slow gain in genetic improvement and yield stability of pulses [1]. Marker assisted conventional breeding may be the alternative for increasing productivity. For this the available high yielding diverse lines should be used as base material for incorporating some traits from unadapted cultivars, lines or wild relatives [2]. A starting point therefore, is to determine the extent of genetic diversity within these available lines for the selection of parental lines and design breeding strategies [3].
Pigeonpea (Cajanus cajan (L.) Millspaugh) is tall, woody, perennial legume with centre of diversity in India [4]. It is only cultivated food crop of the cajaninae sub-tribe and popularly known as redgram (Arhar or Tur). It has diploid genome (2n = 22) and estimated at about 0.853 pg [5]. Pigeonpea is an important pulse crop of India but as compared to other grain legumes it has received relatively little research attention.
Earlier morphological markers have been used for assessment of genetic diversity using cultivated pigeonpea and wild relatives [6]. With the development of environmentally neutral, reliable and plant growth independent molecular markers, many researchers initiated the pigeonpea genetic diversity analysis. Assessment of genetic variability has been done using various molecular markers viz., RAPD [7-9], amplified fragment length polymorphism (AFLP) [3,10,11], restriction fragment length polymorphism (RFLP) [11,12], simple sequence repeat (SSR) [11,13], PCR-RFLP [14]. The present study was therefore, aimed to assess genetic diversity among pigeonpea cultivars and its related wild species using RAPD markers.
2. Materials and Methods
2.1. Plant Material
Sixteen cultivars of C. cajan and two wild relatives (C. albicans and C. lineatus) were procured from core collection maintained at Indian Institute of Pulses Research, Kanpur, India (Table 1).
2.2. Genomic DNA Extraction
Pigeonpea seeds were surface sterilized with 0.2% HgCl2 and washed 3 - 4 times and grown in pots in sunlight for three weeks. DNA was isolated from young leaves using HiPurA™ Plant genomic DNA Miniprep Purification spin kit (Himedia Laroratories Pvt. Ltd). Quality and quantity of isolated DNA was checked by spectrophotometry as well as by 0.8% agarose gel electrophoresis. The DNA yield obtained was in the range of 1.0 μg to 3.0 μg.
2.3. PCR-RAPD Analysis
The PCR was performed in a reaction volume of 25 µl containing 10 mM Tris-HCl, pH 9.0, 2 mM MgCl2, 50 mM KCl, 0.01% gelatin, 200 µM of each dNTP, 4 µM of primer, 1 Units of Taq DNA polymerase (Bangalore Genei, Bangalore, India) and 30 ng of genomic DNA. A total of 30 decamer primers (GC content 60% - 90%) were used for RAPD analysis. Out of 30 primers 19 belong to Operon series (Operon Technologies USA) and 11 were selected from the literature (Table 2). The PCR amplification was carried out for 45 cycles in a thermal cycler (PTC-200, Bio-Rad USA). The reaction had initial denaturation step at 94˚C for 5 min, followed by 45 cycles of 94˚C for 1 min, annealing temperature (Tm-5˚C) for 1 min, 72˚C for 2 min. The final extension step was at 72˚C for 5 min. Amplified products were separated on 1.5% agarose gels having 0.5 µg·ml−1 of the ethidium bromide at 50 V for 3 h. The gels were observed under a UV light source in a gel documentation system (BIOVIS Gel, Expert Vision Labs Pvt. Ltd, India).
2.4. Data Analysis
Band positions in comparative RAPD profiles for each
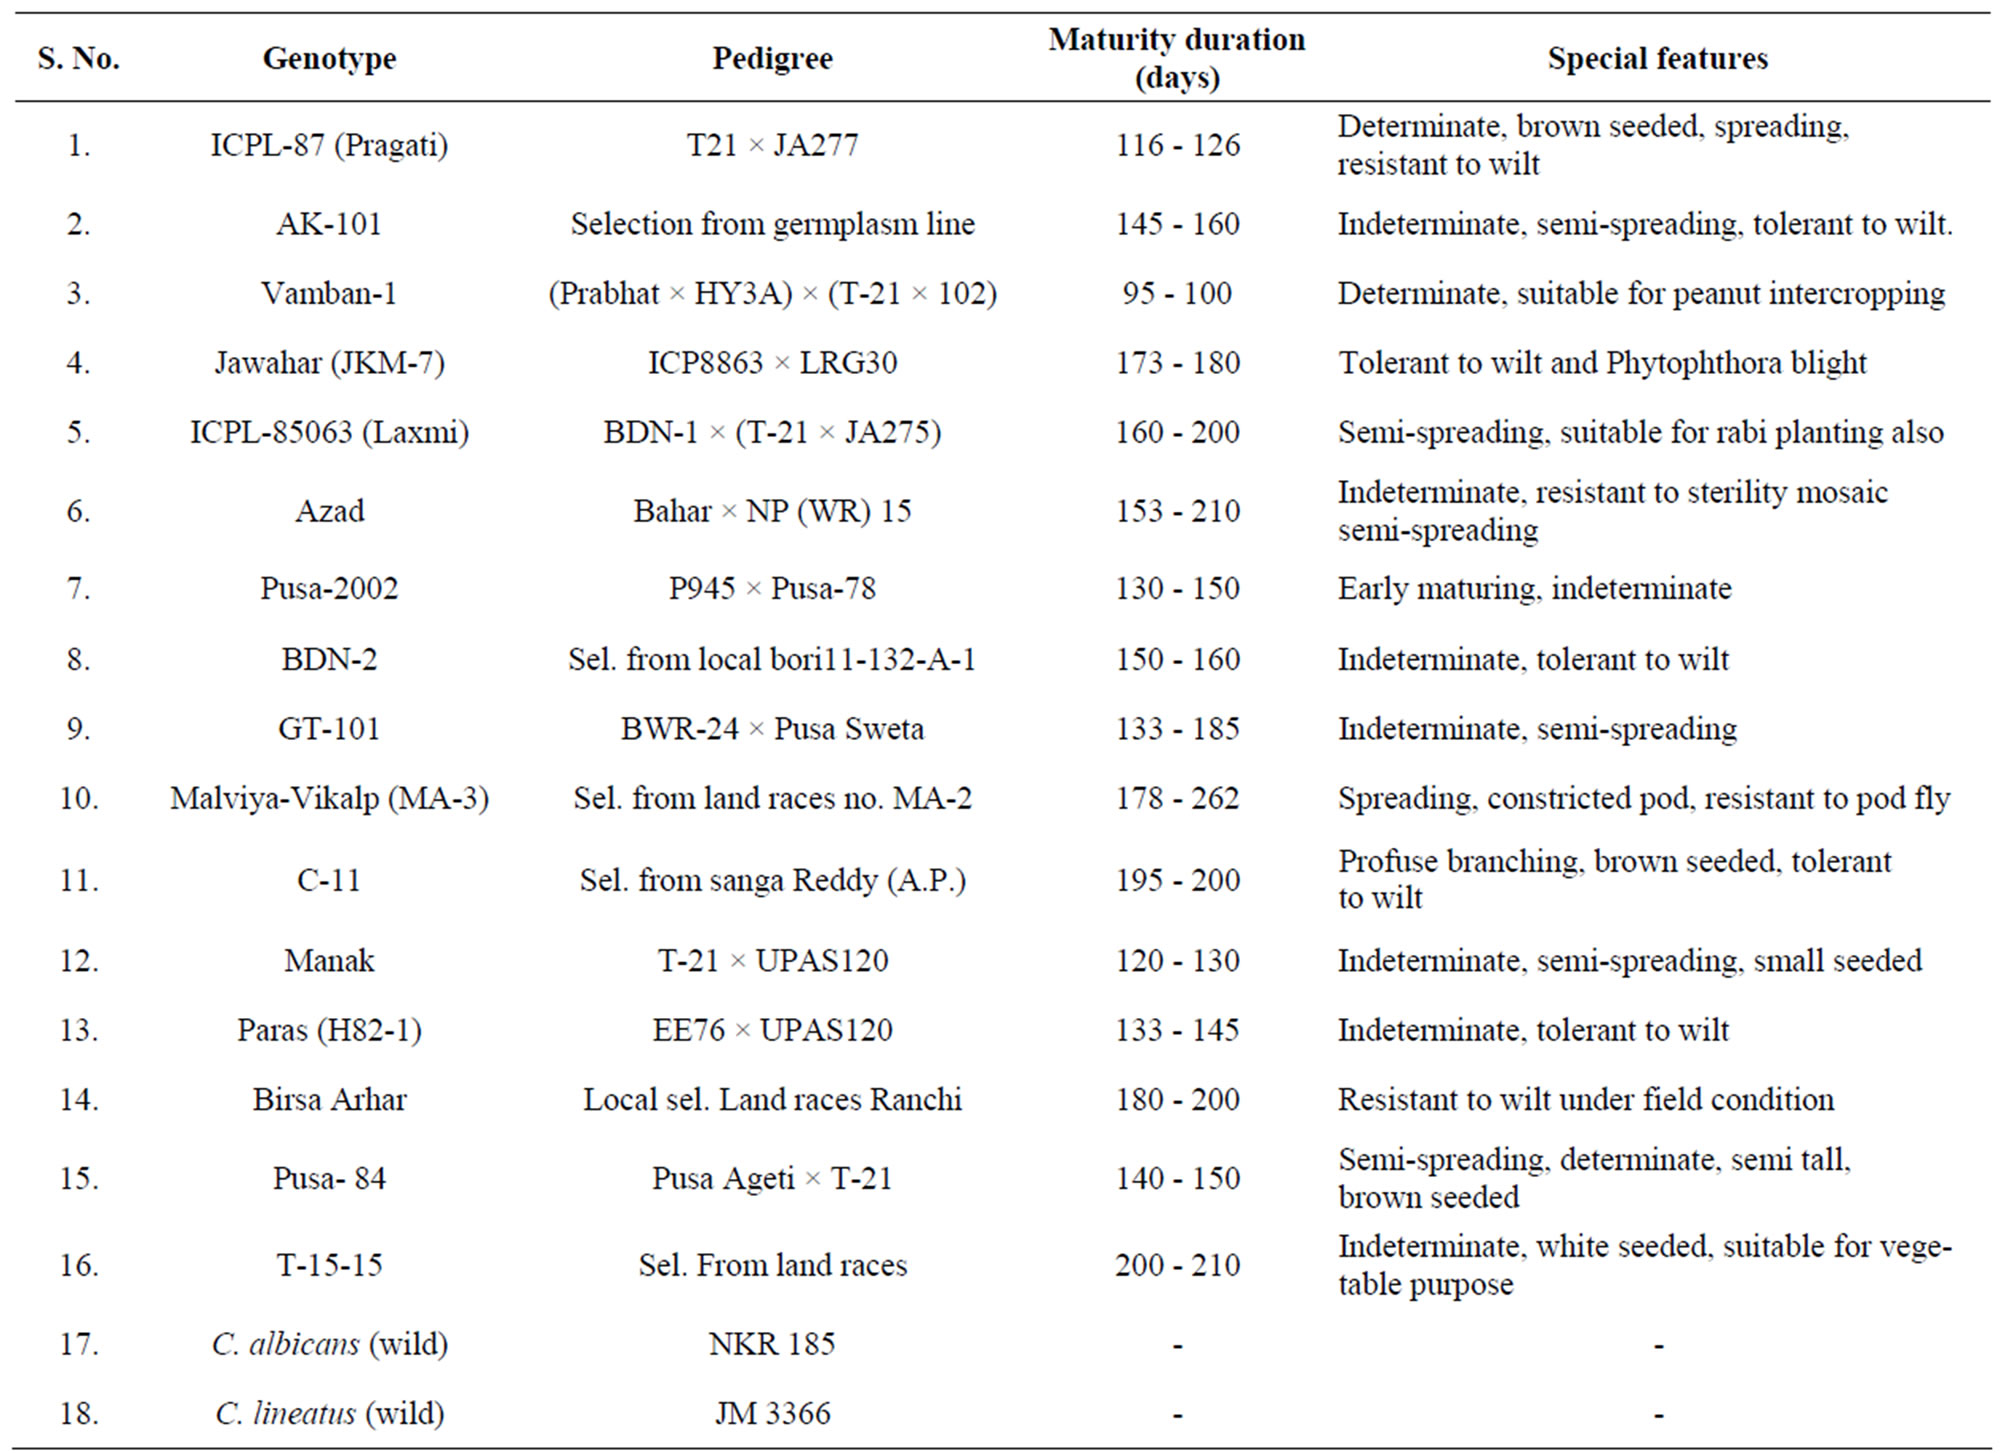
Table 1. List of genotypes and the wild relatives of pigeonpea (Cajanus cajan (L.) Millsp.) used for genetic diversity analysis.
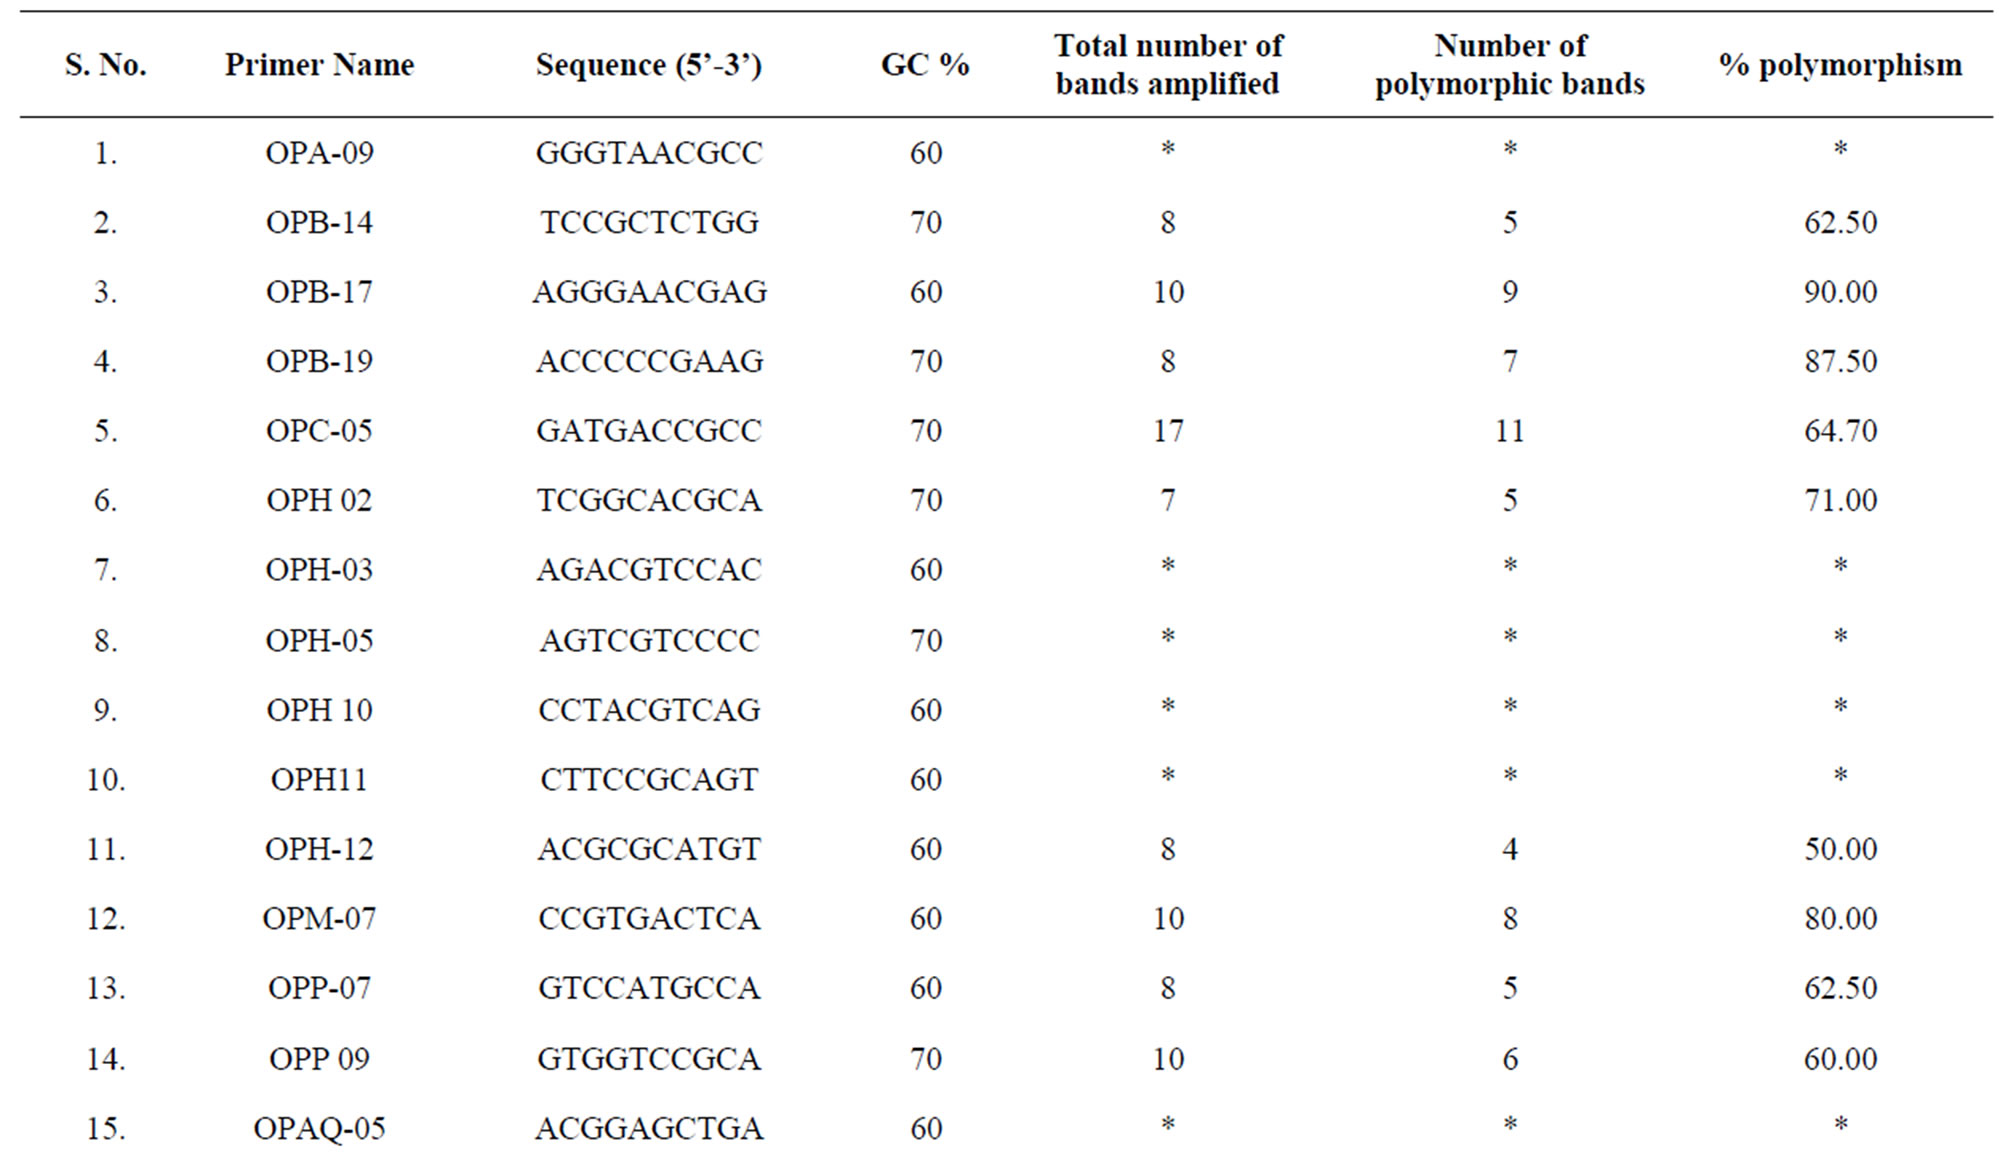

Table 2. Random primers selected for RAPD analysis.
genotype and primer combination were scored. RAPD profiles from only those genotype x primer combinations, which generated consistent bands after amplification, were included in this study. A band was equated to a marker; a score of “1” was given for its presence, and “0” was assigned for absence. Jaccard’s similarity coefficient [15] was estimated from these binary data using FreeTree [16] software. The resulting similarity matrix was used for UPGMA based dendrogram construction. Support for clusters obtained was evaluated by bootstrap analysis with FreeTree and Tree View [17] software through generating two thousand samples by re-sampling. PCA was also done to check the results of UPGMA based clustering using EIGEN module of NTSYSpc [18].
3. Results and Discussion
3.1. Polymorphism and Marker Efficiency
Out of the 30 primers tested, 22 produced reproducible and polymorphic patterns (Table 2). The 22 primers yielded a total of 212 fragments, of which 151 amplicons (71.2%) were polymorphic, the number of polymorphic bands per primer ranged from 2 to 17, the average being 9.63 (Table 3). Primers OPB17, OPB-19 OPM-07, OPAZ-05, OPAZ-18, P-24, P-26, P-27, P-29, and P-30 were the most informative primers as 75% or more of the amplicons were polymorphic. Gel image of RAPD profile of primer P-27 is given in Figure 1. These ten highly polymorphic primers produced 83.1% polymorphism (Table 3). Present study obtained 71.2% polymorphic band with an average 9.63 band per primer which is comparable to earlier studies on pigeonpea using RAPD marker [8,9].
3.2. Genetic Diversity
Genetic similarities measured through analysis of data on the 151 RAPD markers revealed varying degrees of genetic relatedness among wild and cultivated genotypes. Jaccard’s similarity coefficients between species i.e., C. lineatus and C. cajan cultivars ranged from 0.148 to 0.220 and between C. albicans and C. cajan ranged between 0.270 and 0.377 (Table 4). The genetic similarity between C. lineatus and C. albicans was 0.231. Jaccard’s similarity coefficients among C. cajan cultivars ranged from 0.434 - 0.714 (Table 4). Lowest similarity was obtained between GT-101 and Azad (0.434) followed by that between Birsa arhar and Vamban-1 (0.451). Highest similarity was obtained between Pusa-2002 and Manak (0.714) followed by that between ICPL-87 and Azad (0.703).
The genetic diversity range obtained in this study is higher (0.434 - 0.714) comparable to the previous reports on pigeonpea based on RAPD [9] and AFLP [10] markers. Some researchers [13,19] developed characterized
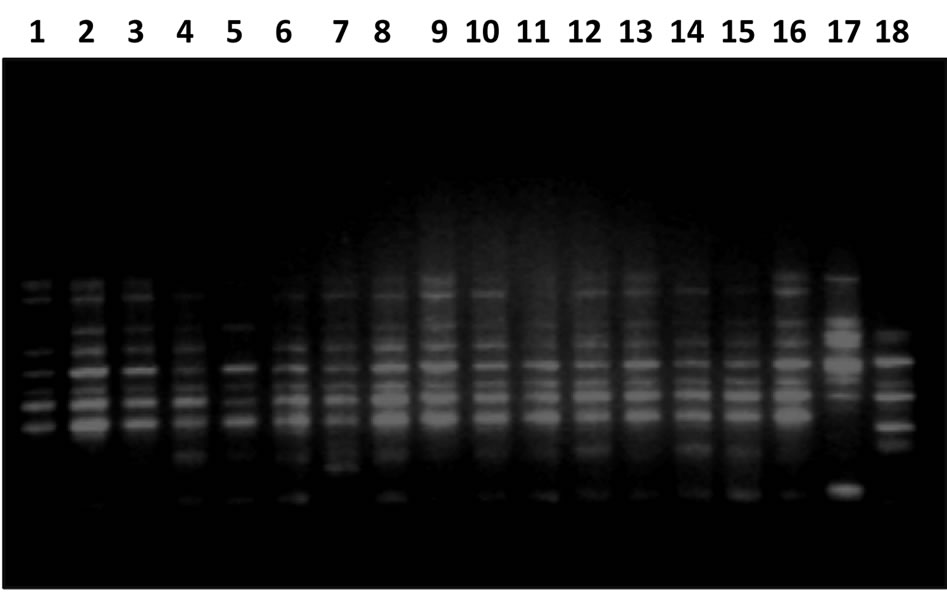
Figure 1. Gel image showing RAPD profile obtained by P-27 primer. Lane 1-18 represents the genotypes (Genotypes name is given in Table 1).

Table 3. Summary of amplification patterns generated by the random primers tested in this study.
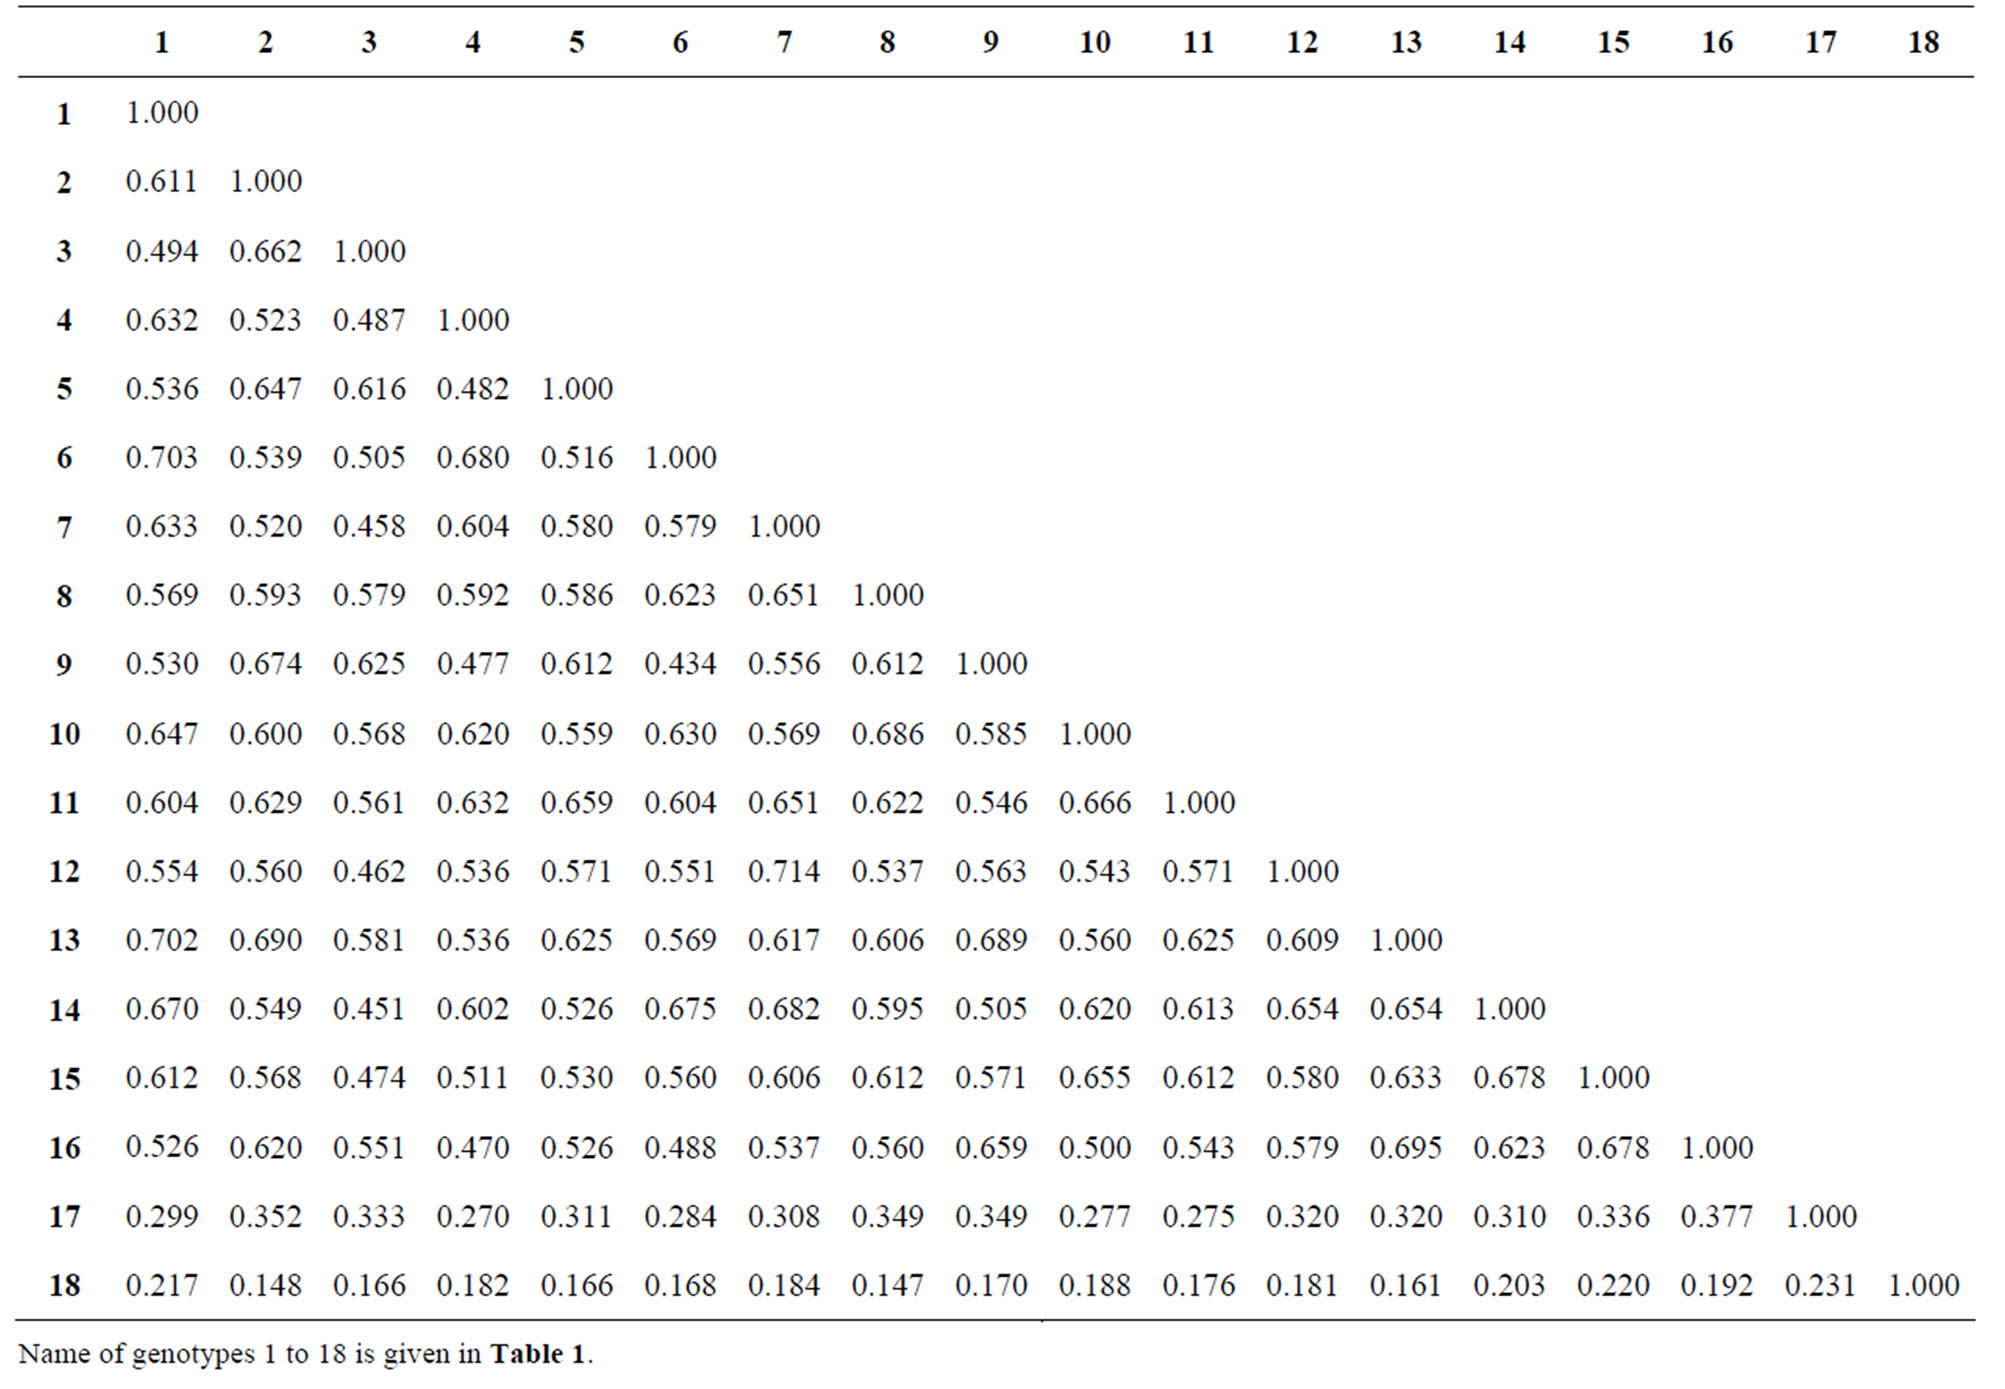
Table 4. Jaccard’s similarity coefficient of the 16 pigeonpea cultivars and two related wild species based on 151 RAPD markers.
and utilized SSR marker and obtained very low range of alleles per locus as compared to other legume crops such as soybean (11 - 26 alleles per locus) [20]. We have recently obtained greater range of genetic diversity (0.29 - 0.88) among pea genotypes [21] as compared to our present work in pigeonpea using RAPD markers. After considering all the results and previous reports we can conclude that pigeonpea genotypes possesses very narrow genetic diversity as compared to wild relatives and RAPD markers seem to be an efficient marker system in pigeonpea as compared to other markers.
In the dendrogram 16 genotypes were grouped into two distinct clusters; cluster I and cluster II with seven and nine genotypes, respectively, whereas the two wild species did not group into clusters (Figure 2). In the dendrogram, Cluster I consisted of GT-101, Paras, T-15-15, AK-101, Vamban-1, C-11, ICPL-85063. Nine genotypes of cluster II were JKM-7, Azad, ICPL-87, BDN-2, MA-3, Birsa arhar, Pusa-84, Manak, and Pusa-2002. Some of the genotypes of cluster II viz., ICPL-87, JKM-7, BDN-2, and Birsa arhar are resistant to wilt and JKN-7, BDN-2, Birsa arhar along with MA-3 belonged to similar agroclimatic region (M.P., Gujarat, Maharashtra); this may be the reason for showing more similarity with each other and clustering together. Bootstrap analysis was used to evaluate the degree of support for clusters within dendrogram. The two major branching points that differentiated the C. lineatus and C. albicans had bootstrap values 100 and 92, respectively. The branch point that grouped the all C. cajan cultivars into two clusters has bootstrap value of 100. These values show that the dendrogram obtained from RAPD markers is robust and differentiation of genotypes is precise and accurate. Only four branches showed bootstrap value less than ten. PCA revealed that the PC1, PC2, and PC3 accounted for 55.9%, 5.9%, and 5.6% of the variation, respectively. Together, the first three PCs accounted for 67.4% of the total variation. Two dimensional (Figure 3) and three dimensional (Figure 4) plots were prepared by using the first two and first three PCs, respectively. In 2-D plot the wild species C. lineatus and C. albicans occupied distant positions from the C. cajan cultivars which in turn showed more similarity with each other and grouped together. The 3-D plot differentiated the all 16 cultivars into three clusters while wild species placed distant position. Cluster I comprised the genotypes Vamban-1, GT-101, AK-101,

Figure 2. Dendrogram of pigeonpea along with wild relative showing genetic similarity.
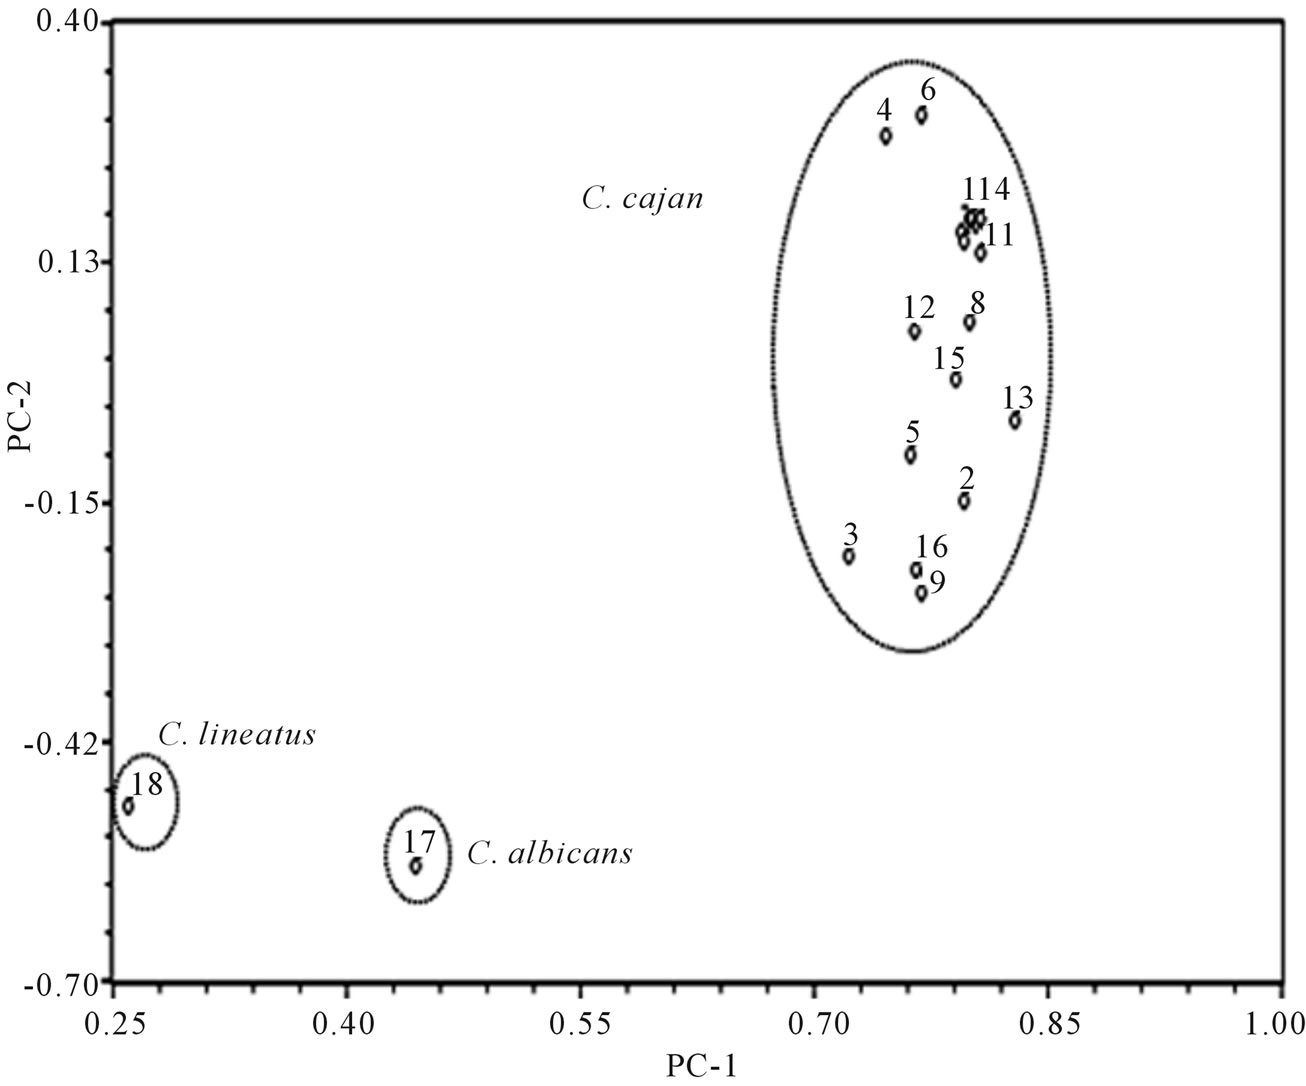
Figure 3. Two dimensional plot of principal components 1 and 2 based on RAPD markers of pigeonpea genotypes. Name of the genotypes 1 to 18 is given in Table 1.
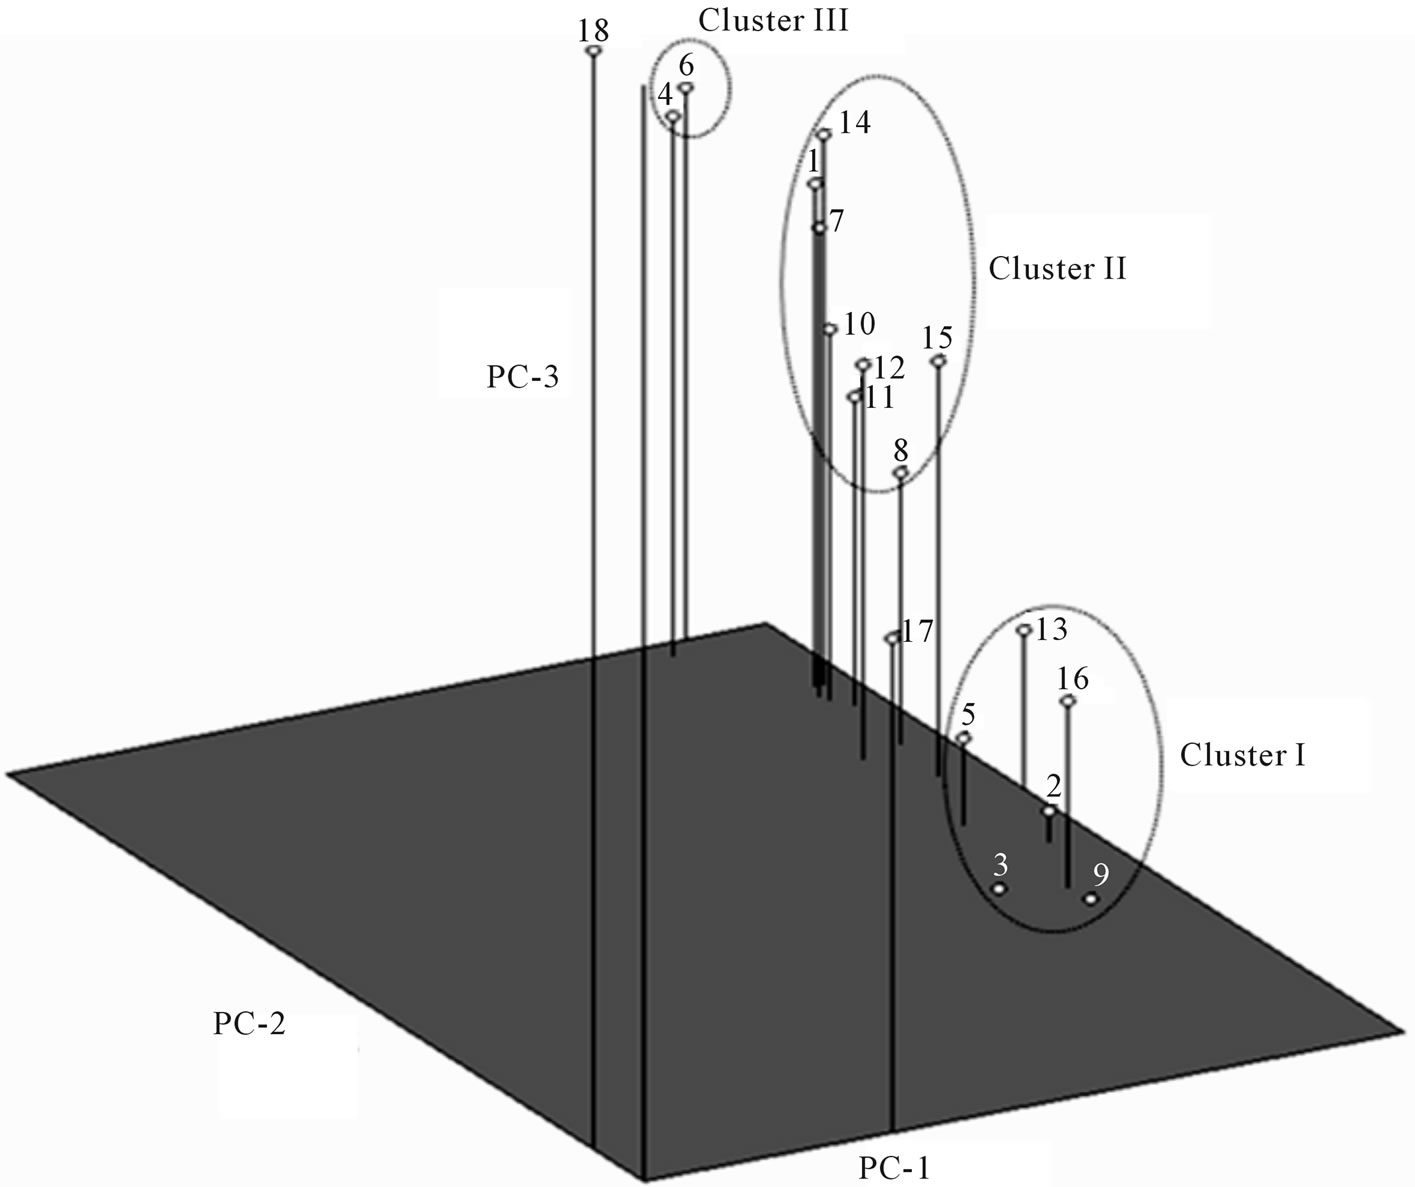
Figure 4. Three dimensional plot of principal components 1, 2 and 3 based on RAPD markers of pigeonpea genotypes. Name of the genotypes 1 to 18 is given in Table 1.
ICPL-85063, T-15-15 and Paras. Cluster II included eight genotypes viz., BDN-2, Pusa-84, C-11, Manak, MA-3, Pusa-2002, ICPL-87 and Birsa arhar. The cluster III included genotypes JKM-7 and Azad. The result of PCA was similar to that obtained by UPGMA clustering. All the genotypes (except C-11) of cluster I of PCA 3-D plot grouped in cluster I of UPGMA dendrogram. Similarly cluster II of PCA 3-D plot and cluster II of the UPGMA dendrogram shared most of genotypes except JKM-7 and Azad. JKM-7 and Azad are present in cluster II of UPGMA but in PCA 3-D plot these genotypes comprised a distinct cluster III. Genotype C-11 showed different grouping pattern in both the methods. In UPGMA it grouped in cluster I while in PCA 3-D plot it clustered with genotypes of cluster II. Thus both the hierarchical method and the ordination method resulted in similar type of clustering pattern which is similar to earlier studies on pea [21,22] therefore it can be suggested that both UPGMA and PCA should be performed for genetic diversity analysis. Present study also resulted in some pigeonpea specific marker. Primers OPP-09, P-23, P-24, P-25, P-27, P-28, P-29, P-30 amplified nine intense, distinct, species-specific markers. These markers were present in all the 16 genotypes but absent in both the wild species. One such marker that was amplified by primer P-25 is shown in Figure 5. These markers can be utilized for development of more specific SCARs in pigeonpea.
In the present study we obtained higher diversity between the wild species and between wild and cultivated genotypes. One report [23] utilizing diversity arrays technology (DArT) obtained similar results with 96 accessions representing nearly 20 species of Cajanus including the cultivated one. It was concluded that most of
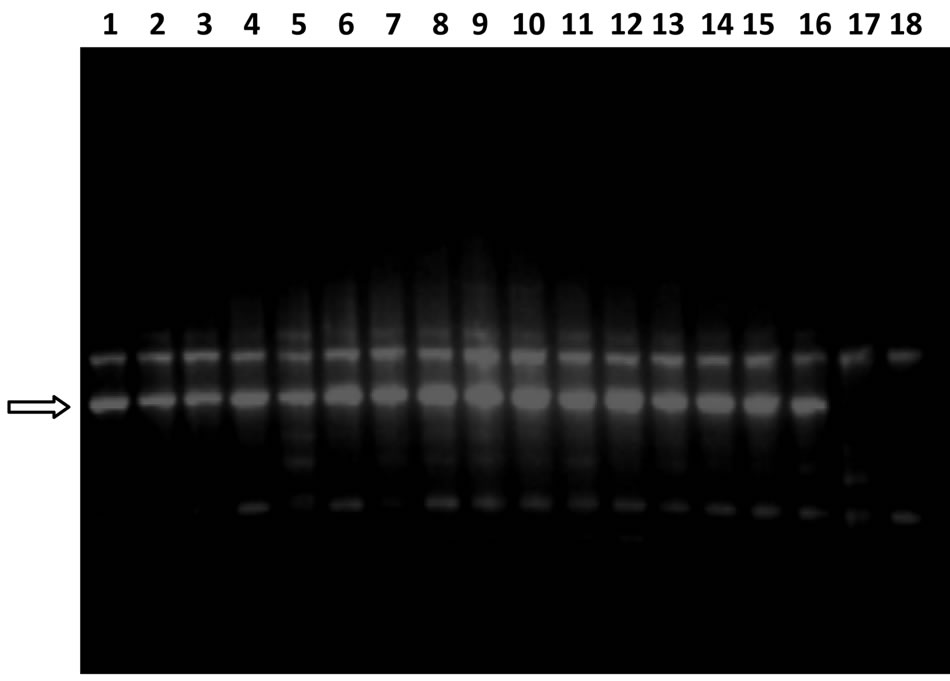
Figure 5. Gel image showing RAPD profile obtained by P-25 primer Lane 1 - 18 represents the genotypes (Genotype name is given in Table 1). Arrow showing the position of species specific marker which is present in all the 16 pigeonpea cultivars but absent in both the wild relatives.
the diversity was among the wild relatives of pigeon pea or between the wild and the cultivated species, but not among the cultivated accessions. Very low level of genetic diversity in pigeonpea cultivras was reported also by many other researchers [9,10,13]. Such narrow genetic base can put a serious impediment to breeding progress in pigeon pea [23].
The reason for narrow genetic diversity in pigeonpea and in other pulses could be that only few genotypes with high degree of relatedness have been used as parents in crossing programmes for the development of new cultivars which leads to narrowing down the genetic base of cultivated germplasm of pulses [24]. One possible reason behind narrow genetic diversity in pigeon pea is that 35 (41%) and 16 (34%) of the released cultivars in chickpea and in pigeonpea, respectively, were developed in India involving one or two genotypes as one of the ancestors in their pedigree [24]. A study was conducted to compare the level of genetic diversity in pulses and concluded that the range of genetic diversity has been found to be narrow among both the cultivated and wild relatives of pigeon pea and lentil as compared to other pulses [2].
4. Conclusion
On the basis of results based on present study and previous studies on pigeonpea we can conclude that there is an urgent need to incorporate diverse parents in breeding programmes of pigeonpea and generate more DNA markers which can be useful in molecular breeding programmes of this crop.
5. Acknowledgements
The financial assistance in the form of ad hoc project and Junior Research Fellowships (to Sanjay K. Yadav) by CST UP (Council of Science and Technology, UP) Lucknow is gratefully acknowledged. The author is thankful to Dr. Farindra Singh, IIPR Kanpur for providing seed samples.
REFERENCES
- A. Baranger, G. Aubert, G. Arnau, A. L. Laine, G. Deniot, J. Potier, C. Weinachter, I. Lejeune-Henaut, J. Lallemand and J. Burstin, “Genetic Diversity within Pisum Sativum Using Proteinand PCR-Based Markers,” Theoretical Applied Genetics, Vol. 108, No. 7, 2004, pp. 1309-1321.
- A. Pavlicek, S. Hrda and J. Flegr, “FreeTree: Freeware Program for Construction of Phylogenetic Trees on the Basis of Distance Data and Bootstrap/Jackknife Analysis of the Tree Robustness. Application in the RAPD Analysis of Genus Frenkelia,” Folia Biologia (Praha), Vol. 45, 1999, pp. 97-99.
- B. G. Nadimpalli, R. L. Jarret, S. C. Phatak and G. Kochert, “Phylogenetic Relationships of the Pigeonpea (Cajanus cajan) Based on Nuclear Restriction Fragment Length Polymorphism,” Genome, Vol. 36, No. 2, 1992, pp. 216-223. doi:10.1139/g93-030
- D. A. Odeny, B. Jayshree, M. Ferguson, D. Hoisington, J. Crouch and C. Gebhardt, “Development, Characterization and Utilization of Microsatellite Markers in Pigeonpea,” Plant Breeding, Vol. 126, No. 2, 2007, pp. 130-136. doi:10.1111/j.1439-0523.2007.01324.x
- F. J. Rohlf, “NTSYS-pc Version. 2.02i Numerical Taxonomy and Multivariate Analysis System. Applied Biostatistics Inc., Exeter Software,” Setauket, New York, 1997.
- J. Greilhuber and R. Obermayer, “Genome Size Variation in Cajanus cajan (Fabaceae): A Reconsideration,” Plant Systematic and Evolution, Vol. 212, No. 1-2, 1998, pp. 135-141. doi:10.1007/BF00985225
- J. Kumar, A. K. Choudhary, R. K. Solanki and A. Pratap, “Towards Marker-Assisted Selection in Pulses: A Review,” Plant Breeding, Vol. 130, No. 3, 2011, pp. 297-313. doi:10.1111/j.1439-0523.2011.01851.x
- J. Rongwen, M. S. Akkaya, A. A. Bhagwat, U. Lavi and P. V. Cregan, “The Use of Microsatellite DNA Markers for Soybean Genotype Identification,” Theoretical and Applied Genetics, Vol. 90, No. 1, 1994, pp. 43-48.
- J. Smartt, “Evolution of Genetic Resources of Pigeonpea,” In: J. Smartt, Ed., Grain legumes, Cambridge University Press, Cambridge, 1990, pp. 278-293. doi:10.1017/CBO9780511525483.009
- J. Souframanien, J. G. Manjaya, T. G. Krishna and E. S. Pawar, “Randam Amplified Polymorphic DNA Analysis of Cytoplasmic Male Sterile and Male Fertile Pigeonpea (Cajanus cajan (L.) Millsp.),” Euphytica, Vol. 129, No. 3, 2003, pp. 293-299. doi:10.1023/A:1022212127025
- K. Yadav, B. D. Singh, C. P. Srivastava, R. Chand and A. Yadav, “Analysis of Genetic Divergence in Pea (Pisum sativum L.) Using Quantitative Traits and RAPD Markers,” Indian Journal of Genetics and Plant Breeding, Vol. 70, No. 4, 2010, pp. 363-369.
- L. J. Reddy, H. D. Upadhyaya, C. L. L. Gowda and S. Singh, “Development of a Core Collection in Pigeonpea [Cajanus cajan (L.) Millspaugh] Using Geographic and Qualitative Morphological Descriptors,” Genetic Resource and Crop Evolution, Vol. 52, No. 8, 2005, pp. 1049-1056. doi:10.1007/s10722-004-6152-7
- M. Lakshmi, P. Senthikumar, M. Parani, J. Narayana and A. K. Parida, “PCR-RFLP Analysis of Chloroplast Gene Regions in Cajanus (Leguminosae) and Allied Genera,” Euphytica, Vol. 116, No. 3, 2000, pp. 243-250. doi:10.1023/A:1004030207084
- M. B. Ratnaparkhe, V. S. Gupta, M. R. Murthy and P. K. Ranjekar, “Genetic Fingerprinting of Pigeonpea [Cajanus cajan (L.) Millsp.] and Its Wild Relatives Using RAPD Markers,” Theoretical and Applied Genetics, Vol. 91, No. 6-7, 1995, pp. 893-898.
- M. J. Burns, K. J. Edwards, H. J. Newbury, B. V. FordLloyd and C. D. Bagott, “Development of Simple Sequence Repeat (SSR) Markers for the Assessment of Gene Flow and Genetic Diversity in Pigeonpea (Cajanus cajan),” Molecular and Ecological Notes, Vol. 1, No. 4, 2001, pp. 283-285. doi:10.1046/j.1471-8278.2001.00109.x
- P. Jaccard, “Nouvelles Researches Sur Ladistribution Florale,” Bulletin de la Sociète Vaudoise des Sciences Naturelles, Vol. 44, 1908, pp. 223-270.
- P. R. Choudhury, I. P. Singh, B. George, A. K. Verman and N. P. Singh, “Assessment of Genetic Diversity of Pigeonpea Cultivars Ising RAPD Analysis,” Biologia Plantarum, Vol. 52, No. 4, 2008, pp. 648-653.
- R. Aruna, R. D. Manohar, S. Sivaramakrishnanan, R. L. Janardhan, B. Paula and H. Upadhyaya, “Efficiency of Three DNA Markers in Revealing Genetic Variation among Wild Cajanus Species,” Plant Genetic Resources: Characterization and Utilization, Vol. 7, No. 2, 2008, pp. 113- 121. doi:10.1017/S1479262108061479
- R. D. M. Page, “TreeView: An Application to Display Phylogenetic Trees on Personal Computers,” Computer Application in Biosciences, Vol. 12, No. 4, 1999, pp. 357-358.
- S. Kumar and M. Ali, “GE Interaction and Its Breeding Implications in Pulses,” The Botanica, Vol. 56, 2006, pp. 31-36.
- S. Kumar, S. Gupta, S. Chandra and B. B. Singh, “How wide is the Genetic Base of pulse Crops,” In: M. Ali, B. B. Singh, S. Kumar and Vishwadhar, Eds., Pulses in New Perspective, IIPR, Kanpur, 2004, pp. 211-221.
- S. Wasike, P. Okori and P. R. Rubaihayo, “Genetic Variability and Relatedness of the Asian and African Pigeonpea as Revealed by AFLP,” African Journal of Biotechnology, Vol. 4, No. 11, 2005, pp. 1228-1233.
- S. Y. Yang, W. Pang, G. Ash, J. Harper, J. Carling, P. Wenzl, E. Huttner, X. X. Zong and A. Kilian, “Low Level of Genetic Diversity in Cultivated Pigeonpea Compared to Its Wild Relatives Is Revealed by Diversity Arrays Technology,” Theoretical and Applied Genetics, Vol. 113, No. 4, 2006, pp. 585-595. doi:10.1007/s00122-006-0317-z
- S. K. Panguluri, K. Janaiah, J. N. Govil, P. A. Kumar and P. C. Sharma, “AFLP Fingerprinting in Pigeonpea (Cajanus cajan (L.) Millsp.) and Its Wild Relatives,” Genetic Resources and Crop Evolution, Vol. 53, No. 3, 2006, pp. 523-531. doi:10.1007/s10722-004-2031-5
NOTES
*Corresponding author.