Advances in Computed Tomography
Vol.2 No.3(2013), Article ID:36920,5 pages DOI:10.4236/act.2013.23016
Subtraction Perfusion CT: A Technical Note
1Department of Radiology, Shanghai Eighth People’s Hospital, Shanghai, China
2Department of Radiology, Keck School of Medicine, University of Southern California, Los Angeles, USA
Email: *woothingyang2008@126.com, qqlaolangqq@163.com, chishing@usc.edu
Copyright © 2013 Xiu-Jun Yang et al. This is an open access article distributed under the Creative Commons Attribution License, which permits unrestricted use, distribution, and reproduction in any medium, provided the original work is properly cited.
Received March 23, 2013; revised April 27, 2013; accepted May 22, 2013
Keywords: Tomography; X-Ray Computed; Perfusion Imaging; Subtraction Technology; Subtraction Computed Tomographic Perfusion
ABSTRACT
It is challenging to attempt to obtain CT perfusion (CTP) images of the hyperdense tissues, which could conceal the density of contrast material during perfusion study. We report a new technique of subtraction CTP (SCTP) to compensate the shortcomings. SCTP post-processed by perfusion software for the data of post-perfusion images subtracting pre-perfusion corresponding images slice by slice in CTP source images is technically feasible without any adverse effects on patients. It provides a new functional imaging with quantitatively hemodynamic indexes of tissue microcirculation and reflects accurately the change of blood flow in tissues and organs.
1. Introduction
Physiological, pathological activities of human tissues and organs are closely related to the change of their blood flow. As advancements in computed tomography (CT), CT perfusion (CTP) have been proven to reflect accurately this change of blood flow in tissues and organs [1,2]. The non-invasive CTP provides morphological, functional information of normal and diseased tissues and organs, and provides critical information in the clinical management of diseases. Tissue perfusion, vascular proliferation, and underlying pathologyical changes could be evaluated by CTP, through quantitatively evaluating the hemodynamics of microcirculation at capillary level by detecting the dynamic distribution of contrast media in the capillaries within tissue. Based on time-density curve (TDC) and different mathematical models, values and mappings of quantitative functional parameters including blood flow (BF), blood volume (BV), mean transit time (MTT) of contrast media, time to peak (TTP) and permeability surface (PS) in local tissue were calculated with CTP [2-4]. And with the use of new CT, a larger z-coverage is provided [5], and whole organ volume perfusion could be achieved [6-11]. Hyperdense tissues, however, remain to be a major problem hindering the accurate depiction of CT perfusion parameters in these tissues, such as bone, hematoma, calcification, or liver tumor with iodized oil deposition after TACE. Therefore, CTP is very seldom utilized to evaluate early osteonecrosis [12], acute intracerebral hemorrhage [13] and liver cancer after transarterial chemoembolization (TACE) treatment with retention of iodized oil [14,15], though few animal and clinical research studies showed perfusion parameters were useful in the assessment of therapeutic response of liver cancer [16,17]. We thus designed a new CT perfusion technique, namely, the subtraction CT perfusion (SCTP), in order to effectively compensate the shortcomings of standard CTP.
2. Methods
2.1. General Methods
The study was approved by the institutional review board and the informed consent requirement was waived. On workstation (GE workstation, AW 4.2), three CTP datasets, including a case of stoke, a case of meningioma and a case of canine early osteonecrosis of femoral head (ONFH) proved by histopathology were selected. SCTP and routine CTP were performed to the 3 sets of imaging data. About 5 to 10 pixels in region of interesting (ROI) were drawn manually to automatically measure at least twice by an experienced radiologist (XJ Yang). The mean value expressed as  and its color-coded maps of the functional parameters of the BF, BV, MTT or PS were observed the difference between lesion and normal tissues on both CTP and SCTP. Owing to different case determination and observation, statistical analysis was not used to process the raw data.
2.2. Steps of SCTP
The SCTP technique included the following steps:
1) Routine CTP scanning was performed 5 - 8 seconds following injection of iodinated contrast media through peripheral vein (scanning time 40 - 50 seconds). In fact, SCTP could be performed with any existing CTP data sets like this study;
2) Using subtraction software in workstation, the image containing no contrast material was subtracted from the post-contrast perfusion images at the same level in different time frames slice by slice (Figure 1) manually or semi-automatically to create a new set of imaging data for SCTP source images;
3) Using perfusion software, the set of SCTP source imaging data were processed and analyzed to produce TDCs, mappings and values of tissue perfusion parameters of BF, BV, MTT or PS.
3. Results
After subtracted, a new set of 40 or 50 CTP images was created successfully to illustrated contrast media perfusion images of tissue regardless of underlying tissue density in the 3 CTP imaging data. And the new microcirculation hemodynamics color-coded maps (Figures 2-4) and the functional index values (Tables 1-3) of various parameters of BF, BV, MTT(s) or PS of areas of interest in tissue were all generated successfully on SCTP in the 3 new sets of subtraction source imaging data, and the mean total post-processing time was about 70 min. Compared to CTP, the lesion depiction on some mappings was shown better on SCTP, the values of BF, BV, and
 (a)
(a)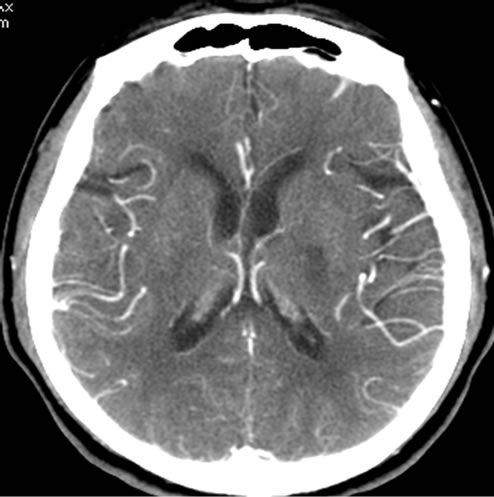 (b)
(b)
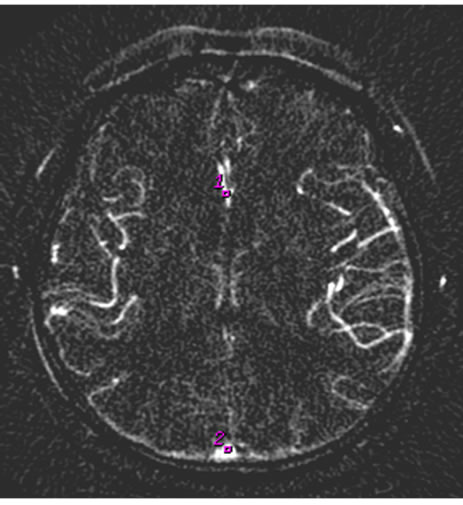
Figure 1. Cerebral Infarction in left basal ganglion. (a) is usual CTP source image, and (b) is SCTP source image. On SCTP source image, high-density bone becomes low-density, which highlights contrast media perfusion image of tissue.
 (a)
(a)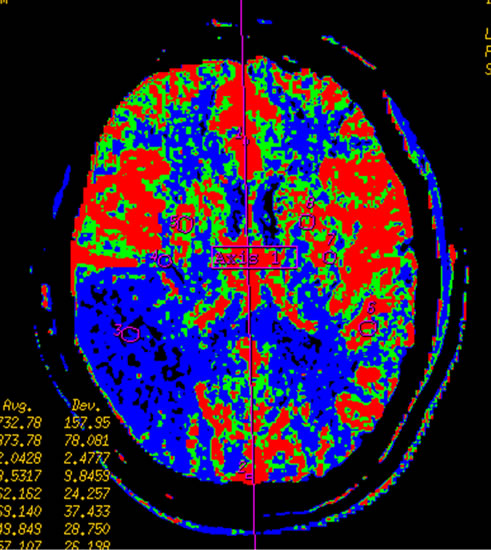 (b)
(b)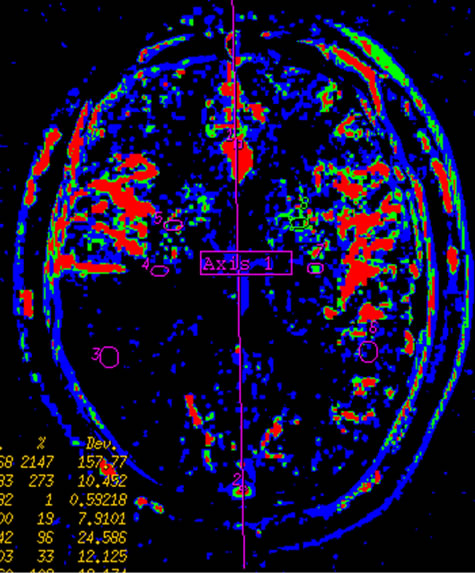 (c)
(c)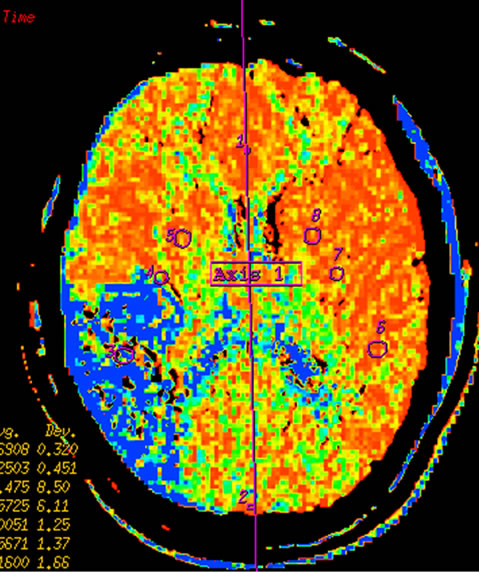 (d)
(d)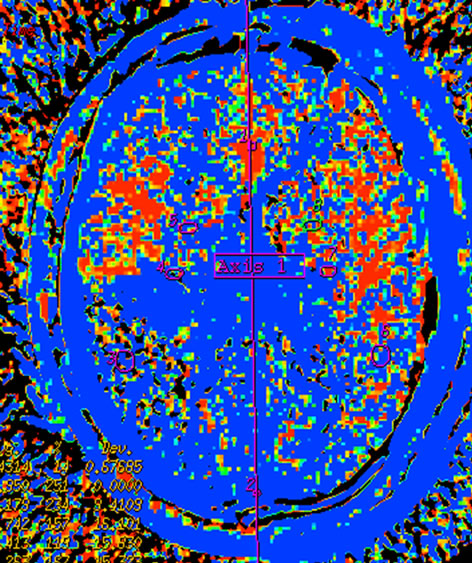 (e)
(e)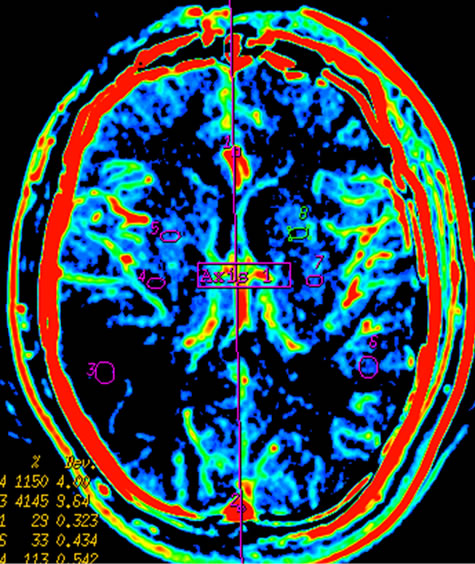 (f)
(f)
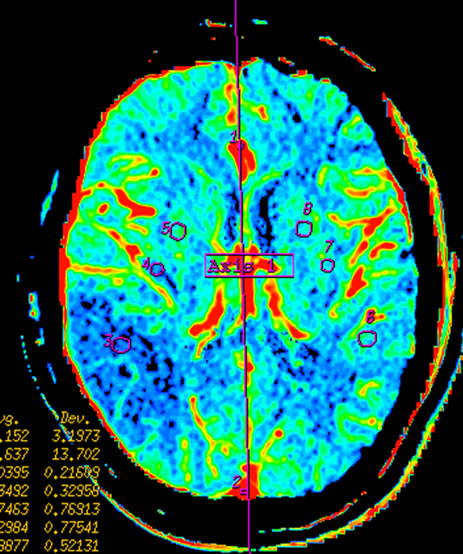
Figure 2. Infarction in right temporal lobe cerebral. Mapping of BF (a), BV (b), MTT (c) on CTP and mapping of BF (d), BV (e), MTT (f) on SCTP all accurately reveals cerebral infarction and adjacent tissue characteristics. Those images are similar.
PS measured on SCTP were smaller, while value of MTT on SCTP was larger. The TDC generated from SCTP were similar to that from CTP, their trends were consistent, while the height of the entire SCTP curve was lower than that of the CTP curve. And, there were no any adverse effects of SCTP on patients.
4. Discussion
Because the TDC, maps and values of tissue hemodynamics functional parameters (BF, BV, MTT or PS) on
 (a)
(a)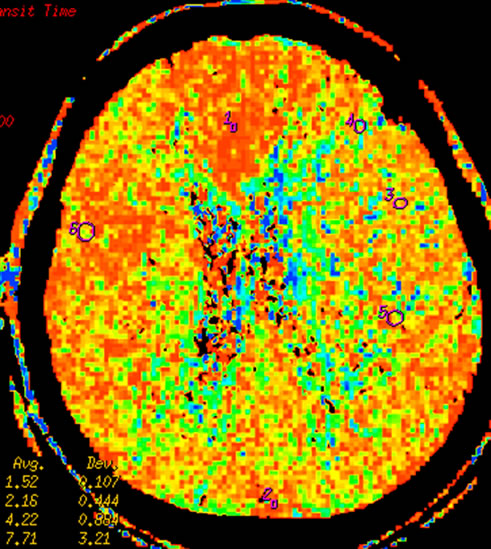 (b)
(b)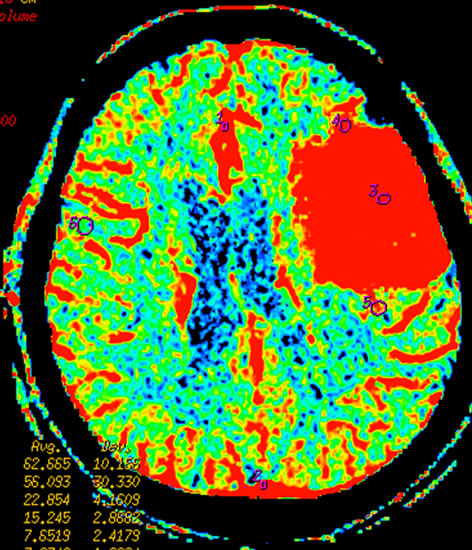 (c)
(c)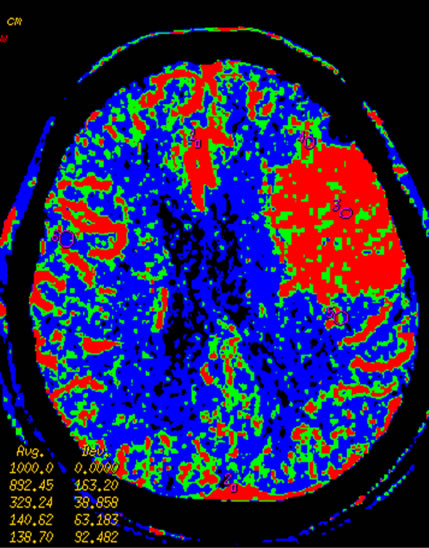 (d)
(d)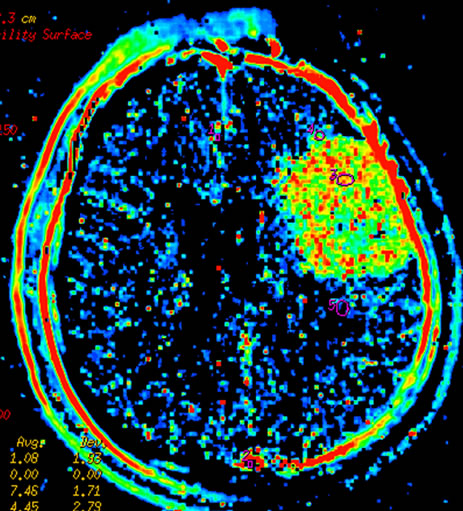 (e)
(e)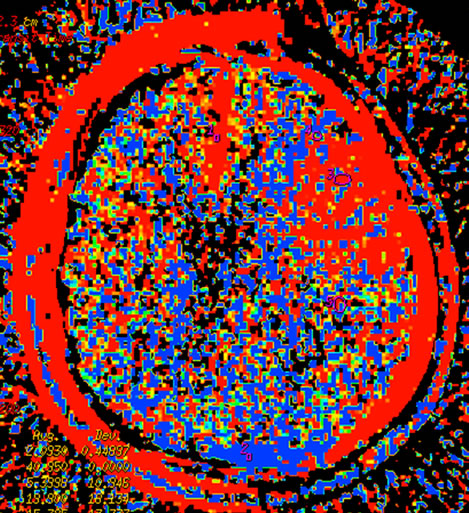 (f)
(f)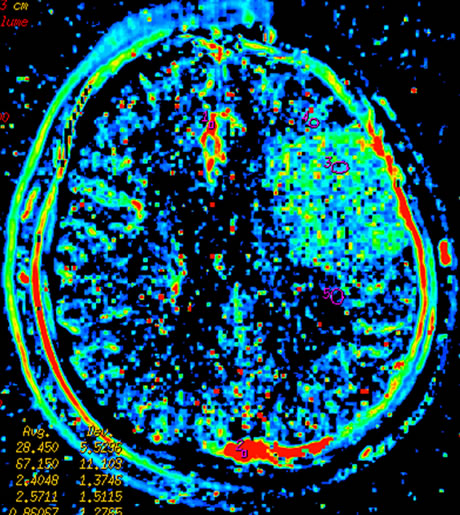 (g)
(g)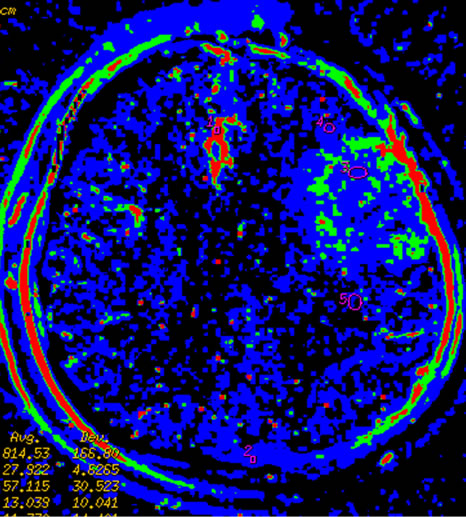 (h)
(h)
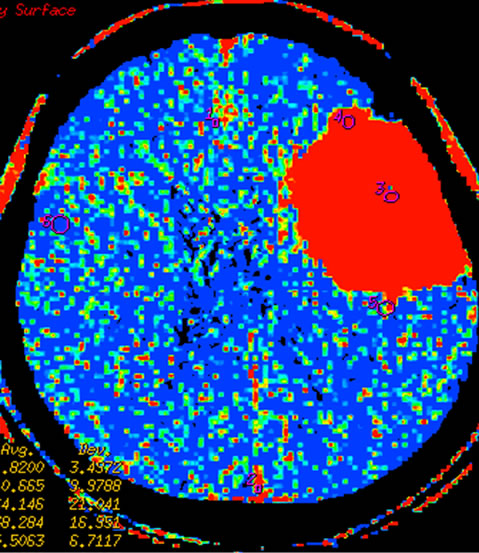
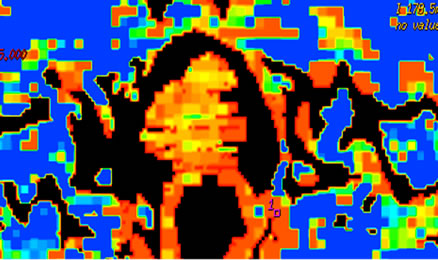
Figure 3 Left temporal region meningioma, mapping of BF (a), BV (b), MTT (c), PS (d) on CTP and mapping of BF (e), BV (f), MTT (g) and PS (h) on SCTP all accurately shows the neoplasm and its rich vascular supply.
 (a)
(a)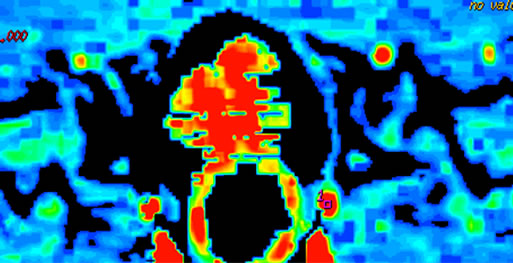 (b)
(b)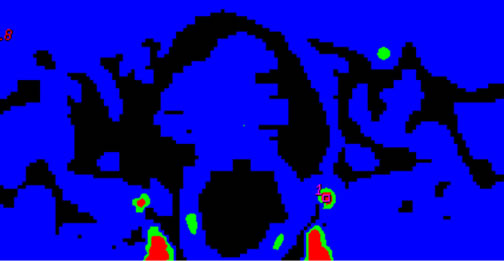 (c)
(c)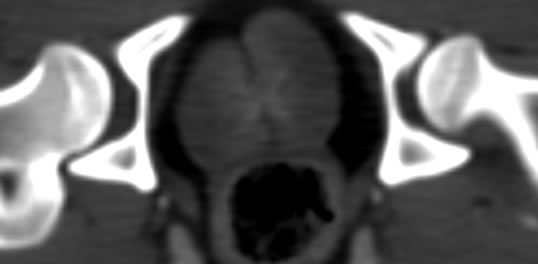 (d)
(d)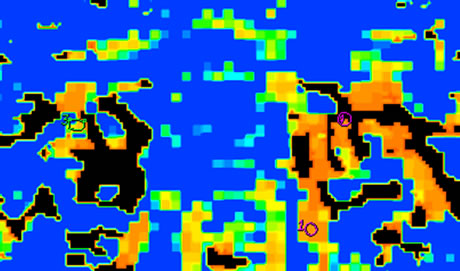 (e)
(e)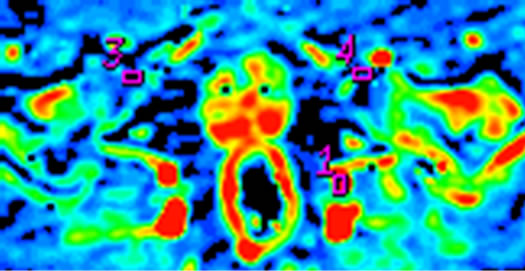 (f)
(f)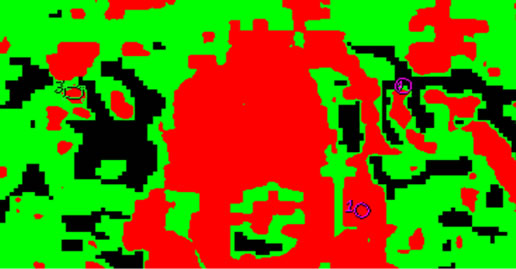 (g)
(g) (h)
(h)
Figure 4. Early osteonecrosis of left experimental canine femoral head. (a) is usual CTP source axial image, which demonstrates the difficulty in interpreting the perfusion images due to underlying hyperdense bone even in bone windows (also, the prostate is not noted). Mapping of BF (b), BV (c), MTT (d) on CTP almost shows no difference in perfusion among local tissue in central osteonecrosis region, and adjacent normal tissue region, the contralateral region. (e) is the SCTP source axial image, bone density is subtracted out, which highlights perfusion image of tissue (prostate is also depicted clearly). Mapping of BF (f), BV (g), MTT (h) on SCTP reveals the osteonecrosis area with decreased perfusion, especially on mapping of BV.
SCTP were acquired from the new data subtractedfrom CTP source images, in theory, SCTP was different from standard CTP due to the different patterns of source images. Thus it can be seen that the SCTP images and analyzes based on the TDC of subtraction CTP source images. And this is main difference in mechanism between SCTP and CTP. The algorithm based on mathematical models in both SCTP and CTP is not different. Compared to conventional CTP, the SCTP clearly highlights post-perfusion changes of organs and tissues, in particular when there are underlying hyperdense tissues. It will be helpful to achieve functional CT quantification of tumor perfusion after transhepatic arterial oil embolization to assess the residual tumor activity. Although more
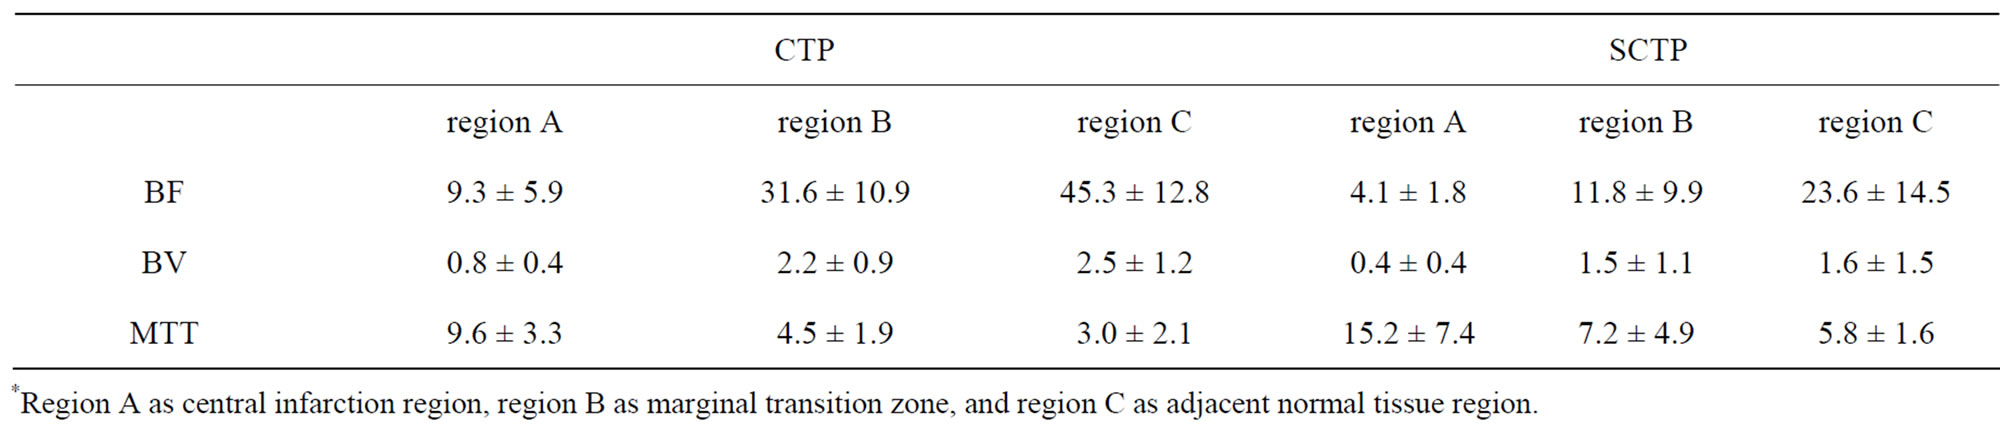
Table 1. The functional index values were measured and observed in stroke.
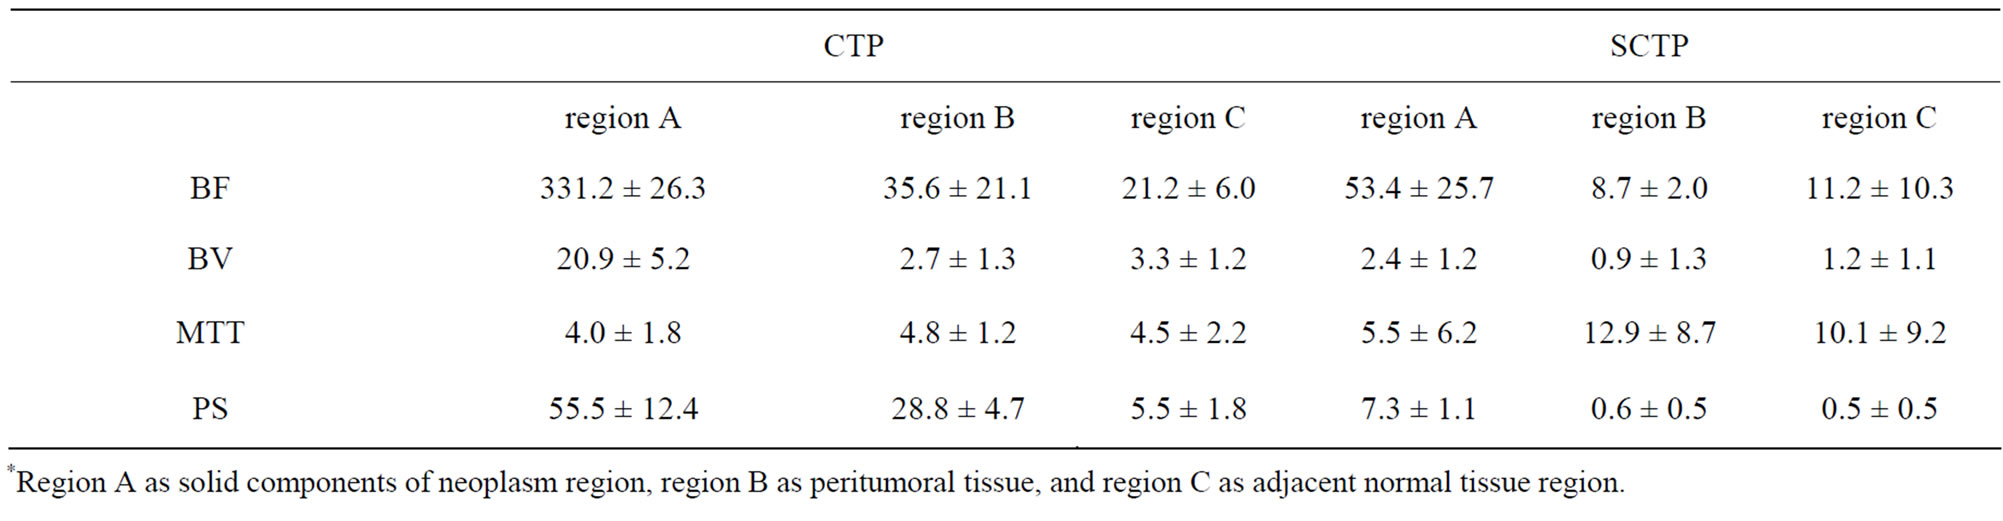
Table 2. The functional index values were measured and observed in meningioma.
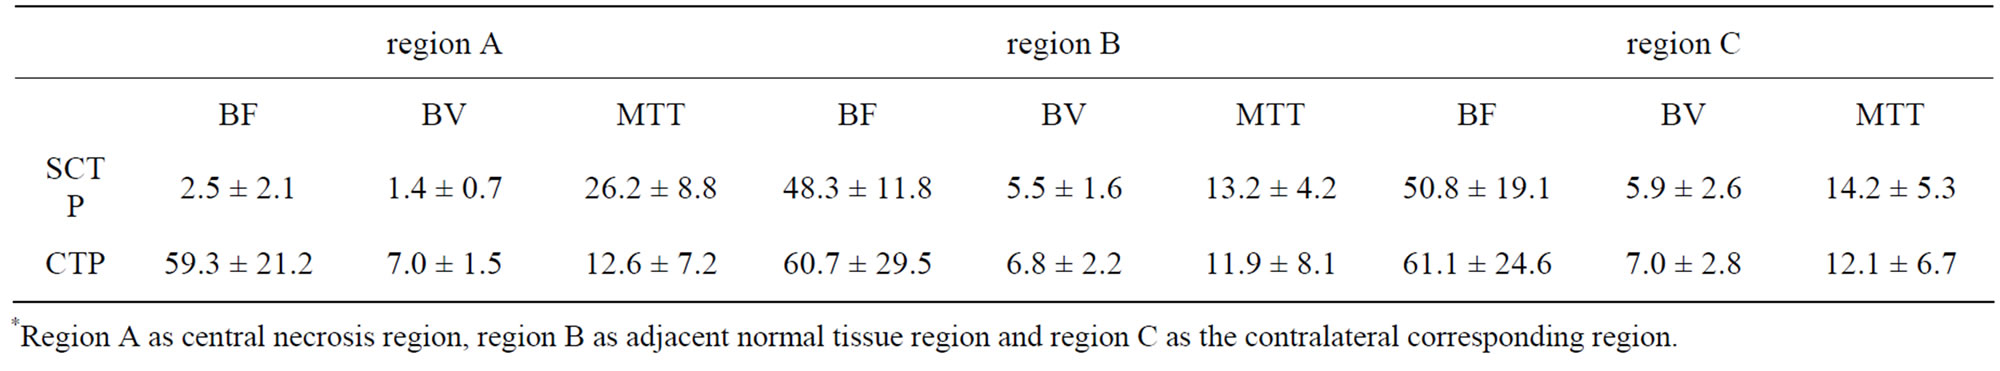
Table 3. The functional index values were measured and observed in ONFH.
time consuming due to much tedious artificial trace of participation of post-processing, the technique of SCTP was feasible but operator dependent. Findings in our preliminary study showed that the TDC graph of SCTP reflected that of CTP, and the derived index values and maps also reflected those of CTP. On SCTP maps, the lesion was better visualized as compared with CTP. Thus, this novel method of SCTP could potentially enhance the routine clinical application of CTP. And this technique can be applied to clinical practice without any increase in radiation, simply using the CTP imaging data without additional CT scanning. In this study, the values of parameters of BF, BV, MTT and PS in same organ and tissue were different between CTP and SCTP; values of BF, BV and PS on SCTP were lower; and value of MTT on SCTP was higher. The analyses of perfusion imaging were not performed to look at the absolute values of parameters of BF, BV, PS and MTT, but rather the relative values derived from comparison of the values in ROI at the same slice between the lesion and peripheral region or contra-lateral side, so SCTP remained to be valid whether values of these parameters on SCTP were larger or smaller than those on CTP.
However, there are several limitations of this technique. The procedure of post-processing of SCTP is complicated and time consuming. If the technique of subtracting the imaging data without contrast from the imaging data of corresponding slice after contrast perfusion could be integrated into CT perfusion software, creating a new one-stop software for SCTP, post-processing time of SCTP could be significantly shortened. And compared to standard CTP [18,19], SCTP are even less tolerant to motion artifacts. In addition, subtraction process may lead to loss of some anatomical, physiological, and pathological information.
5. Conclusion
In summary, the SCTP is technically feasible for CT functional imaging without any adverse effects on patients, and similar to CTP, it provides quantitatively hemodynamic parameters of tissue microcirculation and reflects accurately the change of blood flow in tissues and organs, such as functional index value of BF, BV, MTT and PS. It can be particularly useful in the evaluation of perfusion of hyperdense tissues, such as bone, hematoma, calcification, or tumor after transhepatic arterial embolization with iodized oil. Its exact clinical value needs to be validated and the one-stop analytic software needs to be developed.
REFERENCES
- K. A. Miles, M. Hayball and A. K. Dixon, “Colour Perfusion Imaging: A New Application of Computed Tomography,” Lancet, Vol. 337, No. 8742, 1991, pp. 643-645. doi:10.1016/0140-6736(91)92455-B
- E. G. Hoeffner, I. Case, R. Jain, S. K. Gujar, G. V. Shah, J. P. Deveikis, R. C. Carlos, B. G. Thompson, M. R. Harrigan and S. K. Mukherji, “Cerebral Perfusion CT: Technology and Clinical Applications,” Radiology, Vol. 231, No. 3, 2004, pp. 632-644. doi:10.1148/radiol.2313021488
- V. A. Nagar, A. M. McKinney, A. T. Karagulle and C. L. Truwit, “Reperfusion Phenomenon Masking Acute and Subacute Infarcts at Dynamic Perfusion CT: Confirmation by Fusion of CT and Diffusion-Weighted MR Images,” American Journal of Roentgenology, Vol. 193, No. 6, 2009, pp. 1629-1638. doi:10.2214/AJR.09.2664
- M. Koenig, M. Kraus, C. Theek, E. Klotz, W. Gehlen and L. Heuser, “Quantitative Assessment of the Ischemic Brain by Means of Perfusion-Related Parameters Derived from Perfusion CT,” Stroke, Vol. 32, No. 2, 2001, pp. 431-437. doi:10.1161/01.STR.32.2.431
- S. Diekmann, E. Siebert, R. Juran, M. Roll, W. Deeg, H. C. Bauknecht, F. Diekmann, R. Klingebiel and G. Bohner, “Dose Exposure of Patients Undergoing Comprehensive Stroke Imaging by Multidetector-Row CT: Comparison of 320-Detector Row and 64-Detector Row CT Scanners,” American Journal of Neuroradiology, Vol. 31, No. 6, 2010, pp. 1003-1009. doi:10.3174/ajnr.A1971
- A. R. Kambadakone and D. V. Sahani, “Body Perfusion CT: Technology, Clinical Applications, and Advances,” Radiologic Clinics of North America, Vol. 47, No. 1, 2009, pp. 161-178. doi:10.1016/j.rcl.2008.11.003
- M. Kazuhiro, K. Kazuhiro, N. Masato, H. Toyama, H. Anno, M. Hayakawa, D. S. Ruiz and K. J. Murphy, “Whole-Brain Perfusion CT Performed with a Prototype 256-Detector Row CT System: Initial Experience,” Radiology, Vol. 250, No. 1, 2009, pp. 202-211. doi:10.1148/radiol.2501071809
- R. Gupta, A. C. Cheung, S. H. Bartling, J. Lisauskas, M. Grasruck, C. Leidecker, B. Schmidt, T. Flohr and T. J. Brady, “Flat-Panel Volume CT: Fundamental Principles, Technology, and Applications,” Radiographics, Vol. 28, No. 7, 2008, pp. 2009-2022. doi:10.1148/rg.287085004
- S. Kandel, C. Kloeters, H. Meyer, P. Hein, A. Hilbig and P. Rogalla, “Whole-Organ Perfusion of the Pancreas Using Dynamic Volume CT in Patients with Primary Pancreas Carcinoma: Acquisition Technology, Post-Processing and Initial Results,” European Journal of Radiology, Vol. 19, No. 11, 2009, pp. 2641-2646. doi:10.1007/s00330-009-1453-z
- M. Page, D. Nandurkar, M. P. Crossett, S. L. Stuckey, K. P. Lau, N. Kenning and J. M. Troupis, “Comparison of 4 cm Z-Axis and 16 cm Z-Axis Multidetector CT Perfusion,” European Journal of Radiology, Vol. 20, No. 6, 2010, pp. 1508-1514. doi:10.1007/s00330-009-1688-8
- C. S. Reiner, R. Goetti, D. Eberli, E. Klotz, A. Boss, T. Pfammatter, T. Frauenfelder, H. Moch, T. Sulser, H. Alkadhi, “CT Perfusion of Renal Cell Carcinoma: Impact of Volume Coverage on Quantitative Analysis,” Investigative Radiology, Vol. 47, No. 1, 2012, pp. 33-40. doi:10.1097/RLI.0b013e31822598c3
- P. Zhang, Y. Liang, H. Kim and H. Yokota, “Evaluation of a Pig Femoral Head Osteonecrosis Model,” Journal of Orthopaedic Surgery and Research, Vol. 5, 2010, p. 15. doi:10.1186/1749-799X-5-15
- C. Herweh, E. Jüttler, P. D. Schellinger, E. Klotz and P. Schramm, “Perfusion CT in Hyperacute Cerebral Hemorrhage within 3 Hours after Symptom Onset: Is There an Early Perihemorrhagic Penumbra?” Journal of Neuroimaging, Vol. 20, No. 4, 2010, pp. 350-353. doi:10.1111/j.1552-6569.2009.00408.x
- K. H. Lee, K. B. Sung, D. Y. Lee, S. J. Park, K. W. Kim and J. S. Yu, “Transcatheter Arterial Chemoembolization for Hepatocellular Carcinoma: Anatomic and Hemodynamic Considerations in the Hepatic Artery and Portal Vein,” Radiographics, Vol. 22, No. 5, 2002, pp. 1077- 1091
- S. H. Choi, J. W. Chung, H. C. Kim, J. H. Baek, C. M. Park, S. Jun, M. U. Kim, E. S. Lee, H. R. Cho, H. J. Jae, W. Lee and J. H. Park, “The Role of Perfusion CT as a Follow-Up Modality after Transcatheter Arterial Chemoembolization: An Experimental Study in a Rabbit Model,” Investigative Radiology, Vol.45, No.7, 2010, pp. 427-436. doi:10.1097/RLI.0b013e3181e07516
- Z. Kan, S. Kobayashi, S. Phongkitkarun and C. Charnsangavej, “Functional CT Quantification of Tumor Perfusion after Transhepatic Arterial Embolization in a Rat Model,” Radiology, Vol. 237, No. 1, 2005, pp. 144-150. doi:10.1148/radiol.2371040526
- D. Ippolito, P. A. Bonaffini, L. Ratti, L. Antolini, R. Corso, F. Fazio and S. Sironi, “Hepatocellular Carcinoma Treated with Transarterial Chemoembolization: Dynamic Perfusion-CT in the Assessment of Residual Tumor,” World Journal of Gastroenterology, Vol. 16, No. 47, 2010, pp. 5993-6000
- E. Squillaci, G. Manenti, C. Cicciò, F. Nucera, P. Bove, G. Vespasiani, L. Russolillo and G. Simonetti, “Perfusion-CT Monitoring of Cryo-Ablated Renal Cells Tumors,” Journal of Experimental & Clinical Cancer Research, Vol. 28, 2009, p.138. doi:10.1186/1756-9966-28-138
- C. S. Ng, A. G. Chandler, W. Wei, E. F. Anderson, D. H. Herron, C. Charnsangavej and R. Kurzrock, “Reproducibility of Perfusion Parameters Obtained from Perfusion CT in Lung Tumors,” American Journal of Roentgenology, Vol. 197, No. 1, 2011, pp. 113-121. doi:10.2214/AJR.10.5404
NOTES
*Corresponding author.