Crystal Structure Theory and Applications
Vol.2 No.2(2013), Article ID:33274,8 pages DOI:10.4236/csta.2013.22008
Lab Source Anomalous Scattering Using Cr Kα Radiation
Centre of Advanced Study in Crystallography and Biophysics, University of Madras,
Maraimalai (Guindy) Campus, Chennai, India
Email: *shirai2011@gmail.com
Copyright © 2013 Sibi Narayanan, Devadasan Velmurugan. This is an open access article distributed under the Creative Commons Attribution License, which permits unrestricted use, distribution, and reproduction in any medium, provided the original work is properly cited.
Received March 4, 2013; revised April 5, 2013; accepted April 13, 2013
Keywords: Anomalous Scattering; SAD Phasing; Lysozyme; Glucose Isomerase; Thermolysin
ABSTRACT
High-throughput crystallography requires a method by which the structures of proteins can be determined quickly and easily. Experimental phasing is an essential technique in determining the three-dimensional protein structures using single-crystal X-ray diffraction. In macromolecular crystallography, the phases are derived either by Molecular Replacement (MR) method using the atomic coordinates of a structurally similar protein or by locating the positions of heavy atoms that are intrinsic to the protein or that have been added (MIR, MIRAS, SIR, SIRAS, MAD and SAD). Availability of in-house lab data collection sources (Cu Kα and Cr Kα radiation), cryo-crystallography and improved software for heavy atom location and density modification have increased the ability to solve protein structures using SAD. SAD phasing using intrinsic anomalous scatterers like sulfur, chlorine, calcium, manganese and zinc, which are already present in the protein becomes increasingly attractive owing to the advanced phasing methods. An analysis of successful SAD phasing on three proteins, lysozyme, glucose isomerase and thermolysin based on the signal of weak anomalous scatterers such as sulfur atom and chloride ion have been carried out. This analysis also proves that even the anomalous signal provided or present naturally in a macromolecule is good enough to solve crystal structures successfully using lab source chromium-generated X-ray radiation.
1. Introduction
The sequencing of complete genomes has spurred a growing need for structural information on the encoded gene products that has driven the development of highthroughput crystallography [1-7]. Anomalous scattering methods are currently widely used for phasing macromolecular structures [8]. Experimental phasing is an essential technique in determining the three-dimensional protein structures using single-crystal X-ray diffraction. The power of Single-wavelength Anomalous Diffraction (SAD) was illustrated even 25 years ago and the anomalous signal from six sulfur atoms was used to solve the structure of crambin, a 4.8 kDa protein [9,10]. In recent years, SAD has become the choice for phasing [11-13] after gaining advantage over the Multi-wavelength Anomalous Diffraction, MAD [14]. The SAD approach shares advantage with MAD that all measurements can be made on the same single crystal so that lack of isomorphism does not occur and a single data set at single wavelength is enough [15]. Availability of synchrotron radiation, cryo-crystallography and improved software for heavy atom location and density modification have increased the ability to solve protein structures using SAD. In the absence of synchrotron radiation, SAD method using rotating anode generator (Cu Kα and Cr Kα) lab source data is mostly used to solve the phase problem in X-ray crystallography. Using high redundant data, sufficiently accurate anomalous data can now be collected in the laboratory using Cu Kα and Cr Kα radiations [16-20].
Longer wavelengths than Cu Kα (1.54 Å) would produce a larger signal, but at the same time experimental difficulties may increase as does the noise level in the data [19]. It has been recently reported that data collection wavelengths in the range of λ = 1.5 − 3.0 Å are fairly easy to handle in a diffraction experiment and even at home sources using instant Cr Kα radiation [20]. The use of chromium-anode X-ray radiation is very useful for SAD experiments. The anomalous scattering signal is more than doubled for various metals when compared to conventional copper characteristic wavelength. Furthermore, naturally bound metals and atoms from crystallization solutions tend to show a significant increase in anomalous scattering with chromium radiation [21,22]. Improved data quality helps in exploiting the weak anomalous signal derived only from the sulfurs or in particular from halide ions incorporated by soaking [23].
Most of the sulfur SAD data have been collected on tunable synchrotron beamlines in order to make use of the appreciably larger f″ of sulfur at longer wavelengths in the range between 1.7 - 2.5 Å [24-30] although Cu Kα is also feasible for sulfur SAD phasing [31-33]. Both copper and chromium anode wavelengths (1.54 and 2.29 Å) have been increasingly employed for the same purpose in lab X-ray sources with success [34-36]. Using in-house copper wavelengths and synchrotron beamlines, phasing of protein like lysozyme, glucose isomerase and thermolysin have been carried out [27,28,31].
NaCl and KCl are part of almost every protein buffer and crystallization cocktail. Sulfur atoms and chloride ions are present in almost all known proteins and already been successfully utilized for the SAD phasing of many proteins. On an average, a protein contains 2.4 methionine and 1.7 cysteine residues per 100 amino acids [36], corresponding to an estimated Bijvoet ratio of 1.4% at 2.0 Å wavelength (assuming 7.46 non-hydrogen atoms per amino acid). Many other heavy atoms have also been successfully derivatized for SAD phasing [37-47]. Only rarely are intrinsic S atoms the sole source of the anomalous signal [16,18,48]. However, heavy atom derivatives suffer from nonspecific binding, which results in low occupancy of the heavy-atom sites leading to weak anomalous signal and disruption of the crystal lattice and failure in derivatization.
Exploiting the anomalous signal already present in the native protein or in the solvent would eliminate the extra experimental work via derivatization and would also eliminate the risk of lack of isomorphism. The anomalous signal from different anomalous scatterers present within the SAD data (native lysozyme, native glucose isomerase and native thermolysin) collected at chromium wavelength is used for successful structure solution.
2. Methods
2.1. Crystallization
Hen Egg White Lysozyme (HEWL), Glucose Isomerase
(GI) and Thermolysin (TL) were purchased from Hampton Research Ltd., USA and used without further purification. Crystallization was performed based on the earlier established protocols [49-51]. Crystals were obtained in two days by hanging-drop vapour diffusion method. HEWL crystallized in tetragonal space group, GI crystallized in orthorhombic space group and TL crystallized in hexagonal space group. Before data collection, the crystals were quickly soaked in mother liquor containing cryoprotectant and then mounted into a loop of the required size using a cold nitrogen stream at 100 K. Crystallization, cryoprotectant and soaking conditions are shown in Table 1.
2.2. Data Collection
Three datasets (native HEWL; native GI; native TL) were collected separately using Rigaku R-Axis IV++ image plate detector [52] equipped with Cr Kα (2.29 Å) anode X-ray generator, at CCMB, Hyderabad, India. The crystals were mounted in a random orientation. Crystals diffracted upto 2.53 Å and 360 frames were collected with crystal to detector distance being 110 mm at 0.5˚ oscillation steps and 120 seconds exposure time per frame in each case. The intensity data were collected and analyzed for anomalous signal, substructure solution and binding sites. The intensities were integrated using HKL2000 [53], refining all parameters including crystal mosaicity.
2.3. Substructure Solution, Phase Determination and Model Building
Anomalous scatterers were located using the dual-space recycling algorithm enabled in SHELXD [54-56]. Patterson seeding was used in all cases, resulting in an appreciable improvement in the success rate. 100 cycles of dual-space recycling were performed for the peak search and structure factor calculation. For the location of substructures of anomalous scatterers with SHELXD, only the internal loop which relies on the strongest E magnitudes was used. The best solution obtained with the highest correlation coefficient was directly fed as an input to SHELXE [57] for phase calculation and improvement without further refinement of the atomic positions and their occupancies. The high resolution limit for each data was used for phasing. The poly ala model building
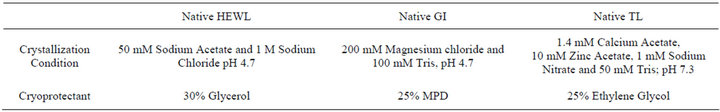
Table 1. Crystallization, soaking concentration and cryoprotectant details.
was carried out using SHELXE beta version. The final quality SHELXE phases were fed as input to ARP/wARP [58] for main-chain tracing and side-chain docking. Clearly interpretable maps were obtained after the automated model building. Manual rebuilding was carried out using COOT [59] and the final model was refined using REFMAC5.0 [60] available in CCP4i suite [61]. Figures were prepared using PyMOL software [62].
3. Results and Discussion
3.1. Data Analysis
The data was processed using HKL2000, by separately merging the anomalous pairs as I+ and I−. The overall redundancy of the data collected to 2.53 Å for the complete datasets varied between 10.3 and 43.49 at high resolution bin. The intensity data were analyzed for the presence of anomalous signal using HKL2MAP [63]. The full resolution range of the data was found to have anomalous signal measurability greater than 14%. The mean signal to noise ratio for all the datasets were found between 19.9 and 57.6.
The completeness of the datasets varied between 98% and 100%. Both the redundancy and completeness play a major role in model building after substructure determination. The substructure solution, phasing and refinement statistics are shown in Table 2. The overall figure of merit ranged from 0.53 to 0.58 for all the datasets. The map correlation coefficient was also found to be higher for all the datasets. The model obtained was manually corrected using COOT and refined using REFMAC5.0. The B-factor (thermal factor) in all the cases or datasets ranged from 10.3 to 39.7. The final model of all the datasets were refined to reasonable Rwork and Rfree values.
All the three datasets were processed and scaled using HKL2000. The scala output obtained was given as input for SHELXC/D/E phasing using CCP4i. At the chromium wavelength of 2.29 Å, a sulfur atom has an  value of 1.14
  and for a chlorine atom,
  = 2.01
  as estimated from program CROSSEC [64]. During the substructure solution of HEWL dataset using SHELXD, fifteen peaks were identified out of which eight peaks correspond to sulfur as there are four disulphide bridges in HEWL. Similarly, seven chloride ions were identified by comparing the chloride ion sites in the earlier reported HEWL structure [31]. The density modified phases were used for model building using the ARP/wARP program web server [53] and refined using REFMAC5.0 of CCP4i software. For the dataset with redundancy 10.6, the automated solution and the model building by ARP/ wARP resulted in building 126 amino acid residues, in which 110 were with side chains indicating that the dataset with reflections collected upto 2.53 Å was sufficient for structure solution and 10 fold redundancy is enough for substructure solution. Final refined model has Rwork = 19.4% and Rfree = 23.6%. The disulphide bonds
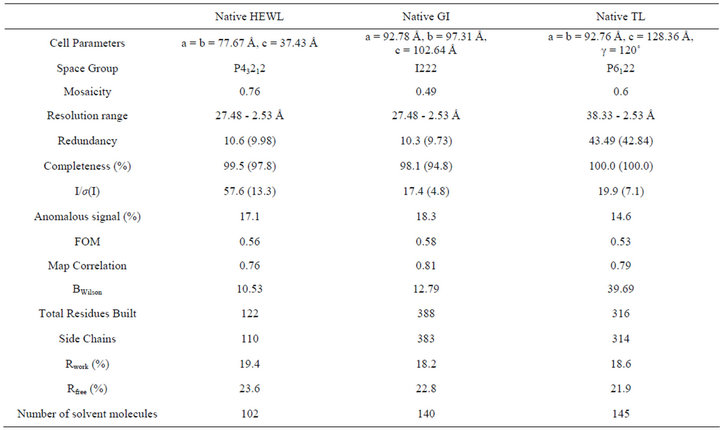
Table 2. Crystal Data Statistics, phasing and model building details.
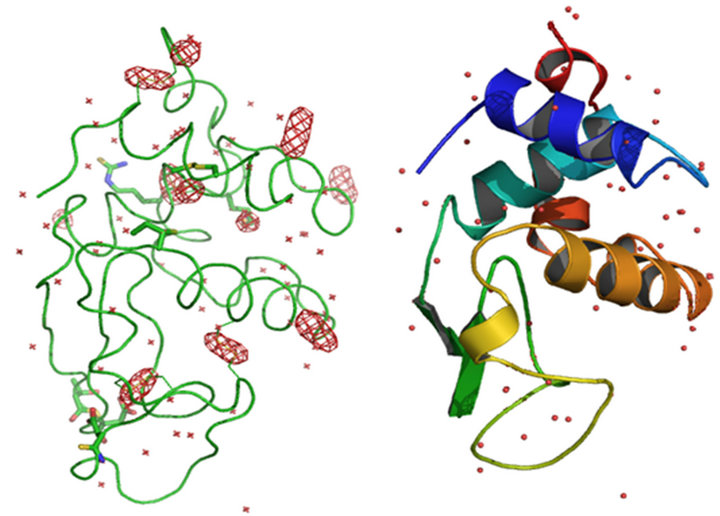
showed clear elliptical density and Met sulfurs showed spherical density. Anomalous map of monomeric HEWL with eight sulfur peaks and seven chloride ions at 5σ with water molecules is shown in Figure 1.
In the native GI data, the anomalous difference map showed significant density for nine sulfur atoms within the protein and an additional peak corresponding to one manganese ion. At the chromium wavelength of 2.29 Å, a manganese ion has a  value of 0.97
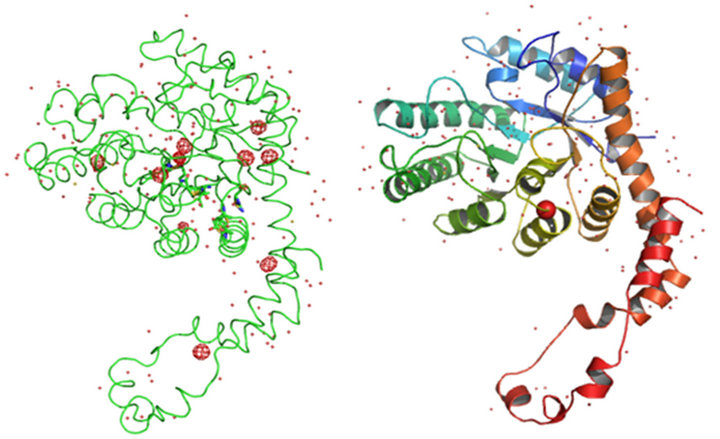
  as estimated from program CROSSEC. Out of nine sulfur atom peaks, eight were of MET sulfurs and one peak was of the CYS. The position of the manganese ion peak was identified by comparing the manganese position or occu- -pied site in the earlier reported GI structures [27]. They were given as input into SHELXE for obtaining the electron density maps. The final maps obtained after density modification were subjected to analysis by ARP/wARP web server for automatic chain tracing and model building. The electron density map allowed ARP/wARP program to build 388 residues, in which 383 were built with side chains. The dataset has a redundancy of 10.3. The dataset with reflections collected upto 2.53 Å was sufficient for structure solution and 10 fold redundancy is enough for substructure solution. Final refined model has Rwork = 18.2% and Rfree = 22.8%. Anomalous map of monomeric GI with nine sulfur atoms and one manganese ion at 5σ with water molecules is shown in Figure 2.
For native TL data, anomalous signals for three calcium ions, one zinc ion and two sulfur atoms were located using SHELXD. At the chromium wavelength of 2.29 Å, a calcium ion has a  value of 3.62
  and for a zinc ion,
  = 2.05
  as estimated from program CROSSEC. The two sulfur atom peaks belonged to the MET sulfurs present in the TL. The positions of the four calcium ion peaks and one zinc ion peak were identified by comparing their respective positions in the earlier
 (a) (b)
Figure 1. Anomalous map (a) and Cartoon representation (b) of monomeric HEWL with eight sulfur peaks and seven chloride ions at 5σ with water molecules.
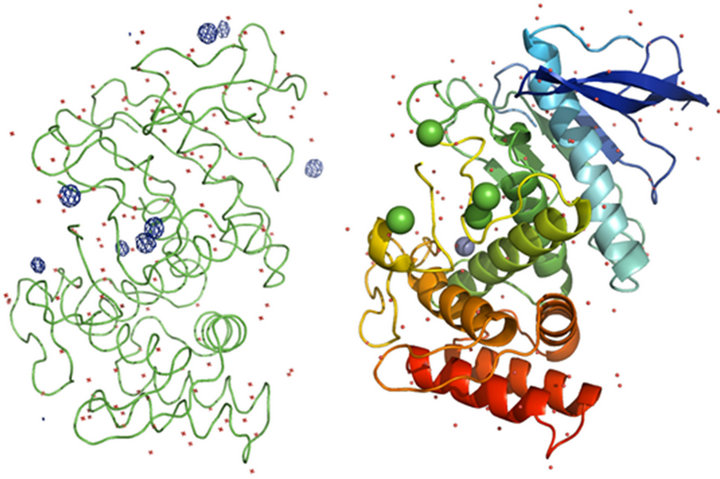
reported TL structures [28]. The density modified phases were used for model building using the ARP/wARP program web server and refined using REFMAC5.0 of CCP4i software. TL dataset had a redundancy of 43.49. Final refined model has Rwork = 18.6% and Rfree = 21.9%. 316 residues were built totally, in which 314 were built with side chains, by the iterative free-atom density modification and model building procedure. Anomalous map of monomeric TL with four calcium ions, one zinc ion and two sulfur atoms at 5σ with water molecules is shown in Figure 3. Crystal data statistics, phasing and model building details are given in Table 2.
SAD phasing has been carried out earlier on proteins like HEWL, GI and TL using synchrotron beamlines and in-house copper wavelengths [27,28,31]. Using in-house chromium X-ray source, HEWL structure was attempted using different mounting techniques [29]. Using in-house chromium wavelength, glucose isomerase structure was also attempted using different solving techniques like ARP/wARP and OASIS2004 [30], but the complete structure could not be solved. Our attempt to collect en-
 (a) (b)
Figure 2. (a) Anomalous map and (b) Cartoon representation of monomeric GI with nine sulfur atoms and one manganese ion at 5σ with water molecules.
 (a) (b)
Figure 3. (a) Anomalous map and (b) Cartoon representation of monomeric TL with four calcium ions, one zinc ion and two sulfur atoms at 5σ with water molecules.
hanced anomalous scattering data of TL using Cr Kα radiation has not been attempted before.
The obstacle so far has been the quality of the data required to take advantage of the vanishingly small signal of the sulfur atom and chloride ions. The location of the S atoms and other metal ions with the integrated Patterson and direct methods implemented in SHELXD is relatively straightforward. The results reveal that anomalous signal enhancers like chlorine and sulfur, which are naturally bound metals can very well contribute and allow easier substructure solution for sulfur SAD phasing. Access to in-house chromium generated X-ray radiation makes it easier to solve protein structures using bound lighter atoms and metals.
4. Conclusions
High-throughput crystallography requires a method by which the structures of proteins can be determined quickly and easily. SAD phasing using intrinsic anomalous scatterers like sulfur, chlorine, calcium, manganese and zinc becomes increasingly attractive owing to the advanced phasing methods. Due to the large anomalous scattering coefficient of the heavy metal ions used with respect to copper wavelength, they prove to be excellent heavy atom markers for automated phasing. Metal ions present in the soaking solution in molar concentrations are well enough to rapidly diffuse or enter into protein crystals. The anomalous scattering signal obtained from such crystals through soaking or co-crystallization within the diffraction data can be utilized for structure solution. The approach is quick as well as efficient. In all the cases discussed above, it was possible not only to locate the anomalous scatterers, but also subsequently to solve the protein model by SAD phasing.
All the collected datasets are of good quality and they have close to 100% completeness. Longer wavelengths not only provide an increased anomalous signal for phase determination, but also allow a much clearer definition of substructures their positions and occupancies, which may turn out to be very important for elucidating the function of a molecule. Data quality is decisive for successful location of the anomalous substructure. The example of successful SAD phasing based on the signal of weak anomalous scatterers such as sulfur atom and chloride ion prove that even the anomalous signal provided or present naturally in a macromolecule is good enough to solve crystal structures successfully using lab source chromium-generated X-ray radiation.
5. Acknowledgements
SN and DV thank UGC (SAP), Government of India for the financial support for this research. DV thanks DST-FIST and UGC-SAP for funding facilities to the Centre for Advanced Study in Crystallography and Biophysics. Chromium datasets were collected at X-ray facility, CCMB, Hyderabad funded by CSIR Facility Creation Project (FAC0004) as part of Eleventh Five Year Plan. SN and DV thank Dr. R. Shankaranarayanan for extending his lab facilities to collect anomalous scattering datasets using Cr Kα radiation.
REFERENCES
- U. Heinmann, G. Illing and H. Oschkinat, “HighThrougput Three-Dimensional Protein Structure Determination,” Current Opinion in Biotechnology, Vol. 12, No. 4, 2001, pp. 348-354. doi:10.1016/S0958-1669(00)00226-3
- P. Kuhn, K. Wilson, M. G. Patch and R. C. Stevens, “The Genesis of High-Throughput Structure-Based Drug Discovery Using Protein Crystallography,” Current Opinion in Chemical Biology, Vol. 6, No. 5, 2002, pp. 704-710 doi:10.1016%2FS1367-5931%2802%2900361-7
- T. L. Blundell, H. Jhoti and C. Abell, “High-Throughput Crystallography for Lead Discovery in Drug Design,” Nature Reviews Drug Discovery, Vol. 1, No. 1, 2002, pp. 45-54. doi:10.1038%2Fnrd706
- J. S. Brunzelle, P. Shafaee, X. Yang, S. Weigand, Z. Ren and W. F. Anderson, “Automated Crystallographic System for High-Throughput Protein Structure Determination,” Acta Crystallographica, Vol. D59, No. 7, 2003, pp. 1138-1144. doi:10.1107%2FS0907444903008199
- B. Rupp, “High-Throughput Crystallography at an Affordable Cost: The TB Structural Genomics Consortium Crystallization Facility,” Accounts of Chemical Research, Vol. 36, No. 3, 2003, pp. 173-181. doi:10.1021%2Far020021t
- T. L. Blundell and S. Patel, “High-Throughput X-Ray Crystallography for Drug Discovery,” Current Opinion in Pharmacology, Vol. 4, No. 5, 2004, pp. 490-496. doi:10.1016%2Fj.coph.2004.04.007
- N. S. Ganapathy and P. K. Andrew, “In-House Sulfur SAD Phasing: A Case Study of the Effects of Data Quality and Resolution Cutoffs,” Acta Crystallographica, Vol. D62, No. 7, 2006, pp. 707-716. doi:10.1107/S0907444906014946
- B.-C. Wang, “Resolution of Phase Ambiguity in Macromolecular Crystallography,” Methods in Enzymology, Vol. 115, 1985, pp. 90-111. doi:10.1016/0076-6879(85)15009-3
- E. J. Dodson, G. G. Dodson, A. Lewitoya and M. Sabesan, “Zinc-Free Cubic Pig Insulin: Crystallization and Structure Determination,” Journal of Molecular Biology, Vol. 125, No. 3, 1978, pp. 387-396. doi:10.1016%2F0022-2836%2878%2990409-6
- W. A. Hendrickson and M. M. Teeter, “Structure of the Hydrophobic Protein Crambin Determined Directly from the Anomalous Scattering of Sulphur,” Nature, Vol. 290, No. 5802, 1981, pp. 107-113. doi:10.1038/290107a0
- L. M. Rice, T. N. Earnest and A. T. Brunger, “SingleWavelength Anomalous Diffraction Phasing Revisited,” Acta Crystallographica, Vol. D56, No. 11, 2000, pp. 1413-1420. doi:10.1107%2FS0907444900010039
- A. Goulet, G. Vestergaard, F. C. Rodrigues, V. Campanacci, R. A. Garrett, C. Cambillau and L. M. Ortiz, “Getting the Best out of Long-Wavelength X-Rays: De Novo Chlorine/Sulfur SAD Phasing of a Structural Protein from ATV,” Acta Crystallographica, Vol. D66, No. 3, 2010, pp. 304-308. doi:10.1107%2FS0907444909051798
- J. Doutch, M. A. Hough, S. S. Hasnain and R. W. Strange, “Challenges of Sulfur SAD Phasing as a Routine Method in Macromolecular Crystallography,” Journal of Synchrotron Radiation, Vol. 19, No. 1, 2012, pp. 19-29. doi:10.1107%2FS0909049511049004
- R. Fourme, W. Shepard and R. Kahn, “Application of the Anomalous Dispersion of X-Rays to Macromolecular Crystallography,” Progress in Biophysics and Molecular Biology, Vol. 64, No. 2, 1995, pp. 167-199. doi:10.1016/S0079-6107(96)00002-8
- E. D. Judit, B. Gabor, Ma. Qingjun, B. Heiko and G. M. Sheldrick, “In-House Measurement of the Sulfur Anomalous Signal and Its Use for Phasing,” Acta Crystallographica, Vol. D59, No. 4, 2003, pp. 688-696. doi:10.1107/S0907444903002646
- C. Yang and J. W. Pflugrath, “Applications of Anomalous Scattering from S Atoms for Improved Phasing of Protein Diffraction Data Collected at Cu Kα Wavelength,” Acta Crystallographica, Vol. D57, No. 10, 2001, pp. 1480-1490. doi:10.1107%2FS0907444901013397
- C. T. Lemke, G. D. Smith and P. L. Howell, “S-SAD, Se-SAD and S/Se-SIRAS Using Cu Kα Radiation: Why Wait for Synchrotron Time?” Acta Crystallographica, Vol. D58, Vol. 12, 2002, pp. 2096-2101. doi:10.1107%2FS0907444902018838
- J. E. Debreczeni, G. Bunkóczi, B. Girmann and G. M. Sheldrick, “In-House Phase Determination of the LimaBean Trypsin Inhibitor: A Low-Resolution Sulfur-SAD Case,” Acta Crystallographica, Vol. D59, No. 2, 2003, pp. 393-395. doi:10.1107/S0907444902020917
- J. G. Olsen, C. Flensberg, O. Olsen, G. Bricogne and A. Henriksen, “Solving the Structure of the Bubble Protein Using the Anomalous Sulfur Signal from Single-Crystal In-House Cu Kα Diffraction Data Only,” Acta Crystallographica, Vol. D60, No. 2, 2004, pp. 250-255. doi:10.1107%2FS0907444903025927
- M. S. Weiss, P. A. Tucker, S. Panjikar, K. D. Carugo, M. Polentarutti and C. Muller-Dieckmann, “On the Routine Use of Soft X-Rays in Macromolecular Crystallography. Part II. Data-Collection Wavelength and Scaling Models,” Acta Crystallographica, Vol. D60, 2004, pp. 28-38. doi:10.1107/S0907444903020833
- O. Carugo and K. Djinovic Carugo, “When X-Rays Modify the Protein Structure: Radiation Damage at Work,” Trends Biochemical Sciences, Vol. 30, No. 4, 2005, pp. 213-219. doi:10.1016%2Fj.tibs.2005.02.009
- C. Yang, J. W. Pflugarth, D. A. Courville, C. N. Stence and J. D. Ferrara, “Away from the Edge: SAD Phasing from the Sulfur Anomalous Signal Measured In-House with Chromium Radiation,” Acta Crystallographica, Vol. D59, No. 11, 2003, pp. 1943-1957. doi:10.1107/S0907444903018547
- J. H. Naismith, et al., “Refined Structure of CadmiumSubstituted Concanavalin A at 2.0 Å Resolution,” Acta Crystallographica, Vol. D49, No. 6, 1993, pp. 561-571. doi:10.1107/S0907444993006390
- J. Brown, R. M. Esnouf, M. A. Jones, J. Linnell, K. Harlos, A. B. Hassan and E. Y. Jones, “Structure of a Functional IGF2R Fragment Determined from the Anomalous Scattering of Sulfur,” The EMBO Journal, Vol. 21, No. 5, 2002, pp. 1054-1062. doi:10.1093/emboj/21.5.1054
- E. J. Gordon, G. A. Leonard, S. McSweeney and P. F. Zagalsky, “The C1 Subunit of Alpha-Crustacyanin: The de Novo Phasing of the Crystal Structure of a 40 kDa Homodimeric Protein Using the Anomalous Scattering from S Atoms Combined with Direct Methods,” Acta Crystallographica, Vol. D57, No. 9, 2001, pp. 1230-1237. doi:10.1107/S0907444901009362
- Z. J. Liu, E. S. Vysotski, C. J. Chen, J. P. Rose, J. Lee and B. C. Wang, “Structure of the Ca2+ Regulated Photoprotein Obelin at 1.7 Å Resolution Determined Directly from Its Sulfur Substructure,” Protein Science, Vol. 9, No. 11, 2000, pp. 2085-2093. doi:10.1110/ps.9.11.2085
- U. A. Ramgopal, M. Dauter and Z. Dauter, “SAD Manganese in Two Crystal Forms of Glucose Isomerase,” Acta Crystallographica, Vol. D59, No. 5, 2003, pp. 868- 875. doi:10.1107/S0907444903005663
- M. S. Weiss, T. Sicker and R. Hilgenfield, “Soft X-Rays, High Redundancy, and Proper Scaling: A New Procedure for Automated Protein Structure Determination via SAS,” Structure, Vol. 9, No. 9, 2001, pp. 771-777. doi:10.1016/S0969-2126(01)00647-5
- Y. Kitago, N. Watanabe and I. Tanaka, “Structure Determination of a Novel Protein by Sulfur SAD Using Chromium Radiation in Combination with a New CrystalMounting Method,” Acta Crystallographica, Vol. D61, No. 8, 2005, pp. 1013-1021. doi:10.1107/S0907444905012734
- N. Watanabe, Y. Kitago, I. Tanaka, J-W. Wang, Y.-X. Gu, C.-D. Zheng and H.-F. Fan, “Comparison of Phasing Methods for Sulfur-SAD Using In-House Chromium Radiation: Case Studies for Standard Proteins and a 69 kDa Protein,” Acta Crystallographica, D61, No. 11, 2005, pp. 1533-1540. doi:10.1107/S0907444905028416
- Z. Dauter, M. Dauter, E. de La Fortelle, G. Bricogne and G. M. Sheldrick, “Can Anomalous Signal of Sulfur Become a Tool for Solving Protein Crystal Structures?” Journal of Molecular Biology, Vol. 289, No. 1, 1999, pp. 83-92. doi:10.1006/jmbi.1999.2743
- K. Sekar, V. Rajakannan, D. Velmurugan, T. Tamane, R. Thirumurugan, M. Dauter and Z. Dauter, “A Redetermination of the Structure of the Triple Mutant (K53, 56, 120M) of Phospholipase A2 at 1.6 Å Resolution Using Sulfur-SAS at 1.54 Å Wavelength,” Acta Crystallographica, Vol. D60, No. 9, 2004, pp. 1586-1590. doi:10.1107/S090744490401697X
- D. Roeser, A. Dickmanns, K. Gasow and M. G. Rudolph, “De Novo Calcium/Sulfur SAD Phasing of the Human Formylglycine-Generating Enzyme Using In-House Data,” Acta Crystallographica, Vol. D61, No. 8, 2005, pp. 1057-1066. doi:10.1107/S0907444905013831
- C. T. Lemke, G. D. Smith and P. L. Howell, “S-SAD, Se-SAD and S/Se-SIRAR Using Cu Kalpha Radiation: Why Wait for Synchrotron Time?” Acta Crystallographica, Vol. D58, No. 12, 2002, pp. 2096-2101. doi:10.1107/S0907444902018838
- G. N. Sarma and P. A. Karplus, “In-House Sulfur SAD Phasing: A Case Study of the Effects of Data Quality and Resolution Cutoffs,” Acta Crystallographica, Vol. D62, No. 7, 2006, pp. 707-716. doi:10.1107/S0907444906014946
- J. Nan, Y. Zhou, C. Yang, E. Brostromer, O. Kristensen and X.-D. Su, “Structure of a Fatty-Acid-Binding Protein from Bacillus Subtilis Determined by Sulfur-SAD Phasing Using In-House Chromium Radiation,” Acta Crystallograhica, Vol. D65, No. 5, 2009, pp. 440-448.
- M. Yogavel, et al., “Structural Analysis of Actinidin and a Comparison of Cadmium and Sulfur Anomalous Signals from Actinidin Crystals Measured Using In-House Copperand Chromium-Anode X-Ray Sources,” Acta Crystallographica, Vol. D66, No. 12, 2010, pp. 1323- 1333. doi:10.1107/S0907444910040394
- I. Uson, et al., “Locating the Anomalous Scatterer Substructures in Halide and Sulfur Phasing,” Acta Crystallographica, Vol. D59, No. 1, 2003, pp. 57-66. doi:10.1107/S090744490201884X
- P. McCaldon and P. Argos, “Oligopeptide Biases in Protein Sequences and Their Use in Predicting Protein Coding Regions in Nucleotide Sequences,” Proteins, Vol. 4, No. 2, 1988, pp. 99-122. doi:10.1002%2Fprot.340040204
- Z. Dauter and M. Dauter, “Anomalous Signal of Solvent Bromides Used for Phasing of Lysozyme,” Journal of Molecular Biology, Vol. 289, No. 1, 1999, pp. 93-101. doi:10.1006%2Fjmbi.1999.2744
- Z. Dauter, M. Dauter and K. R. Rajashankar, “Novel Approach to Phasing Proteins: Derivatization by Short Cryo-Soaking with Halides,”Acta Crystallographica, Vol. D56, No. 2, 2000, pp. 232-237. doi:10.1107/S0907444999016352
- Z. Dauter and M. Dauter, “Entering a New Phase: Using Solvent Halide Ions in Protein Structure Determination,” Structure, Vol. 9, No. 2, 2001, pp. R21-R26. doi:10.1016/S0969-2126(01)00565-2
- S. Korolev, et al., “Using Surface-Bound Rubidium Ions for Protein Phasing,” Acta Crystallographica, Vol. D57, No. 7, 2001, pp. 1008-1012. doi:10.1107%2FS0907444901007302
- R. A. P. Nagem, Z. Dauter and I. Polikarpov, “Protein Crystal Structure Solution by Fast Incorporation of Negatively and Positively Charged Anomalous Scatterers,” Acta Crystallographica, Vol. D57, No. 7, 2001, pp. 996-1002. doi:10.1107%2FS0907444901007260
- T. C. Appleby, et al.,“Structure of Human UridineCytidine Kinase 2 Determined by SIRAS Using a Rotating-Anode X-Ray Generator and a Single Samarium Derivative,” Acta Crystallographica, Vol. D61, No. 3, 2005, pp. 278-284. doi:10.1107%2FS0907444904032937
- J. Jakoncic, et al.,“Anomalous Diffraction at Ultra-High Energy for Protein Crystallography,” Journal of Applied Crystallography, Vol. 39, No. 6, 2006, pp. 831-841. doi:10.1107%2FS0021889806036387
- G. Guncar, et al., “The Use of Co2+ for Crystallization and Structure Determination, Using a Conventional Monochromatic X-Ray Source, of Flax Rust Avirulence Protein,” Acta Crystallographica, Vol. F63, No. 3, 2007, pp. 209-213. doi:10.1107/S1744309107004599
- M. Yogavel,,, et al., “Structural Analysis of Actinidin and a Comparison of Cadmium and Sulfur Anomalous Signals from Actinidin Crystals Measured Using In-House Copperand Chromium-Anode X-Ray Sources,” Acta Crystallographica, Vol. D66, No. 12, 2010, pp. 1323- 1333. doi:10.1107/S0907444910040394
- J. E. Debreczeni, G. Bunkoczi, Q. Ma, H. Blaser and G. M. Sheldrick, “In-House Measurement of the Sulfur Anomalous Signal and Its Use for Phasing,” Acta Crystallographica, Vol. D59, No. 4, 2003, pp. 688-696. doi:10.1107/S0907444903002646
- K. N. Vennila and D. Velmurugan, “In-House SAD Phasing with Surface-Bound Cerium Ions,” Acta Crystallographica, Vol. F67, No. 12, 2011, pp. 1662-1665. doi:10.1107/S1744309111035718
- V. Dhanasekaran and D. Velmurugan, “SAD Phasing with In-House Cu Kα Radiation Using Barium as Anomalous Scatterer,” Indian Journal of Biochemistry and Biophysics, Vol. 48, No. 6, 2011, pp. 399-405.
- Z. Dauter, M. Dauter, E. de La Fortelle, G. Bricogne and G. M. Sheldrick, “Can Anomalous Signal of Sulfur Become a Tool for Solving Protein Structures?” Journal of Molecular Biology, Vol. 28, No. 1, 1999, pp. 83-92. doi:10.1006%2Fjmbi.1999.2743
- H. L. Carrell, H. Hoier and J. P. Glusker, “Modes of Binding Substrates and Their Analogues to the Enzyme D-Xylose Isomerase,” Acta Crystallographica, Vol. D50, No. 113, 1994, pp. 113-123. doi:10.1107%2FS0907444993009345
- C. Mueller-Dieckmann, et al., “On the Routine Use of Soft X-Rays in Macromolecular Crystallography. Part IV. Efficient Determination of Anomalous Substructures in Biomacromolecules Using Longer X-Ray Wavelengths,” Acta Crystallographica, Vol. D63, 2007, pp. 366-380. doi:10.1107%2FS0907444906055624
- Rigaku Americas, “New Trails Drive,” The Woodlands, Texas, pp. 77381-5209.
- Z. Otwinowski and W. Minor, “Processing of X-Ray Diffraction Data Collected in Oscillation Mode,” In: C. W. Carter Jr. and R. M. Sweet, Eds., Methods in Enzymology, Vol. 276, Macromolecular Crystallography, Part A, Academic Press, New York, 1997, pp. 307-326. doi:10.1016/S0076-6879(97)76066-X
- G. M. Sheldrick, H. A. Hauptman, C. M. Weeks, M. Miller and I. Uson, “Ab Initio Phasing,” In: E. Arnold and M. Rossman, Eds., International Tables for Crystallography, Vol. F, Chapter 16.1, IUCr and Kluwer Academic Publishers, Dordrecht, 2001, pp. 333-345. doi:10.1107/97809553602060000689
- I. Uson and G. M. Sheldrick, “Advances in Direct Methods for Protein Crystallography,” Current Opinion in Structure Biology, Vol. 9, No. 5, 1999, pp. 643-648. doi:10.1016/S0959-440X(99)00020-2
- G. G. Langer, S. X. Cohen, A. Perrakis and V. S. Lamzin, “Automated Macromolecular Model Building for X-Ray Crystallography Using ARP/wARP Version 7,” Nature Protocols, Vol. 3, No. 7, 2008, pp. 1171-1179. doi:10.1038/nprot.2008.91
- [61] P. Emsley and K. Cowtan, “Coot: Model-Building Tools for Molecular Graphics,” Acta Crystallographica, Vol. D60, No. 12, 2004, pp. 2126-2132. doi:10.1107%2FS0907444904019158
- [62] A. A. Vagin, et al., “REFMAC5 Dictionary: Organization of Prior Chemical Knowledge and Guidelines for Its Use,” Acta Crystallographica, Vol. D60, No. 12, 2004, pp. 2284-2295. doi:10.1107%2FS0907444904023510
- [63] CCP4 (Collaborative Computational Project, Number 4), “The CCP4 Suite: Programs for Protein Crystallography,” Acta Crystallographica, Vol. D50, No. 5, 1994, pp. 760- 763. doi:10.1107/S0907444994003112
- [64] W. L. DeLano, “The PyMOL Molecular Graphics System,” DeLano Scientific, San Carlos, 1998.
- [65] T. Pape and T. R. Schneider, “HKL2MAP: A Graphical User Interface for Macromolecular Phasing with SHELX Programs,” Journal of Applied Crystallography, Vol. 37, No. 5, 2004, pp. 843-844. doi:10.1107%2FS0021889804018047
- [66] T. C. Don, “Calculation of Anomalous Scattering Factors at Arbitrary Wavelengths,” Journal of Applied Crystallography, Vol. 16, No. 4, 1983, pp. 437. doi:10.1107/S0021889883010791
NOTES
*Corresponding author.