Pharmacology & Pharmacy
Vol.09 No.09(2018), Article ID:87662,20 pages
10.4236/pp.2018.99030
Formulation Development and In-Vivo Evaluation of Atorvastatin Calcium Solid Dispersion in Streptozotocin Induced Diabetic Mice
Md. Shahin Sarker1, Ranjan Kumar Barman1, Md. Ashraf Ali2, Shuji Noguchi3, Yasunori Iwao4, Shigeru Itai4, Mir Imam Ibne Wahed1*
1Department of Pharmacy, Faculty of Science, University of Rajshahi, Rajshahi, Bangladesh
2Department of Pharmacy, Mawlana Bhasani University of Science of Technology, Tangail, Bangladesh
3Laboratory of Pharmaceutics, Faculty of Pharmaceutical Sciences, Toho University, Chiba, Japan
4Department of Pharmaceutical Engineering and Drug Delivery Science, School of Pharmaceutical Sciences, University of Shizuoka, Shizuoka, Japan

Copyright © 2018 by authors and Scientific Research Publishing Inc.
This work is licensed under the Creative Commons Attribution International License (CC BY 4.0).
http://creativecommons.org/licenses/by/4.0/


Received: August 10, 2018; Accepted: September 27, 2018; Published: September 30, 2018
ABSTRACT
Atorvastatin calcium (ATV) is a selective competitive inhibitor of HMG CoA reductase characterized by poor aqueous solubility leading to inadequate bioavailability. The present study was designed to develop solid dispersion of atorvastatin (SDA) to improve the solubility and dissolution properties of ATV and evaluation of its in-vivo efficiency in streptozotocin (STZ) induced diabetic mice. Formulations of SDA were prepared by solvent evaporation method using PEG-4000 alone and/or mixture of PEG-4000 and Carplex-80 as carrier in different ratios. Solid-state analyses of SDA were performed to characterize the physicochemical properties of newly developed SDA by differential scanning calorimetry (DSC), powder x-ray diffractometry (PXRD), fourier transformed infrared spectra (FTIR) and scanning electron microscopy (SEM). DSC and PXRD showed that the crystallinity of drugs was notably decreased during the preparation of SDA. FTIR and SEM also demonstrated the conversion of ATV from amorphous to crystalline state resulting in improved solubility. Among formulations, SDA-5 showed significant enhancement of in-vitro drug release (around 2 fold higher) as compared to pure ATV. Further, in-vivo study was conducted to evaluate the effects of a newly developed ATV loaded solid dispersion on glycemic control, lipid profile, liver enzyme and histopathology in STZ induced diabetic mice. Oral administration of SDA significantly lowered the blood glucose levels during the course of treatment. Treatment with SDA significantly improved lipid profiles better than ATV alone and the effect was dose-dependent. After one week of SDA treatment significantly decreased liver weights as result of lipid clearance and the hepatocytes regained their normal architecture, and these beneficial effects can be correlated with the reduction of SGPT levels. The results demonstrated that, SDA exerted better glycemic control, lipid lowering effect and organ protection (liver and pancreas) than that of conventional ATV in STZ induced diabetic mice. The mechanism by which SDA conferred better improvement in diabetic conditions can be partially explained by enhancement of solubility and dissolution rate when ATV is loaded in solid dispersion.
Keywords:
Solid Dispersion, Atorvastatin, Poor Aqueous Solubiity, Streptozotocin, Diabetic Mice

1. Introduction
Most of the newly discovered chemical entities, in spite of therapeutic activity, have low aqueous solubility and poor membrane permeability leading to poor absorption in the gastrointestinal tract (GIT) as well as bioavailability in systemic circulation [1] . A drug with poor aqueous solubility will typically exhibit dissolution rate limited absorption and/or permeation rate limited absorption even though it shows good aqueous solubility. Hence, two areas of pharmaceutical research that can focus on improving the oral bioavailability of active pharmaceutical ingredients include enhancing aqueous solubility leading to increased dissolution rate of poorly water-soluble drugs and enhancing permeability of poorly permeable drugs [2] .
Atorvastatin (ATV), a synthetic lipid-lowering agent, is an inhibitor of 3-hydroxy-3-methylglutaryl coenzyme A (HMG-CoA) reductase which catalyzes the conversion of HMG-CoA to mevalonate, an early rate-limiting step in cholesterol biosynthesis [3] [4] . It belongs to BCS class II drug having high permeability but low aqueous solubility and is associated with a poor bioavailability and a short half-life [5] . In order to get beneficial therapeutic effects, its water solubility needs to be increased. Thus, formulation of ATV should be such that it has enough aqueous solubility. ATV is the most preferred drug among statins used to treat moderate to severe familial or non-familial hypercholesterolemia [3] [4] . It is also indicated for different types of cardiovascular disease [6] [7] [8] . It was reported that ATV treatment lower blood sugar in diabetic mice accompanied by the benefits of insulin enhancement and body weight increment [9] .
Many approaches have been developed to improve solubility and thus, to enhance the dissolution rate and oral bioavailability of poorly soluble drugs [10] - [15] . Physical modifications often aimed to increase the surface area, solubility and wettability of the powder particles and are therefore, focused on particle size reduction and/or conversion to amorphous states. In many studies, it is reported that amorphous systems is efficient for the enhancement of dissolution and bioavailability. Solid dispersion (SD) is a unique and promising approach for improving the oral absorption and bioavailability of atorvastatin [16] - [22] . The SD enhances the drug solubility by various mechanisms either by reducing the particle size or improving bioavailability or increasing porosity and converting the crystalline forms of drug into amorphous form. Although SD technique was used to improve the solubility and dissolution rate of ATV but recently a number of formulations have been developed for the enhancement of solubility and dissolution profile of the drug [13] [14] [23] [24] . Therefore, the aims of the study were to enhance the solubility and dissolution profile of the ATV by preparing atorvastatin calcium solid dispersion (SDA) and in-vivo evaluation of its efficacy in STZ induced diabetic mice.
2. Materials and Methods
2.1. Materials
STZ was purchased from Sisco Research Laboratories Pvt. Ltd. (India) and silica (Carplex-80) was purchased from Merck Company (Germany). Serum total cholesterol (TC), triglycerides (TG), high density lipoprotein (HDL) and serum glutamate pyruvate transaminase (SGPT) was determined using commercial kit purchased from Human Company (Germany). Pure ATV, used as a research sample, was a generous donation by Square Pharmaceuticals Ltd. Pabna, Bangladesh. All other chemicals and solvents used were of analytical grade.
2.2. Preparation of SDA
The SDA was prepared using the solvent evaporation method at different ratio of drug and carrier (Table 1). Briefly, accurately weighed ATV powder was dissolved in appropriate volume of ethanol into which variable amounts of PEG-4000 and/or combination of both PEG-4000 and Carplex-80 were added and dispersed in the drug solution under continuous stirring by magnetic stirrer with 200 rpm at 50˚C to allow proper loading of the drug into carrier and to evaporate the solvent from the dispersion system. After complete evaporation of

Table 1. Formulations of SDA using different drug-carrier ratios.
Group-I: SDA containing PEG-4000, Group-II: SDA containing mixtures of PEG-4000 and silica (Carplex-80).
the solvent, the resultant SDA was dried at room temperature and crushed in a mortar to obtain fine powder and stored in a screw-cap vial at room temperature until further study.
2.3. In-Vitro Dissolution Study
The pharmaceutical performance of pure ATV in powder form and SDA was evaluated using in vitro dissolution tests. The tests were performed according to the USP 24 method 2 (paddle method) using a dissolution tester (Tianjin Guoming Medicinal Equipment Co., Ltd.). The media employed for testing dissolution was water. Sample equivalent to 25 mg ATV powder was spread onto the surface of the dissolution medium (500 ml), which was thermostatically maintained at 37.0˚C ± 0.5˚C with 50 rpm.
At the specified times (5, 15, 30, 45, 60, 90, and 120 min), 10 ml samples were withdrawn from dissolution vessel and filtered, from which 1 ml of solution is transferred to a volumetric flask and diluted to 5 times for assaying ATV content by measuring absorbance at 245 nm using a UV-spectrophotometer. An equal volume of water was replaced immediately to keep the volume of dissolution medium constant. Three replicates of each dissolution test were carried out and calculated mean values of cumulative drug release were used while plotting the release profile. To determine the concentration of ATV a standard calibration curve was plotted using 5 standard concentrations (1 µg/ml, 3 µg/ml, 5 µg/ml, 10 µg/ml and 20 µg/ml). Also, three replicates of each dissolution test were carried out and mean values were calculated. The mean concentration of ATV was plotted against time to derive the dissolution profile. The standard solution was prepared by dissolving 25 mg ATV in 50 ml methanol and mixed properly. From the solution appropriate quantity of aliquot was transferred to 50 ml volumetric flask and diluted with methanol to get the desired concentration of 1 µg/ml, 3 µg/ml, 5 µg/ml, 10 µg/ml and 20 µg/ml.
2.4. Characterization of Prepared SDA
2.4.1. Differential Scanning Calorimetry (DSC)
Thermo-grams of ATV, PEG-4000, Carplex-80, PEG-4000 + Carplex-80 and the SDA were obtained from DSC (Exstar SII DSC7020, Hitachi High-Tech Science Corporation, Tokyo, Japan). Each sample (3 - 5 mg) were placed in sealed standard aluminum pans and heated from 0˚C to 296˚C, at a scanning rate of 10˚C/min, under nitrogen purge, with an empty aluminum pan as reference.
2.4.2. Powder X-Ray Diffraction (PXRD)
An X-ray diffractometer (RAD-C, Rigaku Denki Co. Ltd., Tokyo, Japan) was used for the diffraction studies. The samples were exposed to Cu-Kα radiation (30 kV, 50 mA) and scanned from 3˚ - 40˚, 2θ at a scanning rate of 5˚/min. Samples used for PXRD analysis were pure ATV, PEG-4000, Carplex-80, PEG-4000 + Carplex-80 and the SDA.
2.4.3. Fourier Transformed Infrared Spectroscopy (FTIR)
The nature of drug-carrier interactions in the SDA were monitored using IR spectra measured by the diffuse reflection method using an FTIR spectrometer (IR-Prestige 21, Shimadzu Co. Japan). Disk of samples ATV, PEG-4000, Carplex-80, PEG-4000 + Carplex-80 and SDA were prepared by grounding and thoroughly mixed with potassium bromide. The scanning range was 400 to 4000 cm−1 and the resolution was 1 cm−1.
2.4.4. Scanning Electron Microscopy (SEM)
The shape, surface, and cross-sectional morphology of ATV, PEG-4000, Carplex-80, PEG-4000 + Carplex-80 and the SDA were observed using a scanning electron microscope (SSX-500, Shimadzu, and Tokyo, Japan) after platinum metallization. An accelerating voltage of 15 kV was used.
2.5. Experimental Animals
Six-week old female Swiss Albino female mice (28 - 31 gm) were purchased from animal Center, Department of Pharmacy, Jahangirnagar University, Savar, Dhaka, Bangladesh. The mice were kept in animal cages under standard environmental conditions (22˚C - 25˚C, humidity 60% - 70%, 12 hr light: 12 hours dark cycle). The mice were acclimated for 2 weeks and given standard rodent chow and water ad libitum. Throughout, the study the animals were cared in accordance with the guidelines for animal experimentation. The experimental protocol was approved by Institutional Animal, Medical Ethics, Biosafety and Biosecurity Committee (IAMEBBC) at the Institute of Biological Sciences, University of Rajshahi, Bangladesh.
2.6. Protocol Design
To prepare the experimental diabetic animals, the mice were fasted for 12 hours, then freshly prepared STZ solution (dissolved in sodium citrate buffer; pH 4.2) was given into mice by intraperitoneal injection (60 mg/kg, body weight) for five consecutive days. After overnight fasting, blood glucose levels were measured by glucometer (One Touch Ultra, Japan) using a blood sample from tail-vein of mice. Blood glucose levels that were higher than 300 mg/dl considered as diabetic mice [25] . Among the six formulations, SDA-5 (ATV + PEG-4000 + Carplex-80, 1:2:3 ratios) was used for in-vivo studies on the basis of its greater dissolution rate as compared to other formulations and/or pure ATV.
After induction of diabetes, rats were divided into four groups for the oral administration of drugs and/or vehicle and the groups were as follows: 1) diabetic control (Group DC, 0.5% methyl cellulose), 2) diabetic rats treated with pure ATV (Group ATV, 10 mg/kg body weight), 3) diabetic rats treated with low-dose of SDA (Group SDA-L, SDA-5 equivalent to 1 mg/kg body weights of ATV); and 4) diabetic rats treated with high-dose of SDA (Group SDA-H, SDA-5 equivalent to 10 mg/kg body weights of ATV). ATV, SDA or vehicle (mixture of PEG-4000 and Carplex-80 at the 2:3 ratios by weight dispersed in 0.5% MC) were orally administered into mice by gastric gavage once daily for 7 days. Age-matched normal mice were used as control (Group NC, 0.5% MC) and each group comprised of five animals (n = 5).
2.6.1. Measurement of Body Weights, Organ Weights and Glucose Level
The body weight (BW) and fasting blood glucose level of mice from each group was measured on 0, 1, 3, 5, and 7 day. At the end of the experiments all mice were fasted overnight with free access of water. Animals were anesthetized using diethyl ether, chest opened and blood samples were withdrawn directly from abdominal aorta at retroperitoneal space and poured into blood collecting tube [26] . The blood samples were centrifuged at 4000 rpm for 10 minutes (Ultra-centrifuge, Centurion, UK) and the serum samples were stored at −40˚C until further biochemical estimation. After sacrificing liver and pancreas were removed and cleaned of the surrounding tissues. The organ weights (OW) were measured immediately and the ratio of organ weights to body weight ratio (gm/kg) were calculated. Then, the parts of liver and pancreas were stored in 10% formalin for histopathology.
2.6.2. Biochemical Estimations
The serum concentration of TC, TG and HDL were measured colorimetrically by photometric colorimeter (ERMA Inc., Japan) using commercially available wet reagent diagnostic kits (Human, Germany). Serum low density lipoprotein (LDL) was determined from TC, TG and HDL by using Friedewald formula [27] :
The concentration of SGPT was determined quantitatively by photometric method using commercial kit (Human, Germany).
2.6.3. Histopathological Study
The histopathological studies of liver and pancreas were carried out at the Department of Pathology, Rajshahi Medical College, Rajshahi, Bangladesh. Briefly, livers from each group were fixed in PBS containing 10% formalin. The tissues were washed in running tap water, dehydrated in the descending grades of isopropanol and finally cleared in xylene. The tissues were then embedded in molten paraffin wax. After embedding in paraffin, several transverse sections (5 μm) were cut from the mid organ level by microtome machine and stained with hematoxylin-eosin (HE). The specimens were observed under light microscope with digital camera for any structural changes and the microscopic photographs were processed using software provided by Optika Co., Italy.
2.7. Statistical Analysis
Data were expressed as mean ± standard error of mean (SEM). Comparisons among more than two groups were performed by one way analysis of variance (ANOVA) followed by Tukey’s post test. The differences were considered as significant when p < 0.05. All statistical analysis was performed by MS Office Excel and GraphPad Prism software.
3. Results
3.1. In-Vitro Dissolution Study
The drug release data obtained for ATV and formulations SDA-1 to SDA-6 are shown in Table 2. After 120 min, the cumulative percent drug released was higher with SDA-1 to SDA-6 than that of pure ATV. From the in vitro drug release profile, it can be seen that formulation SDA-5 showed higher dissolution rate compared with other formulations at all time points.
The graphical representation of SDA-1, SDA-2 and SDA-3 with pure ATV was depicted in Figure 1(a) and SDA-4, SDA-5 and SDA-6 with pure ATV was depicted in Figure 1(b) showing greater drug release from SDA-1 to SDA-6 of which SDA-5 demonstrated maximum cumulative and faster release compared to pure ATV.
3.2. Solid State Characterization of SDA
3.2.1. DSC Thermal Analysis
DSC thermograms of pure ATV, PEG-4000, Carplex-80, mixture of PEG-4000 and Carplex-80 (2:3) and optimized SD formulations of SDA-2 and SDA-5 are shown in Figure 2. The sharp endothermic peak at 166.41˚C was found for ATV indicating the melting point of the drug. In DSC thermogram of SDA-2, no endothermic peak for ATV was observed but showed a peak at 59.36˚C corresponding to PEG-4000. Whereas there is no peak was observed for SDA-5 at 166.41˚C corresponding to the peak of pure drug. But an endothermic peak at 55.92˚C was observed for the mixture of PEG-4000 and Carplex-80, which may be due to interaction between the silica and PEG-4000. These results
Table 2. In-vitro dissolution profile of pure ATV and different formulations of SDA.
Data expressed as means ± SEM. SDA-1 (ATV:PEG-4000 ratio 1:1), SDA-2 (ATV:PEG-4000 ratio 1:2), SDA-3 (ATV:PEG-4000 ratio 1:3), SDA-4 (ATV:PEG-4000:Carplex-80 ratio 1:2:2, SDA-5 (ATV:PEG-4000:Carplex-80 ratio 1:2:3) and SDA-6 (ATV:PEG-4000:Carplex-80 ratio 1:2:4).

Figure 1. In-vitro dissolution profile of pure ATV with (a) SDA-1, SDA-2 and SDA-3 and (b) SDA-4, SDA-5 and SDA-6.

Figure 2. Differential scanning calorimetry curves of ATV, PEG-4000, Carplex-80, PEG-400 + Carplex-80, SDA-2 and SDA-5.
recommended that there might be a transformation of ATV from crystalline to amorphous state upon formation of SDA.
3.2.2. PXRD Analysis
The PXRD patterns of Pure ATV exhibited sharps peak with high intensity at 2θ scattered 9.8˚, 10.22˚, 11.92˚, 16.96˚, 19.4˚, 21.52˚, 23.26˚, 23.64˚ and 29.22˚ indicating a highly crystalline powder. The carrier PEG-4000 also showed two sharp peaks for crystallinity at 19.36˚ and 23.72˚, whereas another carrier Carplex-80 showed no peak for crystallinity. Upon preparation of SDA formulation most of the crystallinity peak of ATV was demolished except for the peaks of PEG-4000 indicating the conversion of crystalline ATV to amorphous state (Figure 3).
3.2.3. FTIR Spectral Analysis
FTIR spectrum explored the interaction between pure drug and carrier after SDA preparation (Figure 4). An interactive change (N-H stretching) was observed around 2875 cm−1 resulting the reduce intensity of the peak (2875 cm−1) of PEG-4000 in formulation SDA-2. But a significant N-H stretching was observed at similar wavelength resulting the disappearance of that peak in SDA-5.
3.2.4. SEM Analysis
The SEM photographs of pure ATV, PEG-4000, Carplex-80, mixture of PEG-4000 and Carplex-80 (2:3) and optimized SDA formulations are shown in Figure 5. Upon preparation of SD a distinct conversion of crystalline ATV to amorphous state was explored with morphology of SDA formulation. Also, there were a
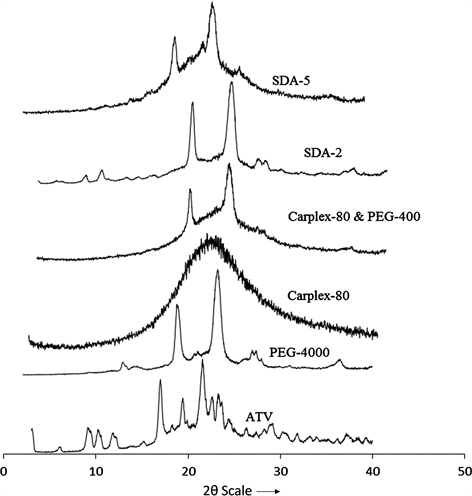
Figure 3. Powder X-ray diffraction patterns of ATV, PEG-4000, Carplex-80, PEG-4000 + Carplex-80, SDA-2 and SDA-5.
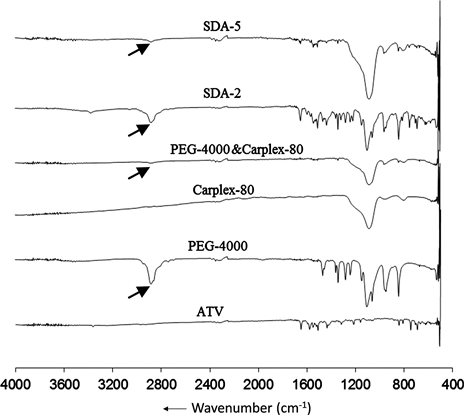
Figure 4. Fourier transformed infrared spectra of ATV, PEG-4000, Carplex-80, PEG-4000 + Carplex-80, SDA-2 and SDA-5.
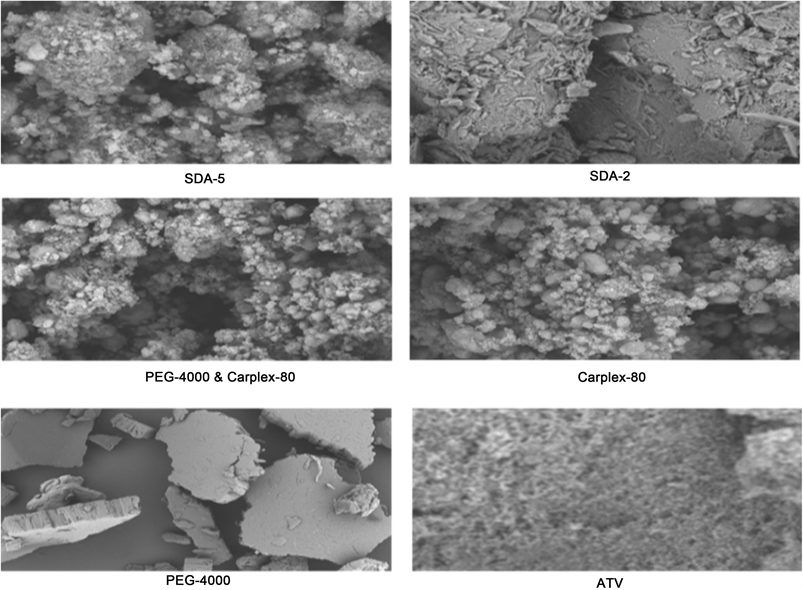
Figure 5. Scanning electron microscopy of ATV, PEG-4000, Carplex-80, PEG-4000 + Carplex-80, SDA-2 and SDA-5.
clear network like structure observed in SDA-2 and SDA-5 that facilitated the water adsorption, and thus increased the aqueous solubility of ATV.
3.3. In-Vivo Evaluation
3.3.1. Clinical Course
The survival rates in mice among the treatment groups were 100%. None of the mice died in groups SDA, ATV, and vehicle treated DC mice. No sign of physiological and pathological changes were observed during course of treatment.
3.3.2. Changes of Blood Glucose Levels in STZ Induced Diabetic Mice
Time course of changes in blood glucose levels are given in Table 3. On day 0, before the initiation of treatment the blood glucose levels were significantly higher in STZ induced diabetic mice compared to normal mice (p < 0.001). Oral administration of SDA and ATV significantly lowered the blood glucose levels on days 3, 5 and 7 when compared to DC mice and the effect was dose dependent. Among the treatment groups SDA-H shown most significant attenuation of blood glucose level and the effects of SDA-L on blood glucose level was comparable that of ATV.
3.3.3. Effects of SDA on Body Weight and Organ Weights in Diabetic Mice
Body weight, organ weights and organ weight to body weight ratios are summarized in Table 4. The body weights and pancreas weight were lower and liver
Table 3. Changes in blood glucose levels after 7 days of oral administration SDA in STZ induced diabetic mice.
Data expressed as means ± SEM. †p < 0.05, ††p < 0.01 and †††p < 0.001 vs. NC; *p < 0.05, **p < 0.01 and ***p < 0.001 vs. DC.
Table 4. Changes in body weight and organ weight after 7 days of oral administration of SDA in STZ induced diabetic mice.
Data expressed as means ± SEM. BW, means body weight; LW, liver weight, PW, pancreas weight, LB−1, ratio of liver weight to body weight; PB−1, ratio of pancreas weight to body weight. †p < 0.05, ††p < 0.01 and †††p < 0.001 vs. NC; *p < 0.05, **p < 0.01 and ***p < 0.001 vs. DC.
weight was higher in group DC than that of group NC mice. Although, treatment with SDA and pure ATV increased body weight, pancreas weight and pancreas weight to body weight ratio and decreased liver weight and liver weight to body weight ratio, the group SDA-H showed significant reduction in liver weight and liver weight to body weight ratio.
3.3.4. Effects of SDA on Lipid Profile and SGPT Levels in Diabetic Mice
The changes in lipid profile and SGPT levels are shown in Table 5. The data revealed that the levels of TC, TG and LDL were significantly higher and HDL levels were significantly lower in Group DC than that of NC mice.
The increment of TC, TG, LDL and LDL/HDL ratio was significantly attenuated and the level of HDL was increased after oral ingestion of SDA. The Group SDA-H exhibited greater improvement in lipid profile among the treatment groups. The effects of pure ATV on TC, TG, and HDL were comparable to that of SDA-L.
The DC mice showed higher levels of SGPT indicating inflammation and/or damage in liver. However, administrations of both low and high doses of SDA significantly reduced SGPT levels and were comparable to NC mice. Although treatment with ATV reduced SGPT levels, the effects were not significant.
3.3.5. Histopathology
Representative photomicrographs of thin sections of liver and pancreas stained with hematoxylin-eosin are presented in Figure 6 and Figure 7. Liver from DC mice showed intracellular accumulation of lipids and infiltration. In group NC, intact hepatocytes were visualized with normal cellular architecture. Mice treated with ATV showed partial disappearance of lipid, attenuation of cellular swelling and inflammation. However, reduction of inflammations and lipid clearance were observed after treatment with SDA of which SDA-H showed greater improvement in cellular architecture and was comparable to NC mice
The islets from mice of groups DC showed cellular damaging due to the extensive inflammations with complete loss of architecture of pancreatic β-cell. There was a reduction in the size and number of the islets in untreated DC mice.
Table 5. Changes in lipid profile after 7 days of oral administration of SDA in STZ induced diabetic mice.
Data expressed as means ± SEM. TC, Total Cholesterol; TG, serum triglyceride; HDL, high density lipoprotein; LDL, low-density lipoprotein; LDL/HDL, ratio of low density lipoprotein and high density lipoprotein. †p < 0.05, ††p < 0.01 and †††p < 0.001 vs. NC; *p < 0.05, **p < 0.01 and ***p < 0.001 vs. DC.
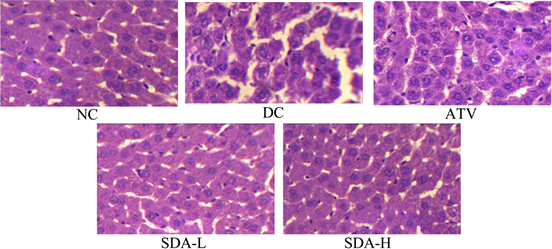
Figure 6. Effects of ATV and SDA on liver. Hematoxylin and eosin staining of the cross sectional tissue slices of liver depicting lipid deposition in the liver of STZ induced diabetic mice. Original magnifications 400×. Group NC, age-matched normal mice treated with vehicle; Group DC, diabetic mice treated with vehicle; Group ATV, diabetic mice treated with ATV (10 mg/kg/day); Group SDA-L, diabetic mice treated with low dose of SDA (equivalent to 1 mg/kg ATV/day); Group SDA-H, diabetic mice treated with high dose of SDA (equivalent to 10 mg/kg ATV/day).
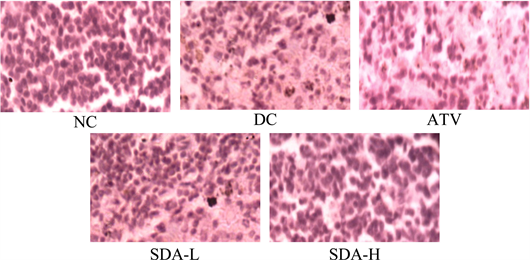
Figure 7. Effects of ATV and SDA on pancreas. Hematoxylin and eosin staining of the cross sectional tissue slices of pancreas depicting β-cell damage in the pancreas of STZ induced diabetic mice. Original magnifications 400×. Group NC, age-matched normal mice treated with vehicle; Group DC, diabetic mice treated with vehicle; Group ATV, diabetic mice treated with ATV (10 mg/kg/day); Group SDA-L, STZ induced mice treated with low dose of SDA (equivalent to 1 mg/kg ATV/day); Group SDA-H, diabetic mice treated with high dose of SDA (equivalent to 10 mg/kg ATV/day)
The diabetic mice treated with SDA restored normal cellular population size of islets, absence of islets damage and presence of hyperplasia. The group ATV mice also showed mild to moderate reduction of necrosis of the islets of pancreas.
4. Discussion
Drug release is a crucial and limiting step in oral drug bioavailability especially for drugs with low gastrointestinal solubility and high membrane permeability. The rate of dissolution of active ingredients exhibiting poor aqueous solubility is a fundamental determinant of rate of absorption, and hence oral bioavailability. Pure ATV exhibits an unpredictable and slow absorption rate that may in turn reflect considerable intra-and-inter subject variability due to its low aqueous solubility. Also, the therapeutic use of ATV is limited due to the toxicity with usual dose (10 mg orally once daily) including liver dysfunction, rhabdomyolysis, gastrointestinal disturbences etc. Various efforts aimed to improve solubility and dissolution rate of ATV have been reported [13] [14] [23] [24] . One approach involves the preparation of SDA using different carriers by the application of various methodologies such as fusion techniques, co-grinding, solvent melting and solvent evaporation methods. Previous studies have shown that the formation of SD is a promising strategy for increasing the dissolution rate and solubility of the drugs [2] [28] [29] . Recently, PEG-4000 has been reported to be a step ahead for enhancing drug dissolution and oral bioavailability of ATV [16] . Carplex is a popular adsorbent and has been known to improve wettebility and dissolution rate of BCS class-II drug [30] . The rationale of the present study was to investigate the use of mixture of PEG-4000 and Carplex-80 (2:3) as a carrier for the preparation of SDA by solvent evaporation method with the objectives of improving dissolution rate of ATV and in-vivo evaluation of SDA in STZ induced diabetic mice.
In our study, SD of ATV was prepared by the solvent evaporation method using PEG-4000 and mixture of PEG-4000 and Carplex-80 as carrier (Table 1). The physicochemical properties of SD were investigated using differential scanning calorimetry (DSC), X-ray powder diffraction (PXRD), Fourier transforms infrared spectroscopy (FTIR) and scanning electron microscopy (SEM). Our results indicated that the percentage release of ATV from SDA-5 reached around 2 fold higher than that of pure ATV in water medium. This result implied that the hydrophilic properties of PEG-4000 and adsorbent properties Carplex-80 may contributed to the improved wettability and enhanced dissolution of drugs from the SDA. Accordingly, both the amorphous state of the drug and the good wettability of SDA might account for the faster dissolution rate of SDA compared with pure ATV. Whereas, other SDA formulations cannot release the drug significantly after 120 minutes as compared to SDA-5.
Furthermore, the in-vitro dissolution result of our study (Table 2 and Figure 1) hence justified the use of effective surface area of carriers for enhancing the dissolution and subsequently its oral bioavailability of ATV in SDA. The improvement of dissolution rate of ATV in SDA was confirmed using different methods and various mechanisms. Commonly, reducing the particle size of the drug is an established mechanism to increase the bioavailability. The mechanism through which crystalline state of ATV is converted to amorphous state was proved using DSC and PXRD analyses. Previously, it was suggested that the drug molecules were adsorbed onto the surface of the porous materials due to the mixing or heating method converting to amorphous state [31] [32] . In DSC thermograms of SDA-5, the complete disappearance of the sharp endothermic peak corresponding to ATV was observed at 166.41˚C, which suggested that ATV in SDA might be converted to the amorphous state. PXRD was performed to elucidate the crystal behavior of drug in the SDA formulation and there were many distinct reflections in the diffractogram for pure ATV at 2θ scattered 9.8˚, 10.22˚, 11.92˚, 16.96˚, 19.4˚, 21.52˚, 23.26˚, 23.64˚ and 29.22˚ highlighting its crystalline nature. However, most of these peaks disappeared in the PXRD spectra of SDA-5 except for the peak of PEG-4000, also suggesting that ATV was in an amorphous state. Durgaprasad Mauray et al. reported that chemical bonding between the silanol groups of silica and both carbonyl groups and amino groups of ATV were demonstrated using FTIR, also suggesting that this interaction (around 2875 cm−1) could improve the wettability properties of the drug and further increase drug dissolution rates [33] . FTIR spectrum of SDA-5 explored that a significant interactive change (N-H stretching) was observed around the wavelength of 2875 cm−1. Upon preparation of SD a distinct conversion of crystalline ATV to amorphous state was explored with morphology of SDA-5 formulation which was confirmed by SEM because the residual crystals of ATV were not observed in the SDA-5 photomicrograph, suggesting that the differences in phase images between ATV and SDA can potentially be attributed to adsorption of amorphous ATV onto the surface of silica particles.
The results of DSC thermograms, PXRD patterns and FTIR analysis revealed that complete conversion of crystalline state of ATV to amorphous form occurred with SDA-2 and SDA-5 due to interaction of the drug with the carriers at around 2875 cm−1. Between these two formulations, SDA-5 showed maximum drug release than SDA-2 due to the presence of the additional carrier Carplex-80. Here, the role of Carplex-80 might be assumed as an adsorbent carrier which facilitates the release of drug. Our findings suggested that mixture of PEG-4000 and Carplex-80 (2:3) is a promising carrier to achieve enhanced dissolution rate for drugs with poor solubility, which may provide a basis for carrying further research work in future and understanding different kind of biopharmaceutical profile of drug.
Furthermore, the safety and efficacy of newly developed SDA (Atorvastatin:PEG-4000:Carplex-80, 1:2:3) were confirmed in experimental animal model. The effects of different doses of SDA on survival rate, glucose homeostasis, lipid metabolism, body weight, organ structure were examined in states of metabolic syndrome after 7 days of oral administration in STZ-induced diabetic mice. The results of this study indicated that the survival rate in mice among the treatment groups were 100% after 7 days of oral administration of SDA and/or ATV.
In the present study, STZ-induced diabetic mice resulted in significant hyperglycemia, hypoinsulinemia and weight loss, indicating that diabetic was implicated in metabolic disorder and serious malabsorption syndrome. Furthermore, chronic high blood glucose can lead to a series of adverse comorbidities, such as kidney impairment, neurological lesion, and cardiovascular risks [34] . In hyperglycemia-mediated diabetes, therapeutic strategy aims to maintain blood glucose close to normal level, in order to reduce the worsened outcomes. After 7 days of SDA administration, fasting diabetic mice showed significant reduction (p < 0.001) in blood glucose levels but of which SDA-H showed profound hypoglycemic effect. While STZ-induced diabetic mice treated with ATV did not exhibit much more alterations in their glucose levels as compared with SDA. Our findings were in accordance with previous study of P. Mataforme et al. who reported that ATV therapy lower blood sugar in diabetic mice accompanied by the benefits of insulin enhancement and body weight increment [9] . STZ-induced diabetic causes decreased in body weight, pancreas weight but increased in liver weight. After 7 days of treatment with SDA increased body weights, pancreas weights and pancreas weight to body weight ratios, but the effects were not significant. Furthermore, treatment with SDA significantly decreased liver weight and liver weight to body weight ratio than that of ATV group.
Dyslipidemia is regarded as a potential risk factor for diabetes or cardiovascular disease [35] . High-density lipoprotein (HDL) containing lipid and protein components show biologically active roles, such as inhibition of oxidative stress and inflammation and may protects against diabetes [36] . Low-density lipoprotein (LDL) deposition increases the risk for cardiovascular disorder related to damaged endothelium and existed oxidized stress. Similarly, increasing LDL concentrations may result in emergence of diabetes [37] . Therefore, effectively controlling lipoprotein cholesterol level in the body contributed to reducing diabetic risks. STZ-induced diabetic mice demonstrated an unregulated dyslipidemia with high level of LDL, resulting from hyperglycemia and hypoinsulinemia. Our results showed that, STZ-induced diabetic mice have significantly higher levels of TC, TG and LDL. After oral administration of SDA, TC, TG and LDL levels were significantly atteneued with an increased level of HDL. Although ATV treatment decreased TC, TG, LDL and increased HDL, but the effects were lower than SDA-H. As we know, ATV, a competitive inhibitor of HMG-CoA reductase, restricts the enzyme decrease in de novo cholesterol biosynthesis and up-regulates the expression of LDL receptors in kidney cells, then lowering the LDL-cholesterol content and increasing HDL cholesterol level. D. Ahmed et al. reported that ATV showed a highly significant fall in the levels of serum cholesterol, triglycerides, and LDL-cholesterol in STZ induced diabetic rats [38] . Together, these SDA mediated benefits might have improved metabolism of glucose and insulin in diabetic mice.
In histopathology study, liver from DC mice showed cellular inflammations and accumulation of lipids which was evidenced by increased in liver weight and expression of higher SGPT levels. Hepatotoxicity is associated with the activation of many membrane damaging enzymes like ATPase, phospholipases, proteases and endonucleases, disruption of mitochondrial metabolism and ATP synthesis; and damage of microfilaments used to support cell structure [39] . Administration of SDA significantly reduced SGPT levels, the effects of ATV on SGPT levels was not significant. Although, ATV alone could not preserved liver architecture in STZ induced diabetic mice, administration of SDA conferred sufficient protection against liver damage. Further, SDA restored normal cellular populations and attenuation of islets damage. The SDA might have some protective effects on liver and pancreas which may be partially imparted due to its ability to reduce oxidative stress in STZ induced diabetic mice.
We demonstrated that SDA (Atorvastatin:PEG-4000:Carplex-80, 1:2:3) as well as ATV showed significant glucose lowering efficacy and improvement in lipid profile in STZ induced diabetic mice. Moreover, SDA exerted significant attenuation of liver weight, liver weight to body weight ratio and SGPT level. The effect of SDA on glucose levels, lipid profile and liver enzymes was dose dependent. Our results showed that SDA exerted better glycemic control, lipid lowering effects and organ protection than that of conventional ATV in STZ induced diabetic mice. The reason by which SDA improved diabetic conditions can be partially explained by enhancement of dissolution rate when ATV is loaded in SD, physicochemical characteristics and finally in vivo evaluation data. Among the six formulations SDA-5 afforded faster drug release (46%) after 5 minutes and maximum (69%) cumulative drug release after 120 minutes, which were much higher than other formulations. Here, drug release was a function of the relative hydrophobicity (or solubility) of Carplex-80 and PEG-4000 as carrier when present in optimum ratio. Further, the conversion of crystalline to amorphous state is more in SDA-5 than other formulations and there was a clear network like structure observed in SDA-5 that facilitated the water adsorption, increasing the aqueous solubility and ultimately bioavailability of ATV when loaded in SD.
5. Conclusion
Preparation of SD of ATV using mixture of PEG-4000 and Carplex-80 (1:2:3) as carrier significantly improved dissolution rate, and showed faster and increased drug release. Administration of SDA improved blood glucose level, lipid profiles and liver function better than the conventional ATV in STZ induced diabetic mice. In addition, SDA prevented the development of hyperglycemia, dyslipidemia and ameliorated hepatic inflammation and pancreatic damage during the progression of diabetese. So, SDA played an important role in the treatment of STZ induced diabetic mice. The results of the study suggested that, this newer formulation of ATV might be safe and effective alternative to conventional dosage forms ATV in patients with diabetes with abnormal lipid profile. However, further pharmacokinetic studies are required to elucidate the precise mechanism of actions of SDA in STZ induced diabetic mice.
Acknowledgements
This research was supported by National Science and Technology (NST) fellowships offered by the Ministry of Science and Technology (MOST), Bangladesh.
Conflicts of Interest
The authors declare that they have no conflict of interests.
Cite this paper
Sarker, Md.S., Barman, R.K., Ali, Md.A., Noguchi, S., Iwao, Y., Itai, S. and Wahed, M.I.I. (2018) Formulation Development and In-Vivo Evaluation of Atorvastatin Calcium Solid Dispersion in Streptozotocin Induced Diabetic Mice. Pharmacology & Pharmacy, 9, 395-414. https://doi.org/10.4236/pp.2018.99030
References
- 1. Lipinski, C.A. and Lombardo, F. (1997) Experimental and Computational Approaches to Estimate Solubility and Permeability in Drug Discovery and Development Settings. Advanced Drug Delivery Reviews, 23, 3-25. https://doi.org/10.1016/S0169-409X(96)00423-1
- 2. Leuner, C. and Dressman, J. (2000) Improving Drug Solubility for Oral Delivery Using Solid Dispersions. European Journal of Pharmaceutics and Biopharmaceutics, 50, 47-60. https://doi.org/10.1016/S0939-6411(00)00076-X
- 3. Malhotra, H.S. and Goa, K.L. (2001) Atorvastatin: An Updated Review of Its Pharmacological Properties and Use in Dyslipidaemia. Drugs, 61, 1835-1881. https://doi.org/10.2165/00003495-200161120-00012
- 4. Lea, A.P. and McTavish, D. (1997) Atorvastatin: A Review of Its Pharmacology and Therapeutic Potential in the Management of Hyperlipidemias. Drugs, 53, 828-847. https://doi.org/10.2165/00003495-199753050-00011
- 5. Lennernas, H. (2003) Clinical Pharmacokinetics of Atorvastatin. Clinical Pharmacokinetics, 42, 1141-1160. https://doi.org/10.2165/00003088-200342130-00005
- 6. Taylor, F., Huffman, M.D., Macedo, A.F., Moore, T.H., Burke, M., Davey Smith, G., Ward, K. and Ebrahim, S. (2013) Statins for the Primary Prevention of Cardiovascular Disease. Cochrane Database of Systematic Reviews, 1, CD004816.
- 7. Croom, K.F. and Plosker, G.L. (2005) Atorvastatin: A Review of Its Use in the Primary Prevention of Cardiovascular Events in Patients with Type 2 Diabetes Mellitus. Drugs, 65, 137-152. https://doi.org/10.2165/00003495-200565010-00015
- 8. Curran, M.P. (2010) Amlodipine/Atorvastatin: A Review of Its Use in the Treatment of Hypertension and Dyslipidaemia and the Prevention of Cardiovascular Disease. Drugs, 70, 191-213. https://doi.org/10.2165/11204420-000000000-00000
- 9. Matafome, P., Monteiro, P., Nunes, E., Louro, T., Amaral, C., Moedas, A.R., Gonçalves, L., Providencia, L. and Seiça, R. (2008) Therapeutic Association of Atorvastatin and Insulin in Cardiac Ischemia: Study in a Model of Type 2 Diabetes with Hyperlipidemia. Pharmacological Research, 58, 208-214. https://doi.org/10.1016/j.phrs.2008.07.005
- 10. Gibaldi, M. and Feldman, S. (1970) Mechanisms of Surfactant Effects on Drug Absorption. Journal of Pharmaceutical Sciences, 59, 579-589. https://doi.org/10.1002/jps.2600590502
- 11. Higuchi, W.I., Lau, P.K., Higuchi, T. and Shell, J.W. (1963) Polymorphism and Drugs Availability, Solubility Relationships in the Methylprednisolone System. Journal of Pharmaceutical Sciences, 52, 150-153. https://doi.org/10.1002/jps.2600520210
- 12. Fincher, J.H. (1968) Particle Size of the Drugs and Its Relationships to Absorptions and Activity. Journal of Pharmaceutical Sciences, 57, 1825-1835. https://doi.org/10.1002/jps.2600571102
- 13. Louis, D. (2016) Formulations and Evaluation of Nanocrystals of a Lipid Lowering Agent. Iranian Journal of Pharmaceutical Research, 15, 71-82.
- 14. Bathool, A., Vishakante, G.D., Khan, M.S. and Shivakumar, H.G. (2012) Development and Characterization of Atorvastatin Calcium Loaded Chitosan Nanoparticle for Sustain Drug Delivery. Advanced Materials Letters, 3, 466-470. https://doi.org/10.5185/amlett.2012.icnano.153
- 15. Narasaiah, L., Reddy, K., Raj Kumar, K., Rao, S. and Reddy, V. (2010) Enhanced Dissolution Rate of Atorvastatin Calcium Using Solid Dispersion with PEG-6000 by Dropping Method. Journal of Pharmaceutical Sciences and Research, 2, 484-491.
- 16. Sharma, B., Saini, V. and Sharma, A. (2012) Preparation, Characterization and In-Vitro Evaluation of Atorvastatin Calcium Solid Dispersions with Various Hydrophilic Polymers and Its FDT Formulation. Journal of Current Pharma Research, 2, 620-630.
- 17. Patelia, E.M., Thakur, R. and Patel, J. (2013) Solubility Enhancement of Poor Water Soluble Atorvastatin Calcium Using Solid Dispersion Techniques. Journal of Medicinal Chemistry, 3, 4.
- 18. Jahan, R., Islam, M.S., Tanwir, A. and Chowdhury, J.A. (2013) In Vitro Dissolution Study of Atorvastatin Binary Solid Dispersion. Journal of Advanced Pharmaceutical Technology & Research, 4, 18-24. https://doi.org/10.4103/2231-4040.107496
- 19. Taral Mayur, N. (2015) Solubility Enhancement of Atorvastatin Calcium by Using Microwave Assisted Solid Dispersion Preparation Method. International Journal of Pharmaceutical Research & Allied Sciences, 4, 51-56.
- 20. Thirupathaiah, A. and Shyam Sunder, R. (2016) Enhancement of Solubility and Dissolution of Atorvastatin by Solid Dispersion Technique with Novel Carriers. Der Pharmacia Lettre, 8, 180-191.
- 21. Shamsuddin, Fazil, M., Ansari, S.H. and Ali, J. (2016) Atorvastatin Solid Dispersion for Bioavailability Enhancement. Journal of Advanced Pharmaceutical Technology & Research, 7, 22-26. https://doi.org/10.4103/2231-4040.169873
- 22. Barzegar-Jalali, A.J.M., Garjani, A., Javadzadeh, Y., Hamishehkar, H., Asadpour- Zeynali, K. and Adibkia, K. (2016) Evaluation of Physicochemical Properties and in Vivo Efficiency of Atorvastatin Calcium/Ezetimibe Solid Dispersions. European Journal of Pharmaceutical Sciences, 82, 21-30. https://doi.org/10.1016/j.ejps.2015.11.007
- 23. Arunkumar, N., Deecaraman, M., Rani, C., Mohanraj, K.P. and Venkates Kumar, K. (2009) Preparation and Solid State Characterization of Atorvastatin Nanosuspensions for Enhanced Solubility and Dissolution. International Journal of PharmTech Research, 1, 1725-1730.
- 24. Chouksey, R., Jain, A.K., Pandey, H. and Maithil, A. (2011) Development and Bioavailability Studies of Atorvastatin Nanoemulsion. International Journal of Pharmacy and Life Sciences, 2, 982-998.
- 25. Deeds, M.C., Anderson, J.M., Armstrong, A.S., Gastineau, D.A., Hiddinga, H.J., Jahangir, A., Eberhardt, N.L. and Kudva, Y.C. (2011) Single Dose Streptozotocin-Induced Diabetes: Considerations for Study Design in Islet Transplantation Models. Laboratory Animals, 45, 131-140. https://doi.org/10.1258/la.2010.010090
- 26. Morton, D.B., Abbot, D., Barcaly, R., Close, B.S., Ewbank, R., Gask, D., Heath, M., Mattic, S., Poole, T., Seamer, J. and Sothee, J. (1993) Removal of Blood from Laboratory Mammals and Birds. Laboratory Animals, 27, 1-22. https://doi.org/10.1258/002367793781082412
- 27. Fukuyama, N., Homma, K., Wakana, N., Kudo, K., Suyama, A., Ohazama, H., Tsuji, C., Ishiwata, K., Eguchi, Y., Nakazawa, H. and Tanaka, E. (2008) Validation of the Friedewaldequation for Evaluation of Plasma LDL-Cholesterol. Journal of Clinical Biochemistry and Nutrition, 43, 1-5. https://doi.org/10.3164/jcbn.2008036
- 28. Patidar, K. (2010) Solid Dispersion Technology: A Boon for Poorly Water Soluble Drugs. Indian Journal of Novel Drug Delivery, 3, 83-90.
- 29. Vasconcelos, T., Sarmento, B. and Costa, P. (2007) Solid Dispersions as Strategy to Improve Oral Bioavailability of Poor Water Soluble Drugs. Drug Discovery Today, 12, 1068-1075. https://doi.org/10.1016/j.drudis.2007.09.005
- 30. Planinsek, O., Kovacic, B. and Vrecer, F. (2011) Carvedilol Dissolution Improvement by Preparation of Solid Dispersions with Porous Silica. International Journal of Pharmaceutics, 406, 41-48. https://doi.org/10.1016/j.ijpharm.2010.12.035
- 31. Matsumoto, K., Nakai, Y., Yonemochi, E., Oguchi, T. and Yamamoto, K. (1998) Effect of Pore Size on the Gaseous Adsorption of Ethenzamide on Porous Crystalline Cellulose and the Physicochemical Stability of Ethenzamide after Storage. Chemical and Pharmaceutical Bulletin, 46, 314-318. https://doi.org/10.1248/cpb.46.314
- 32. Kinoshita, M., Baba, K., Nagayasu, A., Yamabe, K., Shimooka, T., Takeuchi, Y., Azuma, M., Houchi, H. and Minakuchi, K. (2002) Improvement of Solubility and Oral Bioavailability of a Poorly Water Soluble Drug, TAS-301, by Its Melt Adsorption on a Porous Calcium Silicate. Journal of Pharmaceutical Sciences, 91, 362-370. https://doi.org/10.1002/jps.10026
- 33. Maurya, D., Belgamwar, V. and Tekade, A. (2010) Microwave Induced Solubility Enhancement of Poorly Water Soluble Atorvastatin Calcium. Journal of Pharmacy and Pharmacology, 62, 1599-1606. https://doi.org/10.1111/j.2042-7158.2010.01187.x
- 34. Hamilton, S.J. and Watts, G.F. (2013) Endothelial Dysfunction in Diabetes: Pathogenesis, Significance, and Treatment. The Review of Diabetic Studies, 10, 133-156.
- 35. Chen, Y.C. and Tseng, C.H. (2013) Dyslipidemia, Kidney Disease and Cardiovascular Disease in Diabetic Patients. The Review of Diabetic Studies, 10, 88-100. https://doi.org/10.1900/RDS.2013.10.88
- 36. Chang, Y.C. and Wu, W.C. (2013) Dyslipidemia and Diabetic Nephropathy. The Review of Diabetic Studies, 10, 121-132. https://doi.org/10.1900/RDS.2013.10.121
- 37. Stein, E.A. (2009) Low Density Lipoprotein Cholesterol Reduction and Prevention of Cardiovascular Disease. Mayo Clinic Proceedings, 84, 307-309. https://doi.org/10.1016/S0025-6196(11)60537-5
- 38. Ahmeda, D., Sharmab, M. and Pillaib, K.K. (2012) The Effects of Triple vs. Dual Andmonotherapy with Rosiglitazone, Glimepiride, and Atorvastatin on Lipid Profile Andglycemic Control in Type 2 Diabetes Mellitusrats. Fundamental & Clinical Pharmacology, 26, 621-631. https://doi.org/10.1111/j.1472-8206.2011.00960.x
- 39. Singh, A., Bhat, T.K. and Sharma, O.P. (2011) Clinical Biochemistry of Hepatotoxicity. Journal of Clinical Toxicology, S, 1-19.