Pharmacology & Pharmacy
Vol.4 No.3(2013), Article ID:32326,5 pages DOI:10.4236/pp.2013.43041
Quantifying Isotibolone in Raw Materials of Tibolone
![]()
1Departamento de Físico-Química, Instituto de Química, Universidade Estadual Paulista, Araraquara, Brazil; 2Department of Physics, University of Guelph, Guelph, Canada; 3Centro de Ciências Naturais e Humanas, Universidade Federal do ABC, Santo André, Brazil; 4Faculty of Pharmaceutical Sciences, Department of Pharmacy, University of São Paulo, São Paulo, Brazil.
Email: Selma.antonio@gmail.com
Copyright © 2013 Selma Gutierrez Antonio et al. This is an open access article distributed under the Creative Commons Attribution License, which permits unrestricted use, distribution, and reproduction in any medium, provided the original work is properly cited.
Received April 5th, 2013; revised May 10th, 2013; accepted May 20th, 2013
Keywords: Hormones; Rietveld Method; X-Ray Powder Diffractometry; Synchrotron Radiation; Quantitative Phase Analysis
ABSTRACT
Tibolone, a synthetic steroid, is used in the treatment of natural or surgical menopause disturbs resultant of estrogenic deficiency. Isotibolone (Δ4-tibolone) is one of the three active metabolic degradation products of tibolone that displays progestagenic effects on carcinoma cell growth and gene regulation. Isotibolone can be present in raw material of tibolone due to some inadequate synthesis or storage. Its presence is necessary to be identified and quantified in active pharmaceutical ingredients (API), before its use in the manufacturing of medicines. After a recent study on the crystal structure determination of isotibolone, quantitative phase analyses of both tibolone and isotibolone in raw materials and tablets became possible to be conducted. X-ray powder diffraction is one recommended tool for this purpose, but it can be highly frustrating due to the extreme peak overlap when conventional laboratory equipments are used. In this work we show that the use of Brazilian Synchrotron Light Source X-ray powder diffraction data and the Rietveld method can be successfully applied to identify and quantify the isotibolone in two samples of tibolone raw materials.
1. Introduction
Tibolone is a synthetic steroid used to relieve hypooestrogenic symptoms and protect against bone loss in post-menopausal women. Tibolone itself has no biological activity; its effects are the results of the activity of its metabolites on various tissues [1]. After administration, tibolone is quickly metabolized into 3-hydroxytibolone (3-OH-tibolone) and 3β-OH-tibolone compounds, which are also present in an inactive, sulfated form. A third compound, the isotibolone (also known as D4 isomer or Org OM38) (Figure 1) is formed from tibolone directly or from the 3β-OH-metabolites and it functions as a progestagenic in endometrial tissue, whereas in the brain and liver it has androgenic effects [1].
The isotibolone is also considered the major degradation product of tibolone [2]. The potential for significant degradation of tibolone to isotibolone makes it difficult to formulate and provide a pharmaceutical composition with acceptable storage life time for a marketed product. The isomer is formed at high-temperature exposure and/or acidic conditions. The isomerization mechanism involves the rearrangement on the A-ring of the double bound from carbon atoms 5 - 10 to 4 - 5 [3].
Tibolone is considered an unstable substance due to isomerization and great effort has been carried out by the pharmaceutical industry in order to reduce isotibolone at desired levels during its synthesis [4]. The European Pharmacopoeia has recently included in the supplement 2007 (European Pharmacopoeia [5]) a monograph for tibolone and the isotibolone is referred as impurity C. The limit for such impurity C was set not more than 0.5% in tibolone raw materials. A problem to be solved, according to the EP 1121375, is the fact that the isotibolone content increased during the dosage unit preparation. According to example 2 of the cited patent, tibolone containing less than 0.1 % isotibolone has been prepared. However, the content of isotibolone in the freshly prepared pharmaceutical formulation was already 0.4% and 1.6 % after 6 months [2]. The end of shelf-life specification with respect to the amount of isotibolone formed during storage is 5% and a minimum acceptable shelflife period for these dosage units is 1 year [4].
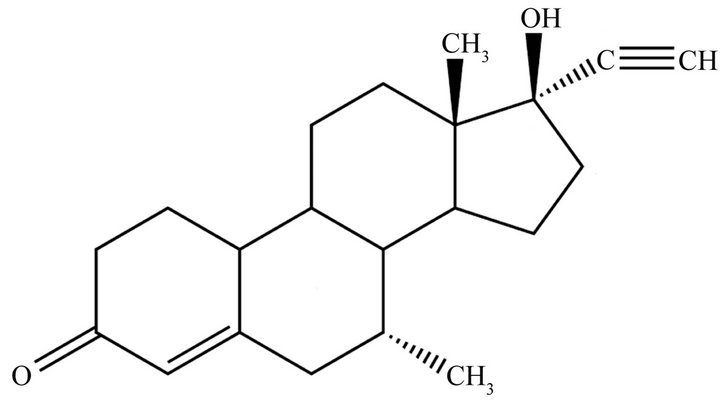
Figure 1. Tibolone structural formula.
X-ray powder diffraction and the Rietveld method are powerful tools for the characterization of pharmaceuticals and have been successfully used in the analysis of carbamazepine [6], D-mannitol [7], paracetamol [8], mebendazol [9], propylthiouracil [10] among others. However, the Rietveld method requires the knowledge of the crystal structure of all crystalline phases present in the powder. Gomez et al. (2011) [11] determined the isotibolone crystal structure and showed that the molecules are hydrogen-bonded along the c-axis, forming layers that are held in the crystal by mean of van der Waals interactions. This crystal structure was used to identify and quantify this tibolone isomer in two tibolone samples: one, prepared for this work (named TRI), contained mostly the triclinic form and the second one, composed mostly by the monoclinic form, was acquired from an international source (named MON).
2. Methods
A sample of tibolone obtained from a commercial source was dissolved in ethyl acetate, to which a trace of pyridine had been added, at 40˚C. Hexane at about 35˚C was added while stirring vigorously, after which the mixture was cooled to 0˚C and stirred for a further 30 min. The crystals obtained were filtered and washed with hexane at 0˚C and then dried under vacuum at 40˚C. They were characterized as being indicative of pure tibolone with a triclinic structure (TRI) as per the methodology described in the literature. All solvents used were analytical reagent grade or better.
The commercial sample MON was analyzed as received.
Synchrotron X-ray powder diffraction data for both samples were collected at the D12A-XRD1 beamline of the Brazilian Synchrotron Light Laboratory (LNLS) in Campinas, Brazil. X-rays of λ = 1.240728 Å (MON) and 1.24099 Å (TRI) wavelengths were selected by a doublebounced Si(111) monochromator with water refrigeration in the first crystal and the second one bent for sagittal focusing [12]. The beam can be vertically collimated/ focused by a bent Rh-coated mirror placed before the monochromator, which also provides filtering of highenergy photons (thirdand higher-order harmonics). In these experiments the beam was vertically focused in the sample’s position on a spot of ~1 mm (vertical) × ~3 mm (horizontal) in order to increase the photon flux. The experiments were performed in the vertical scattering plane, i.e. perpendicular to the linear polarization of the incident photons. Values of the X-ray wavelengths used in this study and the zero-point displacement were determined from several reflections of an external SRM660a lanthanum hexaboride (LaB6) standard (NIST). The diffracted beam was analyzed using a Ge(111) crystal analyzer and detected using a NaI(Tl) scintillation counter with a pulse-height discriminator in the counting chain. The incoming beam was also monitored by a scintillation counter to normalize the decay of the primary beam.
All powder samples were loaded to fill about 5 cm in 0.7-mm diameter borosilicate glass capillaries, and data were recorded at room temperature for ~10 s at each 2θ in steps of 0.005˚ from 2˚ to 35˚ for the monoclinic sample and from 10˚ to 30˚ for the triclinic sample.
The tibolone crystal structures used in the Rietveld refinements were obtained from the Cambridge Structural Database (CSD) and have card IDs CIYRIL (monoclinic form) [13] and CIYRIL01 (triclinic form) [14]. The isotibolone crystal structure is that given by Ariel (CSD813039) [11].
For the general refinements, the software program Topas Academic v. 4.1 was used [15]. The background was fitted using a 12-term and a 6-term Chebyschev polynomial, respectively, for the MON and TRI samples. The peak profiles were modeled by the Double-Voigt approach [15,16] with anisotropic peak profiles adjusted using spherical harmonics [17]. The peak asymmetry was fitted by the model of Cheary and Coelho [18,19]. At the beginning of the refinements, the unit-cell parameters were kept fixed at the reported values. After convergence of preferred orientation, 2θ0 and background parameters, the full-width at half maximum (FWHM) of the peaks and unit-cell parameters were refined. The crystal structure, the FWHM and asymmetry parameters were fixed for the final refinements to get the percentage of each phase following the method developed by Hill and Howard [20] which uses the results from the Rietveld refinement [21].
2.1. Quantitative Phase Analysis with the Rietveld Method
In the Rietveld method [21], the quantification of one crystalline phase p is determined using the equation [20]:
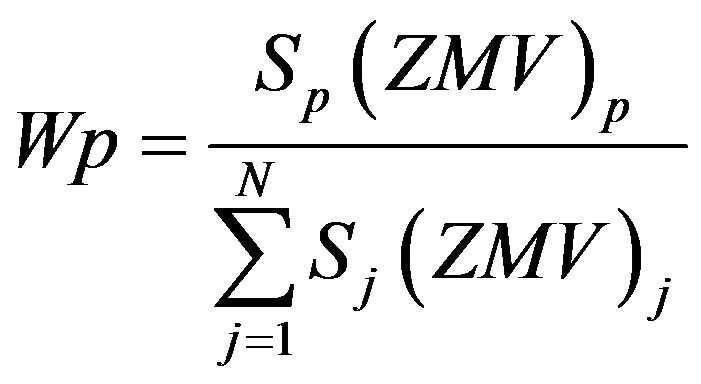
where S, Z, M and V are, respectively, the scale factor, number of formula units per unit cell, mass of the unitcell content and volume of unit cell for each crystalline phase in the sample. The summation is over all crystalline phases in the sample. S is refined and V is obtained from the refined unit-cell parameters.
For comparison, data for the TRI sample were also collected using a copper rotating anode diffractometer model RINT2000 from Rigaku, with divergence slit of 1/4˚, receiving slit of 0.3 mm, Soller slit of 5˚, and the refinement was carried out in the same way as with synchrotron data.
3. Results and Discussion
Quantitative Phase Analysis
For the tibolone material recrystallized in hexane (TRI) it was determined, using LNLS data, to have 93.9(5) wt% of the triclinic tibolone form and 6.1(5) wt% of the monoclinic isotibolone. The Rietveld plot is shown in Figure 2. The agreement indexes [22] were: Rwp = 11.397%, goodness of fit (gof) = 1.541, weighted Durbin Watson d-statistic = 1.01, RBragg(P1) = 1.16%, RBragg(Isotibolone, P21) = 2.23%.
The result of the refinement using the data of the rotating anode equipment can be seen in Figure 3. The agreement indexes were Rwp = 10.525%, goodness of fit (gof) = 6.781, weighted Durbin Watson d-statistic = 0.25, RBragg(P1) = 1.59%, RBragg(Isotibolone, P21) = 5.58%. It can be noted that the isotibolone peaks are not clearly observed, except for a very small one around 19˚ (2θ) that corresponds to the overlap of (1 3 0) and (1 2 1) peaks. In fact, only a magnification around that region shows the presence of the peak (zoomed area at right in Figure 3). The result of the quantitative phase analysis (97.7(6)% of tibolone P1 and 2.3(3)% of isotibolone)
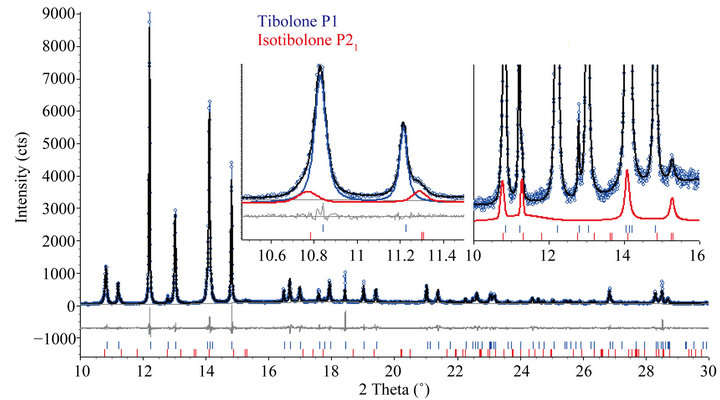
Figure 2. Rietveld plot after the refinement for the TRI sample with LNLS data. The two insets display magnifying regions indicating the shoulders of the monoclinic phase around the peaks.
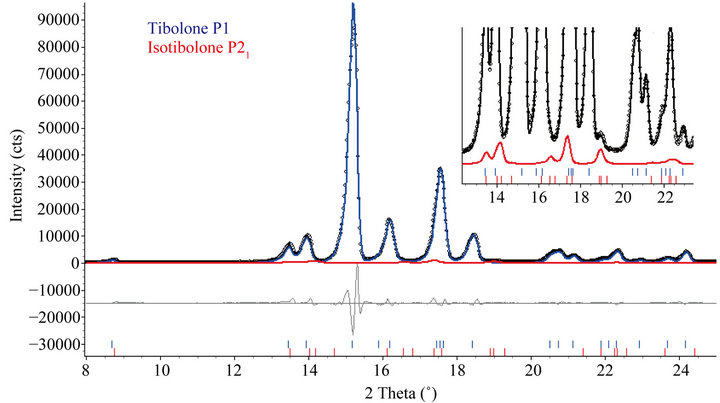
Figure 3. Plots comparing the datasets collected in a conventional equipment (rotating anode) and in a synchrotron (LNLS) source (l = 1.24099 Å). The arrows in the magnified region point to some characteristic peaks of isotibolone.
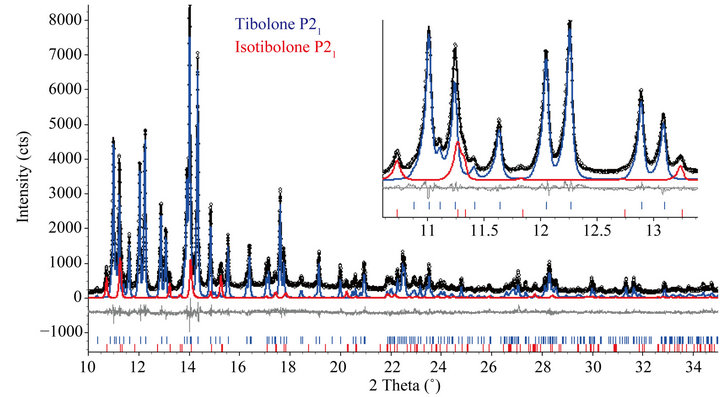
Figure 4. Rietveld plot after the refinement for the TRI sample with rotating anode data. The inset shows a region where the only distinct peak of the isotibolone at 19˚ (2θ) is observed.
cannot be confident, since only that small peak is out of ambiguity to the analysis, while with synchrotron data two more peaks can be clearly observed: (1 0 0) at the left side of the (0 1 0) triclinic tibolone around 10.8˚ (2θ) and the overlap of the (0 0 1) and (1 1 0) at the right side of the (1 0 0) monoclinic tibolone around 11.2˚ (2θ).
For the tibolone from the international provider (MON), it was found 89.6(1.7) wt% of monoclinic tibolone and 10.4(1.7) wt% of isotibolone. In this case, the amount of isotibolone is already over the limit allowed for the shelf-life tablets, according to the patent US- 6969708B1 [4]. The Rietveld plot is shown in Figure 4.
4. Conclusion
Isotibolone can be adequately identified and quantified using the Rietveld method and synchrotron X-ray powder diffraction data. In the case of pharmaceutical compounds, high resolution is very important when performing an accurate quantitative analysis, since there is a high degree of peak overlap due to the presence of low symmetry space groups. In this work the presence of the unwanted tibolone isomer in raw materials was only observed as low-intensity peaks and shoulder peaks in the main tibolone phase. Laboratory resolution with a high-divergence Soller slit can be used only for identification of isotibolone, if the main phase is triclinic.
5. Acknowledgements
The authors thank the financial support of FAPESP (proc. nos. 2008/10537-3, 2010/ 06849-0), CAPES and CNPq (proc. nos. 476335/2008-6, 309811/2009-0, 306293/ 2009-9 and 477296/2011-4) and the LNLS (Brazilian Synchrotron Light Laboratory) for beam time. Thanks are also given to the Consejo Superior de Investigaciones Científicas (CSIC) of Spain for the award of a license for the use of the Cambridge Structural Database (CSD).
REFERENCES
- K. Modelska and S. Cummings, “Clinical Review 140— Tibolone for Postmenopausal Women: Systematic Review of Randomized Trials,” Journal of Clinical Endocrinology and Metabolism, Vol. 87, No. 1, 2002, pp. 16- 23. doi:10.1210/jc.87.1.16
- T. Van Engelgem and J. Marechal, “Pharmaceutical Composition Comprising Cyclodextrin Complex of Tibolone,” Patent No. WO2005084682A1, 2005.
- S. X. M. Boerrigter, C. J. M. van den Hoogenhof, H. Meekes, P. Verwer and P. Bennema, “Pseudomorphic Crystal Growth of the Model Steroid Methyl Analogue of Norethindrone,” Journal of Physical Chemistry B, Vol. 106, No. 51, 2002, pp. 13224-13230. doi:10.1021/jp014416q
- P. H. G. M. Kirchholtes, G. A. J. M. T. Sas, P. H. G. Kirchholtes, G. A. J. M. Sas, M. K. P. Gerard, S. G. A. J. Theresia and S. G. A. J. M. Theresia, “High Purity Composition Comprising (7-Alpha,17alpha)-17-hydroxy-7-methyl-19-nor-17-pregn-5(10)-en-20-yn-3-one,” US Patent No. 6969708B1, 2000.
- “European Pharmacopoeia,” 5th Edition, Supplement 5.7, 2006, pp. 5124-5125.
- S. I. Sampath, V. P. Neelima and S. Raj, “Quantitative Analyses of Complex Pharmaceutical Mixtures by the Rietveld Method,” Powder Diffraction, Vol. 16, No. 1, 2001, pp. 20-24. doi:10.1154/1.1332076
- C. E. Botez, P. W. Stephens, C. Nunes and R. Suryanarayanan, “Crystal Structure of Anhydrous Delta-d-Mannitol,” Powder Diffraction, Vol. 18, No. 3, 2003, pp. 214- 218. doi:10.1154/1.1582460
- W. Dong, C. Gilmore, G. Barr, C. Dallman, N. Feeder and S. Terry, “A Quick Method for the Quantitative Analysis of Mixtures. 1. Powder X-Ray Diffraction,” Journal of Pharmaceutical Sciences, Vol. 97, No. 6, 2008, pp. 2260-2276. doi:10.1002/jps.21142
- F. F. Ferreira, S. G. Antonio, P. C. P. Rosa and C. D. O. Paiva-Santos, “Crystal Structure Determination of Mebendazole Form a Using High-Resolution Synchrotron X-Ray Powder Diffraction Data,” Journal of Pharmaceutical Sciences, Vol. 99, No. 4, 2010, pp. 1734-1744.
- F. F. Ferreira, A. C. Trindade, S. G. Antonio and C. D. Paiva-Santos, “Crystal Structure of Propylthiouracil Determined Using High-Resolution Synchrotron X-Ray Powder Diffraction,” CrystEngComm, Vol. 13, No. 17, 2011, pp. 5474-5479. doi:10.1039/c1ce05362k
- A. Gomez, S. G. Antonio, G. L. B. Araujo, F. F. Ferreira and C. D. O. Paiva-Santos, “Crystal Structure of Isotibolone: A Major Degradation Product of Tibolone,” CrystEngComm, Vol. 14, No. 8, 2012, pp. 2826-2830. doi:10.1039/c2ce06504e
- F. F. Ferreira, E. Granado, W. Carvalho, S. W. Kycia, D. Bruno and R. Droppa, “X-Ray Powder Diffraction Beamline at D10B of LNLS: Application to the Ba2FeReO6 Double Perovskite,” Journal of Synchrotron Radiation, Vol. 13, No. 1, 2006, pp. 46-53. doi:10.1107/S0909049505039208
- J. P. Declercq, M. Vanmeerssche and F. J. Zeelen, “Conformational-Analysis of 3-Oxo 5(10)-Unsaturated Steroids-Single-Crystal X-Ray Structure-Analysis of 17-Hydroxy-7-alpha-methyl-19-nor-17-alpha-pregn-5(10)-en-20-yn-3-one (Org OD 14),” Recueil Des Travaux Chimiques Des Pays-Bas—Journal of the Royal Netherlands Chemical Society, Vol. 103, No. 5, 1984, pp. 145-147. doi:10.1002/recl.19841030501
- A. Schouten and J. A. Kanters, “Structure of the Triclinic Modification of 17β-Hydroxy-19-nor-7α-methyl-17α-pregn-5(10)-en-20-yn-3-one (ORG OD14),” Acta Crystallographica Section C, Vol. 47, No. 8, 1991, pp. 1754- 1756. doi:10.1107/S0108270190014196
- A. Coelho, “Topas Academic v4.1,” Coelho Software, Brisbane, Australia, 2007.
- D. Balzar and H. Ledbetter, “Voigt-Function Modeling in Fourier-Analysis of Size-Broadened and Strain-Broadened X-Ray-Diffraction Peaks,” Journal of Applied Crystallography, Vol. 26, No. 1, 1993, pp. 97-103. doi:10.1107/S0021889892008987
- M. Jarvinen, “Application of Symmetrized Harmonics Expansion to Correction of the Preferred Orientation Effect,” Journal of Applied Crystallography, Vol. 26, No. 4, 1993, pp. 525-531. doi:10.1107/S0021889893001219
- R. W. Cheary and A. A. Coelho, “Axial Divergence in a Conventional X-Ray Powder Diffractometer. I. Theoretical Foundations,” Journal of Applied Crystallography, Vol. 31, No. 6, 1998, pp. 851-861. doi:10.1107/S0021889898006876
- R. W. Cheary and A. A. Coelho, “Axial Divergence in a Conventional X-Ray Powder Diffractometer. II. Realization and Evaluation in a Fundamental-Parameter Profile Fitting Procedure,” Journal of Applied Crystallography, Vol. 31, No. 6, 1998, pp. 862-868. doi:10.1107/S0021889898006888
- R. J. Hill and C.J. Howard, “Quantitative Phase-Analysis from Neutron Powder Diffraction Data Using the Rietveld Method,” Journal of Applied Crystallography, Vol. 20, No. 6, 1987, pp. 467-474. doi:10.1107/S0021889887086199
- H. M. Rietveld, “A Profile Refinement Method for Nuclear and Magnetic Structures,” Journal of Applied Crystallography, Vol. 2, No. 2, 1969, pp. 65-71. doi:10.1107/S0021889869006558
- R. A. Young and D. B. Wiles, “Profile Shape Functions in Rietveld Refinements,” Journal of Applied Crystallography, Vol. 15, No. 4, 1982, pp. 430-438. doi:10.1107/S002188988201231X