Open Journal of Air Pollution
Vol.06 No.02(2017), Article ID:76673,13 pages
10.4236/ojap.2017.62005
Diurnal Evolution of Urban Heat Island and Its Impact on Air Quality by Using Ground Observations (SAFAR) over New Delhi
Mohammed Yusuff Aslam, Karumuri Rama Krishna, Gufran Beig*, Mohammed Iqbal Rasul Tinmaker, Dilip Motiram Chate
Indian Institute of Tropical Meteorology, Pune, India

Copyright © 2017 by authors and Scientific Research Publishing Inc.
This work is licensed under the Creative Commons Attribution International License (CC BY 4.0).
http://creativecommons.org/licenses/by/4.0/


Received: May 12, 2017; Accepted: May 28, 2017; Published: May 31, 2017
ABSTRACT
The paper presents a study of urban heat island (UHI) intensity and its impact on air quality by using the System of Air Quality Forecasting and Research (SAFAR) network observations over Delhi during the clear sky month of December of 2013 and 2015. It is found that in the month of December 2013 and 2015 the UHI shows a peak in late evening around 20:00 hrs. The concentration of PM2.5 shows a bimodal peak in the month of December of both the years 2013 and 2015 which is due to the enhanced anthropogenic activity during the traffic hours. The formation of UHI during the late evening traffic hours is due to the enhancement in the concentration of PM2.5 due to the enhanced anthropogenic activity with higher ground heat flux and lower PBLH and wind speed which leads to both the years 2013 and 2015 during the month of December. It is also found that UHI intensity shows a positive correlation (r = 0.57) with PM2.5 concentration and a negative correlation (r = −0.40) with wind speed and the PM2.5 concentration also shows a negative correlation (r = −0.57) with wind speed during December 2013. Whereas during December 2015 it has found that UHI intensity has a positive correlation (r = 0.65) with PM2.5 concentration and a negative correlation (r = −0.45) with wind speed and the PM2.5 concentration also shows a negative correlation (r = −0.57) with wind speed.
Keywords:
UHI, PM2.5, PBLH, Wind Speed, GHF

1. Introduction
The Urban Heat Island intensity (UHI) is defined as the temperature difference between representative urban and rural stations [1] . However, due to variations in temperature between the urban and surrounding rural areas, the selection of representative stations is often a problem in UHI characterization, as shown in urban canopy UHI studies [2] , which is associated with the air pollution events in the favourable conditions such as high temperature, low wind speed, PBLH which trigger the air pollution events [3] [4] . The increasing urban population which associates with the demands for space, water, energy, and other resources, has increased pressure on urban environments. This increasing urban population leads to induce a variety of anthropogenic pollution which includes transport, industrial activities, and biomass burning which are in general composed of particulate matter (PM2.5) from mineral dust and combustion processes. These fine mode particulates can directly be emitted by sources or produced by condensation, coagulation, or gas-to-particle conversion, the last being common to combustion sources [5] , which is a key pollutant affecting radiation balance and a main factor in decreasing air quality [6] . The diurnal variations in PM2.5 concentrations are mostly dominated by the variations in the planetary boundary layer height (PBLH) and source emissions in the urban area. Whereas the diurnal wind patterns are more important factors for PM2.5 variation in the rural area [7] . Urban areas have obvious effects on particulate matter, related closely with PM2.5 concentration, which is mainly effected from the daily activities, such as vehicle exhaust, marine aerosols, coal and fuel combustion, burning of agricultural wastes, paved road dust, and secondary sulfates, etc., [8] [9] .
A fundamental variable PBLH, which determines many tropospheric pro- cesses which are critical to air pollution, such as aerosol distributions, convection activity, cloud and fog formation. Thus, PBLH plays a key role in weather, climate, and air quality models to determine turbulence mixing, vertical diffusion, convective transport, cloud/aerosol entrainment, and atmospheric pollutant deposition [10] [11] [12] [13] .
The purpose of the work is to study the UHI and its impact on air quality by using SAFAR Network for two different years 2013 and 2015 during clear sky condition for winter month over New Delhi.
2. Study Area
The domain of the study is the National capital region of India, Delhi which is located on the banks of the Yamuna River in the subtropical belt region of Indian sub-continent. It is a city geographically surrounded by the land situated at latitudinal (28.2˚N to 29.0˚N) and longitudinal (76.6˚E to 77.5˚E) as shown in Figure 1 covering an area of 1483 km2 with altitude of about 216 m amsl. Delhi has an extreme climate with annual temperatures ranging from below 3˚C in winters rises to greater than 45˚C in summers and average rainfall of 61cm most of which occurs during the monsoon season. The year can be broadly divided into four distinct seasons, viz. pre-monsoon (March-June), monsoon (July-Sep- tember), post-monsoon (October-November), and winter (December-February). Summers are long and extremely hot accompanied with frequent dust storms. Humidity level is high during the monsoon season, while the air is dry during

Figure 1. Land use land cover pattern of Delhi and its surroundings, solid line indicted the boundary of Delhi and star marks indicates the observational stations.
the rest of the year [14] .
The main land features of Delhi are the Yamuna flood plain and the Aravalli ridge. The Yamuna River which passes through major districts of Delhi has a total length of about 48 km. The Delhi ridge is an extension of Aravalli Range and its meet the Yamuna at two locations in Delhi, in the north and the east. This ridge acts as a barrier between the Thar Desert and the northern Indian plains. The land use/land cover pattern inside the periphery of the Delhi city mainly comes in the category of urban built-up area of different types i.e. residential, commercial, industrial and institutional, whereas the periphery of the city boundary and its outside is predominantly agricultural. The region between north and north east of the city lies in the flood plains of the rivers Yamuna which have high soil moisture content and are well irrigated. Therefore paddy and sugarcane are the two major crops grown in this region. On the other hand, a part of the region lying in the south and south west of Delhi has rocky terrain, being part of the Aravalli range. This region has the characteristics of the semi-arid climate, with sandy soil having relatively low soil moisture content.
3. Data and Methodology
3.1. Observational Datasets
In this study we mainly focus on the hourly Meteorological data of air temperatures and surface concentrations of PM2.5, collected during the December 2013 and 2015 from the two stations, first Sir C V Raman (CVR) Industrial Training Institute (28.73˚N, 77.20˚E), which is located at north from the center of the city. This is completely urbanized area and surrounded majorly with significant infrastructure such as buildings for the residential as well the commercial purposes with a lot of roads and traffic and a little amount of trees and vegetative grass lands. Second the Indian Institute of Tropical Meteorology (IITMD) Delhi branch (28.64˚N, 77.17˚E), which is located at the center of the city. This is majorly surrounded with reserve forest and natural green vegetative grass lands as shown from the Figure 1. This surface monitoring stations installed and operated at various location of in and around Delhi under the SAFAR (System of Air Quality Forecasting and Research) network. The Land Use Land Cover (LULC) classification from Terra/MODIS for the year 2013 for Delhi and its surroundings from Land Processes Distributed Active Archive center (LP DAAP), U.S. Geological survey (USGS) (http://gdex.cr.usgs.gov/gdex/) as shown in Figure 1.
3.2. Model Datasets
The regional simulations in this study use the regional Advanced Research of WRF version 3.7. Our model simulation covers the PBLH and ground heat flux for the winter seasons (Dec) 2013 and 2015 respectively. The simulations were run at a three interactive domains with spatial resolution of 9 km, 3 km and 1 km which covers Part of North India (22˚N-34˚N - 71˚E-84˚E), second Domain covers complete Delhi and outer boundaries (25˚N-32˚N - 73˚E-80˚E) region and Third domain covers Delhi (27˚N-30˚N - 75˚E-78˚E). The vertical grid contained 32 full sigma levels from the surface up to 50-hPa. Approximately eight of these levels were below 1 km, thereby providing a fine vertical resolution within the planetary boundary layer. The meteorological fields for driving WRF were taken from NCEP/FNL meteorological reanalysis fields (FNL) as provided by NCAR (http://rad.ucar.edu/datasets/ds083.2/). Other physical schemes include: [15] microphysics scheme, Dudhia shortwave radiation scheme [16] , RRTM longwave radiation scheme [17] , while no cumulus convection scheme is used for the inner domain of the model, the Kain Fritch cumulus convection scheme is applied for the outer layer. Monin-Obukhov surface layer scheme [18] , Yonsei University boundary layer scheme and the Noah land surface model.
A simulation of the particular intricacies of such an environment is heavily influenced by its depiction of the planetary boundary layer (PBL)―that portion of the lower troposphere directly affected by the earth’s surface via troposphere- surface exchanges of heat, moisture, and momentum on sub hourly time scales [19] [20] . Exchanges of moisture, heat, and momentum occur within the PBL through mixing associated with turbulent eddies. These eddies influence the way in which lower-tropospheric thermodynamic and kinematic structures evolve. Such eddies operate on spatiotemporal scales that cannot be explicitly represented on grid scales and time steps employed in most Mesoscale models. As such, their effects are expressed in these models via the use of PBL parameterization schemes, whose theoretical development is outlined in multiple sources addressing the subject [19] [20] [21] , here we use YSU PBL scheme the main advantage of this scheme is more accurately simulates deeper vertical mixing in buoyancy-driven PBLs with shallower mixing in strong-wind regimes [22] .
4. Results and Discussions
4.1. Diurnal Variation of UHI, PM2.5, PBLH, Ground Heat Flux and Wind Speed during December 2013
Figures 2(a)-(d) shows the diurnal variation of UHI with PM2.5, PBLH, ground heat flux and wind speed during the month of December 2013. From Figure 2(a) it is seen that UHI starts increasing after the sunrise hours and continues to increase till late in the evening and peaks around 20:00 hrs in the evening with a magnitude ~1.5˚C. The PM2.5 concentration over CVR and IITMD sites shows the bimodal pattern with a peak during morning traffic hours around 09:00 hrs and a second higher peak in the evening traffic hours around 20:00 hrs compares to the peak in morning. The evening peaks in the UHI intensity and the PM2.5 concentrations are almost at the same hours. The diurnal variation of PM2.5 concentration at the IITMD location follows the same trend with a lesser in the concentrations compared to the CVR site. The peaks in the concentration of PM2.5 during the traffic hours are due to the enhanced anthropogenic activity
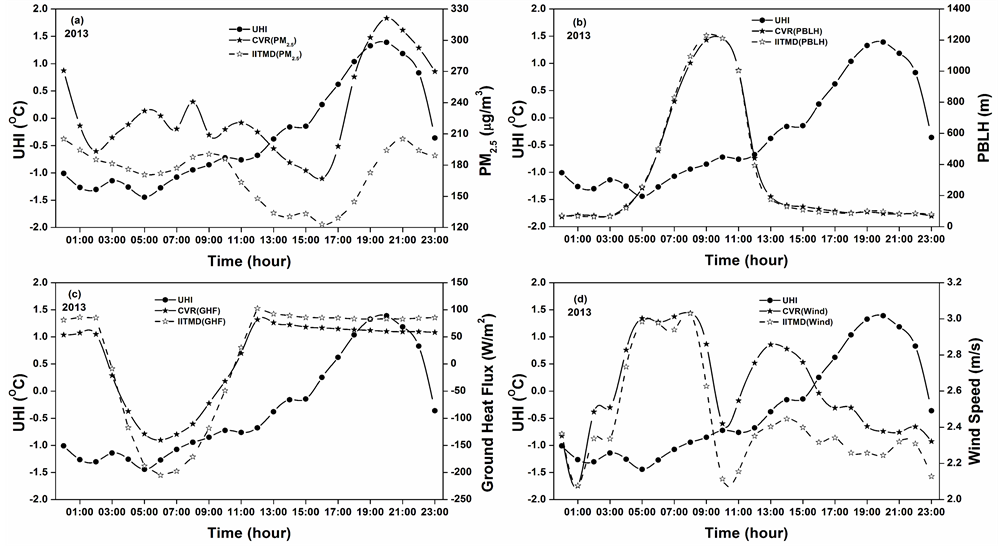
Figure 2. Diurnal cycle of UHI compared with the (a) PM2.5 concentration, (b) PBLH, (c) Ground heat flux and (d) Wind speed during December 2013.
during the traffic hours [7] [23] .
Figure 2(b) shows the diurnal variations of UHI with PBLH for the month of December 2013. The PBLH is affected by the temperature, ground heat flux, and wind speed etc., [24] . The PBLH remains at constant height after the sunset to the sunrise hours. After the sunrise the PBLH starts increasing and attains a peak during the daytime in the morning traffic hour around 10:00 hrs with a peak in the UHI around the same time, then it starts decreasing thereafter. The PBLH follows the same pattern at the IITMD site with lower value at the night time and higher during the day time for December 2013. The PBLH variability is dominated by the strong diurnal cycle. At the nighttime as the surface layer becomes stable because of infrared radiative cooling, so the PBLH is typically shallow and however, it grows deep in daytime because of solar heating cause’s convective unstable conditions [25] .
Figure 2(c) shows the diurnal variation of UHI and the ground heat flux for the month of December 2013. Here the ground heat flux values remains higher and almost constant from the sunset to the sunrise hours. It attains a least value around 07:00 hrs in the morning and then it starts increasing and attains a maximum value during the hour of maximum incoming solar radiation. The ground heat flux shows the same pattern over IITMD whereas the CVR site shows lesser in the magnitude during the morning hours and a little higher in the magnitude in the evening values. A strong difference in the ground heat flux values between the nighttime and daytime suggest that more thermal energy absorption by the urban surfaces [26] .
The diurnal variation in the wind speed during the December 2013 shows bimodal pattern over the CVR and IITMD sites as seen in the Figure 2(d). The wind speed shows a peak during 08:00 hrs in the morning and 15:00 hrs in the evening, whereas during the night hours the winds are low as compares to that of the morning hours. The winds are lower in the magnitude during the same evening traffic hours when the UHI intensity is higher around 20:00hrs. Changes in the concentration of PM2.5, PBLH and Ground heat flux are mainly caused due to the changes in the magnitude of the wind speed [27] .
4.2. Diurnal Variation of UHI, PM2.5, PBLH, Ground Heat Flux and Wind Speed during December 2015
Figures 3(a)-(d) shows the diurnal variation of UHI with the PM2.5, PBLH, ground heat flux and wind speed during the month of December 2015 for both the CVR and IITMD sites. From Figure 3(a), UHI shows a decreasing trend till the sunrise in the morning and then starts increasing thereafter and peaks in the late evening during traffic hours around 20:00 hrs. The peaks in the concentration of PM2.5 over CVR and IITMD sites also shows a bimodal patter with a peak in the morning traffic hours around 09:00 hrs while the second peak during the late evening traffic hours around 20:00 hrs, whereas PM2.5 concentrations at the IITMD site shows the same pattern and trend with lower in the magnitude [7] [23] .

Figure 3. Diurnal cycle of UHI compared with the (a) PM2.5 concentration, (b) PBLH, (c) Ground heat flux and (d) Wind speed during December 2015.
Figure 3(b) shows the diurnal variations of UHI with PBLH for the month of December 2015. The PBLH is affected by the temperature, ground heat flux, and wind speed etc., [24] . The PBLH remains constant after the sunset till the sunrise hours. After the sunrise the PBLH starts increasing and attains a peak during the daytime around 10:00 hrs with a peak in the UHI in the morning traffic hour around the 09:00 hrs, then it starts decreasing thereafter. The PBLH follows the same pattern at the IITMD site with a lower value at the night time and higher during the day time. The PBLH variability is dominated by the strong diurnal cycle [25] .
Figure 3(c) shows the diurnal variation of UHI and the ground heat flux during December 2015 at CVR and IITMD sites. The ground heat flux values shows higher and remain constant from the sunset to the sunrise hours. It attains a less value around 08:00 hrs in the morning and then it starts increasing and attains a maximum value during the hour of maximum incoming solar radiation. Whereas at the IITMD site the ground heat flux values follows the same trend as the CVR site with a lower in the magnitude during the morning hour’s values and higher in the magnitude during the evening hour values. The difference in the daytime and nighttime ground heat flux is due to the thermal energy released that is absorbed by the urban surfaces [26] .
The diurnal variation in the wind speed during the December 2015 has a bimodal pattern over the CVR and IITMD sites as seen in the Figure 3(d). The wind speed shows a peak during early morning around 05:00 hrs and in noon around 12:00 hrs. Whereas during the late evening traffic hours the winds are lower in the magnitude [27] .
The UHI formation during the evening traffic hours is due to increase in the concentration of PM2.5 with decrease in the height of the PBLH and higher in the magnitude of the ground heat flux and lower the wind speed. Before sunrise the concentration in the PM2.5 are lower in the magnitude and with the decrease in the PBLH and lower in the ground heat flux values and higher in the wind speed, which leads to the formation of the Urban Cool Island (UCI). The anti-correla- tion between wind speed and PM2.5 concentration leads to the formation of UCI [28] .
4.3. Regression Analysis of UHI
Figures 4(a)-(d) shows regression analysis to explore the correlation between the UHI and its two possible dependent variables during the month of December 2013. Figure 4(a) shows the correlation of UHI with the first variable (concentration of PM2.5) exists a strong positive correlation at the CVR site (r = 0.57, significant at 0.001), whereas it exists a weak positive correlation at the IITMD

Figure 4. Linear regression of the UHI with the (a) PM2.5 concentration and (b) Wind speed, and regression between the PM2.5 concentration and Wind speed at (c) CVR and (d) IITMD stations during December 2013. The solid and dashed lines in the above figure indicate the regression lines.
site (r = 0.40, significant at 0.003). Figure 4(b) shows a negative correlation of UHI with the second variable (wind speed) both at the CVR (r = −0.40, significant at 0.002) and IITMD (r = −0.27, significant at 0.005) site respectively. From the Figure 4(c) & Figure 4(d) shows the correlation between the two dependent variables concentration of PM2.5 and wind speed shows a strong negative correlation at both the sites CVR (r = −0.57, significant at 0.001) and IITMD (r = −0.56, significant at 0.001).
Figures 5(a)-(d) shows the regression analysis to explore the correlation between the UHI and its two possible dependent variables during the month of December 2015. Figure 5(a) shows that the correlation of UHI with the first variable (concentration of PM2.5) is strong positive at the CVR site (r = 0.65, significant at 0.001), whereas a positive correlation at the IITMD site (r = 0.50, significant at 0.001). Figure 5(b) shows a negative correlation of UHI with second variable (wind speed) at the CVR (r = −0.45, significant at 0.002) and IITMD (r = −0.35, significant at 0.005) site respectively. Figure 5(c) & Figure 5(d) shows

Figure 5. Linear regression of the UHI with the (a) PM2.5 concentration and (b) Wind speed, and regression between the PM2.5 concentration and Wind speed at (c) CVR and (d) IITMD stations during December 2015. The solid and dashed lines in the above figure indicate the regression lines.
the correlation between the two dependent variables concentration of PM2.5 and wind speed, it shows a strong negative correlation at both the sites CVR (r = −0.57, significant at 0.001) and IITMD (r = −0.31, significant at 0.001).
The formation of UHI is mainly favoured with the low wind speed and high in the concentration of PM2.5 conditions with a positive correlation between the UHI and PM2.5 concentrations and negative correlation between the UHI and wind speed. Whereas a negative correlation between the wind speed and concentrations of PM2.5 during the month of December 2013 and 2015 [28] .
4.4. Comparison of UHI with Mean Concentrations of PM2.5, PBLH, Ground Heat Flux and Wind Speed during the Month December 2013 and December 2015
Table 1 show that during the daytime mean concentrations of PM2.5 which is reduced by ~11% and ~5% over the CVR site and IITMD site respectively, while there is a reduction of ~9% and ~12% in the PBLH over CVR and IITMD sites. However the ground heat flux has increased ~11% and 15% over the CVR and IGI sites respectively. Whereas the wind speed have reduced by ~3% and ~6% at CVR and IGI sites respectively.
Table 2 shows the nighttime mean concentrations of PM2.5 which have been reduced by ~14% over the CVR site and ~4% at the IITMD site. The PBLH has reduced by ~3% and ~23% at the CVR and IITMD sites respectively. However the ground heat flux has increased ~25% at both the CVR and IITMD sites respectively. Whereas the winds speed has an increase ~3% at CVR and decreased by ~7% at the IITMD sites.

Table 1. Comparison of mean concentrations of UHI, PM2.5, PBLH, ground heat flux and wind speed between Dec’ 2013 and Dec’ 2015 during the daytime.
Table 2. Comparison of mean concentrations of UHI, PM2.5, PBLH, ground heat flux and wind speed between Dec’ 2013 and Dec’ 2015 during the nighttime.
The daytime average UHI intensity during the December 2013 was −0.32 ± 0.66 which has increased to 0.83 ± 2.3 by December 2015, whereas during nighttime UHI intensity was −0.36 ± 1.18 in December 2013 and which has reduced to −0.48 ± 0.72 during December 2015. In the month of December 2013 it is found that the average UHI intensity was almost the same during the day and night times, while the daytime UHI intensity during the month of December 2015 is more than the nighttime UHI intensity.
5. Conclusions
The paper presents the diurnal variation of UHI obtained from the SAFAR network surface observation over the Delhi in the months of December 2013 and December 2015. The UHI intensity shows a decreasing trend during the late night hours till the sunrise in the morning. Thereafter UHI intensity starts increasing and continues to increase and peaks during the late evening 20:00 hrs during the month of December of both the years 2013 and 2015. The concentration of PM2.5 shows a bimodal peak in the month of December of both the years 2013 and 2015 with the first peak during the morning traffic hours and second peak in late evening traffic hour. The Peak in the concentration of PM2.5 both in the morning and late evening is due to the enhanced anthropogenic activity during the traffic hours in both the years. The enhancement in the concentration of PM2.5 with higher ground heat flux and lower PBLH and wind speed during the late evening traffic hours leads to the formation of UHI in both the years 2013 and 2015 during the month of December.
The intensity of UHI is directly proportional to PM2.5 concentration during the month of December 2013 and 2015. If the intensity of UHI is found to be positively correlated with the concentration of PM2.5 at the CVR site (r = 0.57, significant at 0.001) and IITMD site (r = 0.40, significant at 0.003), whereas it is found to be a negative correlation with wind speed at the CVR (r = −0.40, significant at 0.002) and IITMD (r = −0.27, significant at 0.005) site. While the concentration of PM2.5 and wind speed shows a strong negative correlation at both the sites CVR (r = −0.57, significant at 0.001) and IITMD (r = −0.56, significant at 0.001) during December 2013.
During December 2015 the concentration of PM2.5 shows a positive correlation with UHI intensity at both the CVR site (r = 0.65, significant at 0.001), and IITMD site (r = 0.50, significant at 0.001), with a negative correlation of wind speed correlation with UHI intensity at the CVR (r = −0.45, significant at 0.002) and IITMD (r = −0.35, significant at 0.005). While the concentration of PM2.5 and wind speed shows a strong negative correlation at both the sites CVR (r = −0.57, significant at 0.001) and IITMD (r = −0.31, significant at 0.001).
Acknowledgements
The authors are thankful to Director, IITM for his constant support and encouragement. The authors are all thankful to Ministry of Earth Science for providing funds for SAFAR network.
Cite this paper
Aslam, M.Y., Krishna, K.R., Beig, G., Tinmaker, M.I.R. and Chate, D.M. (2017) Diurnal Evolution of Urban Heat Island and Its Impact on Air Quality by Using Ground Observations (SAFAR) over New Delhi. Open Journal of Air Pollution, 6, 52-64. https://doi.org/10.4236/ojap.2017.62005
References
- 1. Oke, T.R. (1981) Canyon geometry and the Nocturnal Urban Heat Island: Comparison of Scale Model and Field Observations. Journal of Climatology, 1, 237-254.
https://doi.org/10.1002/joc.3370010304 - 2. Stewart, I.D. (2011) A Systematic Review and Scientific Critique of Methodology in Modern Urban Heat Island Literature. International Journal of Climatology, 31, 200-217.
https://doi.org/10.1002/joc.2141 - 3. Weng, Q. and Yang, S. (2004) Managing the Adverse Thermal Effects of Urban Development in a Densely Populated Chinese City. Journal of Environmental Management, 70, 145-156.
https://doi.org/10.1016/j.jenvman.2003.11.006 - 4. Zhao, S., Da, L., Tang, Z., Fang, H., Song, K. and Fang, J. (2006) Ecological Consequences of Rapid Urban Expansion: Shanghai, China. Frontiers in Ecology and the Environment, 4, 341-346.
https://doi.org/10.1890/1540-9295(2006)004[0341:ECORUE]2.0.CO;2 - 5. Seinfeld, J.H. and Pandis, S.N. (1998) Atmospheric Chemistry and Physics; From Air Pollution to Climate Change. Atmospheric Chemistry and Physics.
https://doi.org/10.1063/1.882420 - 6. Yang, S.U.N. and Yuesi, W. (2010) Vertical Observations and Analysis of PM 2.5, O3, and NOx at Beijing and Tianjin from Towers during Summer and Autumn 2006. Advances in Atmospheric Sciences, 27, 123-136.
https://doi.org/10.1007/s00376-009-8154-z - 7. Zhao, X., Zhang, X., Xu, X., Xu, J., Meng, W. and Pu, W. (2009) Seasonal and Diurnal Variations of Ambient PM 2.5 Concentration in Urban and Rural Environments in Beijing. Atmospheric Environment, 43, 2893-2900.
https://doi.org/10.1016/j.atmosenv.2009.03.009 - 8. Pui, D.Y., Chen, S.C. and Zuo, Z. (2014) PM 2.5 in China: Measurements, Sources, Visibility and Health Effects, and Mitigation. Particuology, 13, 1-26.
https://doi.org/10.1016/j.partic.2013.11.001 - 9. Wu, J., Xie, W., Li, W. and Li, J. (2015) Effects of Urban Landscape Pattern on PM 2.5 Pollution—A Beijing Case Study. PloS One, 10, e0142449.
https://doi.org/10.1371/journal.pone.0142449 - 10. Deardorff, J.W. (1972) Parameterization of the Planetary Boundary Layer for Use in General Circulation Models. Monthly Weather Review, 100, 93-106.
https://doi.org/10.1175/1520-0493(1972)100<0093:POTPBL>2.3.CO;2 - 11. Konor, C.S., Boezio, G.C., Mechoso, C.R. and Arakawa, A. (2009) Parameterization of PBL Processes in an Atmospheric General Circulation Model: Description and Preliminary Assessment. Monthly Weather Review, 137, 1061-1082.
https://doi.org/10.1175/2008MWR2464.1 - 12. Lin, W., Xu, X., Zhang, X. and Tang, J. (2008) Contributions of Pollutants from North China Plain to Surface Ozone at the Shangdianzi GAW Station. Atmospheric Chemistry and Physics, 8, 5889-5898.
https://doi.org/10.5194/acp-8-5889-2008 - 13. Seibert, P. (2000) Review and Intercomparison of Operational Methods for the Determination of the Mixing Height. Atmospheric Environment, 34, 1001-1027.
https://doi.org/10.1016/S1352-2310(99)00349-0 - 14. Tiwari, S., Tiwari, S., Hopke, P.K., Attri, S.D., Soni, V.K. and Singh, A.K. (2016) Variability in Optical Properties of Atmospheric Aerosols and Their Frequency Distribution over a Mega City “New Delhi”, India. Environmental Science and Pollution Research, 23, 8781-8793.
https://doi.org/10.1007/s11356-016-6060-3 - 15. Lin, Y.L., Farley, R.D. and Orville, H.D. (1983) Bulk Parameterization of the Snow Field in a Cloud Model. Journal of Climate and Applied Meteorology, 22, 1065-1092.
https://doi.org/10.1175/1520-0450(1983)022<1065:BPOTSF>2.0.CO;2 - 16. Dudhia, J. (1989) Numerical Study of Convection Observed during the Winter Monsoon Experiment Using a Mesoscale Two-Dimensional Model. Journal of the Atmospheric Sciences, 46, 3077-3107.
https://doi.org/10.1175/1520-0469(1989)046<3077:NSOCOD>2.0.CO;2 - 17. Mlawer, E.J., Taubman, S.J., Brown, P.D., Iacono, M.J. and Clough, S.A. (1997) Radiative Transfer for Inhomogeneous Atmospheres: RRTM, a Validated Correlated-k Model for the Longwave. Journal of Geophysical Research: Atmospheres, 102, 16663-16682.
https://doi.org/10.1029/97JD00237 - 18. Monin, A.S. and Obukhov, A.M. (1954) Basic Laws of Turbulent Mixing in the Surface Layer of the Atmosphere. Contrib. Geophys. Inst. Acad. Sci. USSR, 24, 163-187.
- 19. Stull, R.B. (1988) An Introduction to Boundary Layer Meteorology. Kluwer Academic, Dordrecht, 666 p.
https://doi.org/10.1007/978-94-009-3027-8 - 20. Stensrud D. (2007) Parameterization Schemes: Keys to Understanding Numerical Weather Prediction Models. Cambridge University Press, Cambridge.
https://doi.org/10.1017/CBO9780511812590 - 21. Holton, J.R. (2004) Introduction to Dynamic Meteorology. 4th Edition, Elsevier, 535 p.
- 22. Hong, S. and Lim, J. (2006) The WRF Single-Moment 6-Class Microphysics Scheme (WSM6). Journal of the Korean Meteorological Society, 42, 129-151.
- 23. DeGaetano, A. (2004) Temporal, Spatial and Meteorological Variations in Hourly PM2.5 Concentration Extremes in New York City. Atmospheric Environment, 38, 1547-1558.
https://doi.org/10.1016/j.atmosenv.2003.12.020 - 24. Liu, S. and Liang, X.Z. (2010) Observed Diurnal Cycle Climatology of Planetary Boundary Layer Height. Journal of Climate, 23, 5790-5809.
https://doi.org/10.1175/2010JCLI3552.1 - 25. Dandou, A., Tombrou, M., Schafer, K., Emeis, S., Protonotariou, A.P., Bossioli, E., Soulakellis, N. and Suppan, P. (2009) A Comparison between Modelled and Measured Mixing-Layer Height over Munich. Boundary-Layer Meteorology, 131, 425-440.
https://doi.org/10.1007/s10546-009-9373-7 - 26. Cui, Y.Y. and De Foy, B. (2012) Seasonal Variations of the Urban Heat Island at the Surface and the Near-Surface and Reductions Due to Urban Vegetation in Mexico City. Journal of Applied Meteorology and Climatology, 51, 855-868.
https://doi.org/10.1175/JAMC-D-11-0104.1 - 27. Gao, M., et al. (2015) Modeling Study of the 2010 Regional Haze Event in the North China Plain. Atmospheric Chemistry and Physics Discussions, 15, 22781-22822.
https://doi.org/10.5194/acpd-15-22781-2015 - 28. Pandey, P., et al. (2012) A Study of Urban Heat Island and Its Association with Particulate Matter during Winter Months over Delhi. Science of the Total Environment, 414, 494-507.
https://doi.org/10.1016/j.scitotenv.2011.10.043