Neuroscience & Medicine
Vol.2 No.4(2011), Article ID:8883,5 pages DOI:10.4236/nm.2011.24041
Investigation of the Relationship between Myopia and Intelligence in a Sample of Undergraduate Students
![]()
6286 Sleepy Hollow Rd, La Plata, Argentina.
E-mail: drmichaelpkelley@verizon.net
Received October 9th, 2011; revised November 16th, 2011; accepted November 27th, 2011.
Keywords: Myopia, SAT Scores, Academic Ability, Intelligence
ABSTRACT
In a sample of undergraduate students, myopia was associated with higher Math and Total SAT score, and males had higher Math and Total SAT scores than females. The association between myopia and higher Math and Total SAT scores was significant only among males, and the gender differences in Math and Total SAT scores were significant only among allergic participants. There were also significant associations between ethnicity and both myopia and SAT scores, but regression analyses revealed that ethnicity, gender, and myopia each made significant independent contributions to Math SAT scores. The findings provide support for Storfer’s theory of myopia and brain growth.
1. Introduction
The prevalence of myopia is elevated in intellectually gifted populations compared to the general population [1]. Students at medical schools, law schools, and prestigious universities show a higher prevalence of myopia than the general population (e.g., [2-5]). Children who scored higher than the 1 in 10,000 level for their age on the Scholastic Aptitude Test (SAT) prior to age 13 had very high rates of myopia [6,7]. Among members of societies whose membership is restricted to the top 1% or 2% of the population (e.g., Mensa) 45% of the females and 30% of the males had myopia [8]. Ashkenzic Jews show both substantially higher IQ scores than Caucasian norms (e.g., [9]) and higher prevalence rates of myopia compared to non-Jewish groups [10-12]. Among male Israeli military recruits, those with IQ scores of 128 or higher had nearly double the rate of myopia compared to those with IQ scores between 97 and 111, and nearly triple the rate found in those with IQ scores lower than 97 [13]. This latter finding suggests that there may be a relationship between myopia and intelligence across the range of intellectual ability, not just at the uppermost ranges of intelligence. A study of schoolchildren in Singapore failed to find any significant relationship between visual acuity and scores on standard exam [14]. A study of the relationship between schizotypy and lateral preference included questionnaire items assessing myopia and SAT scores, allowing an examination of the relationship between myopia and intelligence in an undergraduate sample.
2. Methods
2.1. Participants
The initial sample consisted of 744 undergraduates enrolled in introductory psychology courses at the University of Maryland, College Park. The study was approved by the UM Institutional Review Board. There were 439 females and 305 males, recruited via an announcement on a bulletin board for psychology experiments. Volunteers received instructions, informed consent forms and a questionnaire packet. All participants were offered extra credit in their psychology courses as an incentive to participation. The questionnaire included multiple choice items concerning ethnic group membership. Based on responses to these items, participants were classified into six ethnic groups. There were 483 Euro-American Whites (210 males, 273 females), 89 African-Americans (20 males, 69 females), 104 Asian-Americans (44 males, 60 females), 11 Middle Eastern (e.g., Syrians, Jordanians, etc.; 5 males, 6 females), 31 Hispanics (15 males, 16 females), and 26 “Other-Mixed” participants (11 males, 15 females). The ages of the participants ranged from 16 to 59, with a mean of 19.2 ± 3.51 years. The total sample consisted of 406 freshman, 210 sophomores, 89 juniors, and 39 seniors.
2.2. Measures
2.2.1. Myopia and Sex
The questionnaire used included the item “Are you nearsighted (myopic, have difficulty seeing things at a distance)?” to which participants responded either “yes” (N = 369) or “no” (N = 375). Another item asked “What is your sex?” to which participants responded either male or female. All 744 participants answered both items.
2.2.2. SAT Scores
The questionnaire included fill-in-the-blank items for Verbal, Math and Total Scholastic Aptitude Test (SAT) scores. These items were completed by 594 participants for Verbal SAT scores, 467 participants for Math SAT scores, and 487 participants for Total SAT scores.
2.3. Data Analyses
The effects of gender, ethnicity, and myopia on SAT scores were examined using these variables as grouping factors in analyses of variance with SAT scores as the dependent variables. Linear regression analyses were also conducted to evaluate the independent contributions of each of these predictor variables.
3. Results
An analysis of variance (ANOVA) with sex and myopia as grouping factors and Total SAT scores as the dependent variable yielded significant main effects of sex (F = 11.645, p = 0.001) and myopia (F = 4.192, p = 0.041). Males scored higher than females, and myopes scored higher than participants without myopia (Figure 1). Oneway ANOVAs with myopia as the grouping factor and Total SAT scores as the dependent variable conducted for males and females separately revealed a significant effect of myopia on Total SAT scores in males (F = 4.327, p = 0.039) but not in females (F = 0.464, p = 0.496). Separate oneway ANOVAs for participants with and without myopia, with sex as the grouping factor and Total SAT scores as the dependent variable, revealed that the sex difference in Total SAT scores was significant for myopic participants (F = 8.641, p < 0.004) but reached only a trend level of significance for participants without myopia (F = 3.132, p = 0.078).
A multivariate analysis of variance (MANOVA) with moypia and sex as grouping factors and Verbal and Math SAT scores as the dependent variables yielded a significant multivariate main effect of sex (F = 8.247, p < 0.000), and a mutivariate main effect of myopia which reached a trend level of significance (F = 2.455, p = 0.087). Univariate analyses revealed that Verbal SAT scores were not significantly influenced by sex, myopia, or their interaction, whereas Math SAT scores showed significant effect of both sex (F = 16.30, p < 0.001) and myopia (F = 4.683, p = 0.031), and the effect of the interaction of sex and myopia reached a trend level of significance (F = 2.952, p = 0.086). Males scored higher on the Math SAT than females, and myopes scored higher than participants without myopia (Figure 2). Oneway ANOVAs with myopia as the grouping factor and Math SAT scores as the dependent variable conducted for males and females separately revealed a significant effect of mypoia on math scores in males (F = 6.765, p = 0.010) but not in females (F = 0.090, p = 0.764).
Separate oneway ANOVAs for participants with and without myopia, with sex as the grouping factor and Math SAT scores as the dependent variable, revealed that the sex difference in math scores was significant for myopic participants (F = 14.181, p < 0.001) but reached only a trend level of significance for participants without myopia (F = 3.485, p = 0.063).
There was also a significant association between sex
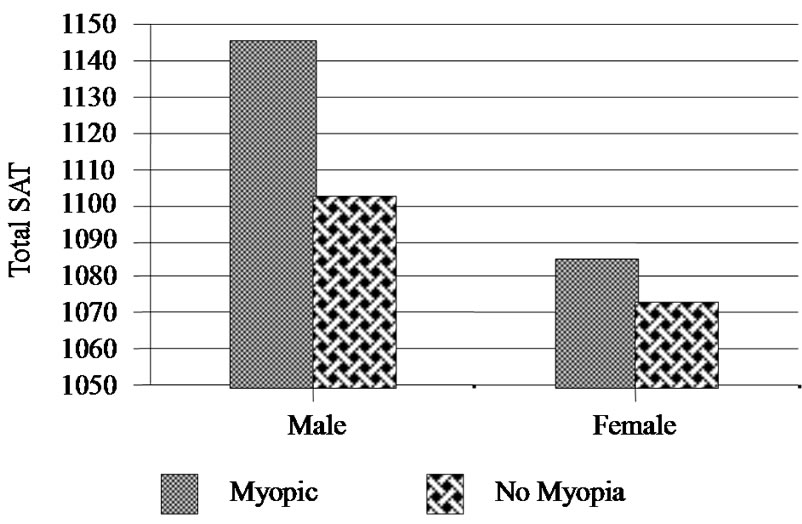
Figure 1. Effects of gender and myopia on Total SAT.
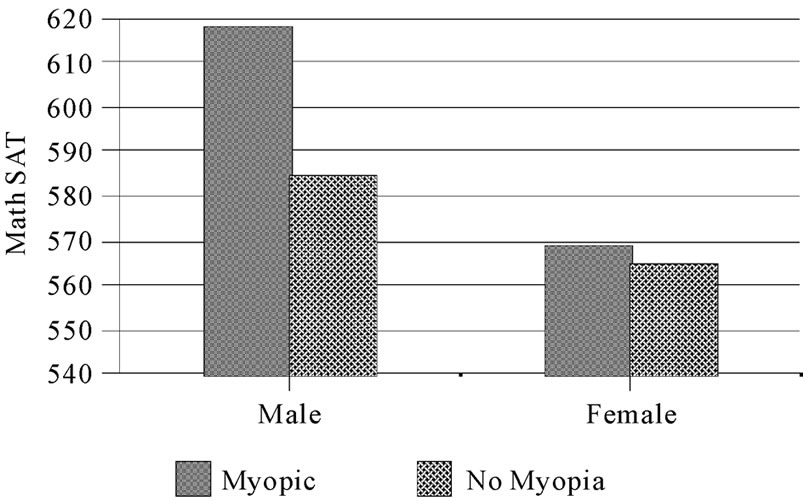
Figure 2. Effects of gender and myopia on Math SAT.
and myopia (П2 = 5.884, p = 0.015), as 55.7% of the females compared with only 44.3% of the males were myopic. The preponderance of female myopics was significant only among participants with Verbal SAT scores above the median, and only among participants with Math SAT scores or Total SAT scores below the respective medians for these measures (Table 1). The sex difference in the prevalence of myopia was particularly marked in participants above the median Verbal-Math discrepancy score (relatively better Verbal and poorer Math scores), but was not significant in those with relatively better Math and poorer Verbal abilities.
The Verbal-Math discrepancy score was used as a dependent variable in an ANOVA with sex and myopia as grouping factors. There was a significant main effect of sex (F = 7.880, p = 0.005), due to lower scores (relatively better Math and poorer Verbal scores) in males than in females.
The prevalence of myopia also differed among ethnic groups, at least for males. For all six ethnic groups, myopia was significantly associated with ethnicity among males (П2 = 12.359, p = 0.030) but not among females (П2 = 6.951, p = 0.224). When the analyses were restricted to the three largest ethnic groups, the association between myopia and ethnicity was significant for males (П2 = 10.515, p = 0.005) but reached only a trend level of significance for females (П2 = 5.340, p = 0.069). The prevalence of myopia was greatest among Asians (males: 65.9%; females: 65.0%), intermediate among Blacks (males: 50.0%; females: 59.4%), and least among Whites (males: 39.5%; females: 50.2%). The sex difference in myopia, with a greater prevalence among females, was significant only among Whites, the largest ethnic group (П2 = 5.438, p = 0.020). A MANOVA was conducted with participants belonging to these three largest ethnic groups using sex, myopia, and ethnicity as grouping factors, and Verbal and Math SAT scores as dependent variables. Of the multivariate effects, only the main effect of ethnic group reached significance (F = 12.439, p < 0.001). Univariate analyses revealed significant effects of ethnic group on both Verbal (F = 5.709, p = 0.004) and Math SAT scores (F = 25.173, p < 0.001). A posteriori comparisons using Duncan’s multiple range test revealed that Black had significantly lower scores than Whites and Asian, who did not differ significantly. The results of the MANOVA including ethnicity as a grouping factor suggest that once ethnicity was taken into account, the effects of sex and myopia on SAT scores failed to remain significant. However, linear regression analyses using ethnicity, sex, and myopia as predictors and the three SAT scores as the dependent variables revealed that all three predictor variables made significant independent contributions to Math SAT scores; sex and ethnicity significantly predicted Total SAT scores but the effect of myopia reached only a trend level of significance; and only ethnicity was a significant predictor of Verbal SAT scores (Table 2).
4. Discussion
In the present sample of undergraduate students, myopia was associated with higher Math SAT scores. These findings are consistent with previously published findings indicating a relationship between myopia and high intelligence [1], as SAT scores may be regarded as a proxy measure of intellectual ability. Storfer [1] proposed the theory that exposure to an environment containing high levels of visual complexity causes an enlargement in neurons in the cerebral cortex and the lateral geniculate nucleus responsible for processing visual inputs, with a resultant need for more and thicker axons connecting the eye with the cortex, generating pressure for an increase in the eye’s axial length, which is the proximate cause of myopia. Both myopia and intelligence have strong genetic determinants, and both have undergone secular increases whose rapidity cannot be accounted for by classical neo-Darwinian inheritance
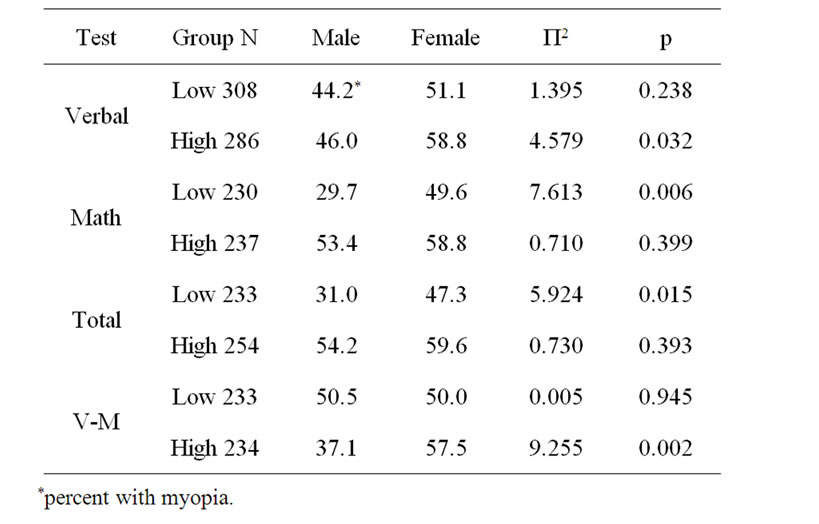
Table 1. Gender differences in myopia: sat score median split groups.
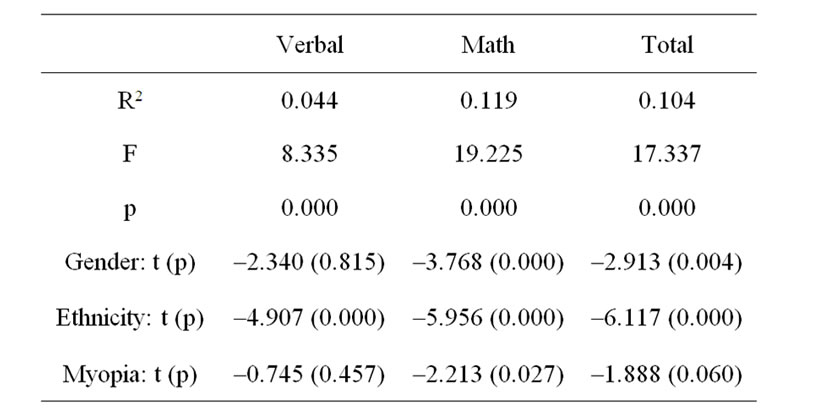
Table 2. Regression analyses of SAT scores.
mechanisms. Storfer [1] proposed that the secular increases in intelligence and myopia are the result of a rapid 20th century expansion in the size of neocortical association areas, and that recent ancestral experience with increasingly complex environments alters the extent and timing of gene expression in these areas during fetal neurodevelopment, via mechanisms involving genomic imprinting and gender-of-origin-based inheritance.
In the present study, a higher prevalence of myopia was associated with Math SAT scores, but not with Verbal SAT scores, and this association was significant in males but not in females. As in many previous studies, males performed significantly better than females in math. In general, men perform better than women on spatial cognition and mathematical reasoning tests, while women perform better than men on tests of verbal fluency, phonetics, and fine motor skills, and these sex differences are apparent prepubertally (e.g., [15-24]). Mathematical ability is associated with spatial ability (e.g., [15,19,25]). While the numerical system is represented primarily in the left parietal cortex, and acalculia (inability to perform simple calculations) is associated with lesions of the left parietal region, the right hemisphere also plays an important role in math problem solving. For example, correctly aligning numbers when performing multi-digit calculations involves spatial orientation abilities. Clearly, geometry involves visuospatial reasoning, and more difficult mathematical reasoning involves right-hemispherically mediated cognitive processes such as mental rotation and visual imagery. Mental rotation involves the creation and manipulation of internal images, which are important components of high-level mathematical thinking and reasoning. Many neuroimaging studies have demonstrated mental rotation to be mediated primarily by the parietal lobes, particularly on the right side (e.g., [26,27]). When performing 3-dimensional mental rotations, mathematically gifted male adolescents engaged a qualitatively different brain network than those of average math ability (predominantly right-sided activation), involving bilateral activation of the parietal lobes and frontal cortex, along with heightened activation of the anterior cingulate [28], suggesting an association between enhanced interhemispheric integration and superior math ability. Performance of spatial tasks such as the Hooper Visual Organization Test is associated with activation of visual association cortex, superior parietal lobule, and ventral temporal-occipital cortex [29]. Storfer’s [1] theory that myopia is associated with higher intelligence due to enlargement of neocortical association areas may apply particularly to mathematical and visuospatial intellectual abilities, which involve more right hemispheric processes and visual association areas in the parietal and temporal-occipital regions than does verbal intelligence.
Since women’s brains are smaller than men’s, but there is no overall sex difference in intelligence, “it follows that, as an environment’s visual complexity is increased, it will become increasingly harder for a female brain to accommodate the additional attentional strain” [1]. This led Storfer [1] to hypothesize that the increased prevalence and severity of myopia would be particularly marked in females exposed to an intense academic regimen or who have high IQs. In the present study, however, the relationship between myopia and higher Math and Total SAT scores was stronger in males than in females, in contrast to Storfer’s [1] hypothesis. There was a greater prevalence of myopia in females than in males, and this was particularly marked among participants with higher Verbal SAT scores and lower Math SAT scores. Among males with higher math scores, the prevalence of myopia increases markedly, narrowing the sex difference in myopia.
A methodological weakness of the present study was the use of a self-report questionnaire item to assess the presence or absence of myopia. The validity of such selfreport has not been ascertained. This method was employed because of the substantial savings in time and experimenter effort entailed. It does not seem very likely that participants would either not know whether or not they are near-sighted or that they would have reason to report this inaccurately. Nevertheless, future studies may be strengthened by the direct measurement of visual acuity. The measure of academic ability, SAT scores, was also assessed by retrospective self-report, rather than school records or test reports. Again, the degree of accuracy of such self-report is unknown. A future study could obtain participants’ permission to cross-check the university admissions database for their SAT scores, or even employ direct measurement of cognitive abilities. The use of an undergraduate sample likely selects for individuals above the population average in intelligence and academic ability. Future studies using general community samples may shed light on the generalizability of the present findings.
REFERENCES
- M. Storfer, “Myopia, Intelligence, and the Expanding Human Neocortex: Behavioral Influences and Evolutionary Implications,” International Journal of Neuroscience, Vol. 98, No. 3-4, 1999, pp. 153-276. doi:10.3109/00207459908997465
- E. B. Dunphy, M. R. Stoll and S. H. King, “Myopia among American Male Graduate Students,” American Journal of Opthalmology, Vol. 65, No. 4, 1968, pp. 518- 521.
- E. Goldschmidt, “On the Etiology of Myopia: An Epidemiological Study,” Acta Opthalmologica, Vol. 98, 1968, pp. 1-172.
- R. W. Parnell, “Sight of Undergraduates,” British Journal of Opthalmology, Vol. 35, 1951, pp. 467-472. doi:10.1136/bjo.35.8.467
- J. Wallman, “Nature and Nurture of Myopia,” Nature, Vol. 371, No. 2, 1994, pp. 201-202. doi:10.1038/371201a0
- C. P. Benbow and R. M. Benbow, “Biological Correlates of High Mathematical Reasoning Ability,” Progress in Brain Research, Vol. 61, 1984, pp. 469-490. doi:10.1016/S0079-6123(08)64455-6
- C. P. Benbow and R. M. Benbow, “Physiological Correlates of Extreme Intellectual Precocity,” Mensa Research Journal, Vol. 21, 1986, pp. 54-87.
- C. P. Benbow, “Possible Biological Correlates of Precocious Mathematical Reasoning Ability,” Trends in Neuroscience, Vol. 10, 1987, pp. 17-20. doi:10.1016/0166-2236(87)90117-2
- M. D. Storfer, “We, the Gifted: Prevalence of Childhood Myopia and Allergies in a High-IQ Population,” Mensa Bulletin, Vol. 382, December 1994, p. 11.
- M. D. Storfer, “Intelligence and Giftedness: The Contributions of Heredity & Early Environment,” Jossey-Bass, San Francisco & Oxford, 1990.
- W. R. Baldwin, “A Review of Statistical Studies of Relations between Myopia and Ethnic, Behavioral, and Physiological Characteristics,” American Journal of Optometry & Physiological Optics, Vol. 58, No. 7, 1981, pp. 516-527.
- D. Kantor, “Racial Aspects of Myopia in Compositors,” British Journal of Opthalmology, Vol. 16, 1932, pp. 49- 50.
- R. H. Post, “Population Differences in Visual Acuity: A Review, with Speculative Notes on Selection Relaxation,” Eugenics Quarterly, Vol. 9, 1962, pp. 189-212.
- M. Rosner and M. Belkin, “Intelligence, Education, and Myopia in Males,” Archives of Opthalmology, Vol. 105, 1987, pp. 1508-1511.
- M. Dirani, X., Zhang, L. K. Goh, T. L. Young, P. Lee and S. M. Saw, “The Role of Vision in Academic School Performance,” Ophthalmic Epidemiology, Vol. 17, No. 1, 2010, pp. 18-24. doi:10.3109/09286580903450320
- C. P. Benbow, “Sex Differences in Mathematical Reasoning Ability in Intellectually Talented Preadolescents: Their Nature, Effects, and Possible Causes,” Behavioural and Brain Sciences, Vol. 11, 1988, pp. 169-232. doi:10.1017/S0140525X00049244
- J. S. Hyde and M. C. Linn, “Gender Differences in Verbal Ability: A Meta-Analysis,” Psychological Bulletin, Vol. 104, No. 1, 1988, pp. 53-69. doi:10.1037/0033-2909.104.1.53
- E. S. Johnson and A. C. Meade, “Developmental Patterns of Spatial Ability: An Early Sex Difference,” Child Development, Vol. 58, 1987, pp. 725-740. doi:10.2307/1130210
- M. C. Linn and A. C. Petersen, “Emergence and Characterization of Sex Differences in Spatial Ability: A MetaAnalysis,” Child Development, Vol. 56, No. 6, 1985, pp. 1479-1498. doi:10.2307/1130467
- E. E. Maccoby and C. N. Jacklin, “The Psychology of Sex Differences,” Stanford University Press, Stanford, 1974.
- D. McGuiness, “When Children Don’t Learn. Understanding the Biology and Psychology of Learning Disabilities,” Basic Books, New York, 1985.
- M. Reite, C. M. Cullum, J. Stocker, P. Teale and E. Kozora, “Neuropsychological Test Performance and MEGBased Brain Lateralization: Sex Differences,” Brain Research Bulletin, Vol. 32, 1993, pp. 325-328. doi:10.1016/0361-9230(93)90195-H
- J. A. Sherman, “Sex-Related Cognitive Differences,” C.C.Thomas, Springfield, 1978.
- J. A. Sherman, “Sex Differences in Brain Function. In the brain: Recent Research and Its Implications,” College of Eucation, University of Oregon, Eugene, 1982.
- J. W. Van Strien and A. Bouma, “Sex and Familial Sinistrality Differences in Cognitive Abilities,” Brain and Cognition, Vol. 27, 1995, pp. 137-146. doi:10.1006/brcg.1995.1014
- I. M. Smith, “Spatial ability,” Robert R. Knapp, San Diego, 1964.
- K. Hugdahl, T. Thomsen and L. Ersland, “Sex Differences in Visuo-Spatial Processing: An fMRI Study of Mental Rotation,” Neuropsychologia, Vol. 44, No. 9, 2006, pp. 1575-1583. doi:10.1016/j.neuropsychologia.2006.01.026
- T. Thomsen, K. Hugdahl, L. Ersland, R. Barndon, A. Lundervold, A. I. Smievoll, B. E. Roscher and H. Sundberg, “Functional Magnetic Resonance Imaging (fMRI) Study of Sex Differences in a Mental Rotation Task,” Medical Science Monitor, Vol. 6, 2000, pp. 1186- 1196. doi:10.1016/j.cogbrainres.2005.08.004
- M. W. O’Boyle, R. Cunnington, T. J. Silk, D. Vaughan, G. Jackson, A. Syngeniotis and G. F. Egan, “Mathematically Gifted Male Adolescents Activate a Unique Brain Network during Mental Rotation,” Brain Research: Cognitive Brain Research, Vol. 25, No. 2, 2005, pp. 583-587.