Open Journal of Applied Sciences
Vol.4 No.2(2014), Article ID:43238,13 pages DOI:10.4236/ojapps.2014.42006
Hopf Bifurcation of a Two Delay Mathematical Model of Glucose and Insulin during Physical Activity
Jean Marie Ntaganda
Department of Applied Mathematics, School of Pure and Applied Science, College of Science and Technology, University of Rwanda, Huye Campus, Butare, Rwanda
Email: jmnta@yahoo.fr, jmntaganda@nur.ac.rw
Copyright © 2014 Jean Marie Ntaganda. This is an open access article distributed under the Creative Commons Attribution License, which permits unrestricted use, distribution, and reproduction in any medium, provided the original work is properly cited. In accordance of the Creative Commons Attribution License all Copyrights © 2014 are reserved for SCIRP and the owner of the intellectual property Jean Marie Ntaganda. All Copyright © 2014 are guarded by law and by SCIRP as a guardian.

Received 26 November 2013; revised 30 December 2013; accepted 7 January 2014
ABSTRACT
In this paper, we are interested in looking for Hopf bifurcation solutions for mathematical model of plasma glucose and insulin during physical activity. The mathematical model is governed by a system of delay differential equations. The algorithm for determining the critical delays that are appropriate for Hopf bifurcation is used. The illustrative example is taken for a 30 years old woman who practices regular three types of physical activity: walking, jogging and running fast.
Keywords
Systemic Arterial Pressure; Systemic Venous Pressure; Cardiovascular/Respiratory System; Delay; Numerical Simulation; Glucose; Insulin

1. Introduction It is known by physicians that lifestyle factors largely influence our health. These factors are diet, physical activity, smoking and psychological stress. The lifestyle changes have the incidence of cardiovascular respiratory diseases . The aspects of disordered glucoregulation result in those changes. Therefore two variables that have a bearing on glucose homeostasis are affected, that is, beta cell responses to glucose and affects the sensitivity of body to insulin. The key organs that control blood glucose are the pancreas and the liver. The key hormones are insulin and glucagon. These two functions pertain to Type 2 diabetes caused by an inability of insulin to lower plasma glucose levels effectively. In addition, people with poorly controlled diabetes are at higher risk of cardiovascular disease events, which are a major cause of morbidity and mortality. Large-scale clinical trials have demonstrated the benefits of tight control in Type 2 diabetes, minimizing disease complications, and improving quality of life . Obviously, it is essential to highlight the role played by the physical activity to Type 2 diabetes where there is low plasma insulin to an intravenous glucose challenge. Human bodies need to maintain glucose concentration level in a narrow range of 70 - 120 mg/dl or 3.9 - 6.7 mmol/l. If one’s glucose concentration level is significantly out of the normal range, there is hyperglycemia (greater than 140 mg/dl or 7.8 mmol/l) or hypoglycemia (less than 40 mg/dl or 2.2 mmol/l). The major long-term effects of diabetes are caused by hyperglycemia. Many researches are motivated by the large population of diabetes patients in the world and the big health expenses to study the glucose-insulin endocrine metabolic regulatory system - , what cause the dysfunctions of the system , how to detect the onset of the either type of diabetes including the so called pre-diabetes - , and eventually provide more reasonable, more effective, more efficient and more economic treatments to diabetics.
Since the 1960s, mathematical models have been developed to describe glucose-insulin dynamics . Some of these mathematical models are interested in analysing the glucose disappearance and insulin sensitivity during an intravenous glucose tolerance test and the capture of plasma glucose and insulin dynamics during, as well as after, periods of mild-to-moderate exercise . Others focus on overestimation of glucose effectiveness and the underestimation of insulin sensitivity , capture absorption, distribution and disposal dynamics . Recently, a mathematical model has been developed to capture the integral impact of physical activity to glucose and insulin . All these mathematical models are governed by ordinary differential equations but they do not consider the delays. The mathematics properties of the dynamic systems of glucose and insulin have been done by some workers . The use of ordinary and partial differential equations to model biological systems cannot capture the rich variety of dynamics observed in natural systems for attempting to better our understanding of more and more complicated phenomena. One of the ways to dealing with these complexities is to include delays in the mathematical models. The delays or lags can represent gestation times, incubation periods, transport delays, or can simply lump complicated biological processes together, accounting only for the time required for these processes to occur. The qualitative study of dynamical system is presented by Stépan while analysis study of mathematical models of the dynamic of glucose and insulin with delays has been presented. For instance, we can refer to . Furthermore, the discretization method for delay systems has been presented . Bifurcation and Hopf bifurcation as intermediate behavior between stability and instability for delay systems seem to be very important for dynamical systems . In this work, we focus on the mathematical model presented in where we add two positive delays and we are interested in its Hopf bifurcation.
This paper is organised as follows. In Section 2, we set mathematical model equations as well as equilibrium points. The Section 3 deals with the asymptotic states and algorithm for determining the Hopf bifurcation points. In Section 4 we present numerical simulation for a woman Type 2 diabetes during physical activity. The concluding remarks are presented in Section 5.
2. Setting Mathematical Model Equations In the most case the plasma glucose is disturbed from its equilibrium. Fortunately, there are other metabolic variables that being unchanged allow it to return to equilibrium. This metabolic process is referred to, as the mass effect of glucose, its own disposal or glucose effectiveness. Delays are also associated with glucose effectiveness, that is the return is not instantaneous and has a half-time of at least 30 minutes. The simplification of glucose by parenteral glucose infusion can be done in three ways: 1) reducing the delays associated with glucose kinetics, that is, the equilibration time; 2) decreasing the proportion of the insulin appearance as a consequence of the endogenous component; and 3) reducing the proportion of glucose fluxes due to endogenous origin . These effects have not the same role. The two last reduce unknown endogenous fluxes, reducing the overall system uncertainty, whereas the first reduces the time delay of the glucoregulatory system, accelerating its time response. In principle, the control of glucose is complicated by long time delays because they do not allow to determining the insulin dose needed to achieve and maintain tight glucose control.
The acute changes in plasma glucose concentrations may result in a thrombophilic condition as platelet adhesion is also enhanced by hyperglycemia . Hence the acute hyperglycemia causes endothelial dysfunction (possibly through a reduction of nitric oxide availability) and is responsible for nonenzymatic glycation and production of free-radicals with ensuing oxidative stress . The whole of such effects make mealtime glucose excursion a potential risk factor for cardiovascular disease in diabetic patients and especially in Type 2 diabetics. Furthermore, insulin has a major importance in treatment of diabetes. It is usually delivered subcutaneously, which delays the effect of the insulin in the blood as compared with to natural insulin in healthy persons that is secreted directly into the circulatory system. Human insulin is found in what is called hexamer form and the subcutaneous absorption of insulin in the hexamer form is really slow. The first experiment conducted by Kadish in 1964 closing the control loop in a patient with diabetes shows that the control action (insulin) was delivered in an intravenous way, which minimizes the delays related to insulin transport in tissues.
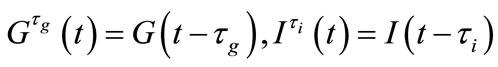
Two positive delays are added in bi-compartmental mathematical model presented in for showing the role of physical activity in controlling the plasma glucose level and in improving insulin sensitivity. The variation of these physiological parameters is function of heart rate and alveolar ventilation. In this way we consider that the flow plasma glucose and insulin in liver (LC) and pancreas (PC) compartments are delayed by two positive constants  and
and  respectively. As the cardiovascular respiratory system is regulated by heart rate H and alveolar ventilation
  via arterial pressure
  and venous pressure
  the mathematical model equations are written to take them into account. Blood flows between lungs and heart due to left
  and right
  cardiac output. The arterial pressure leads the tissues to receive the blood from cardiovascular respiratory system whereas the blood comes to cardiovascular respiratory system from tissues due to the arterial pressure. The respiratory control system varies the ventilation rate in response to the levels of dioxide
  and oxygen
  gases. Consequently, it arises the ventilation rate and cardiac output influence mutually. It is then obvious that exchanges between LC and PC are controlled by heart rate and alveolar ventilation functions. The mechanism of this control is not direct and can be represented by outflow functions between systemic arterial and venous compartments that depend on heart rate alveolar ventilation (Figure 1).
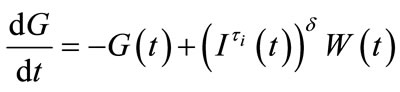
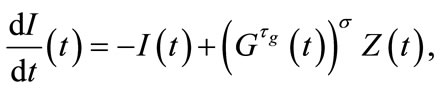
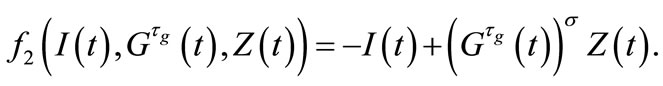
The mathematical model equations can be written as follows.

Figure 1. A schematic diagram of two compartments for modeling human glucose-insulin. Ql and Qr are left and right cardiac ow respectively. H is heart rate and denotes alveolar ventilation. PA and PV represent arterial and venous pressure respectively. τg and τi are respectively the time delay that takes the plasma glucose to return to equilibrium and time delay for sensitivity of insulin.
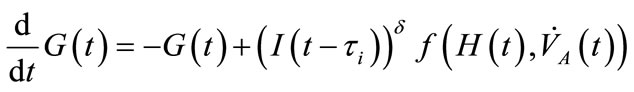 (1)
(1)
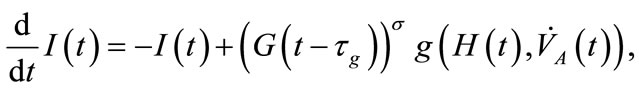 (2)
(2)
where the functions  and
and  denote respectively glucose and insulin at time t,
  and
and  are model constants and f, g regular model functions that can be identified by using data assimilation . Equations (1) and (2) arise from straightforward development of mass balance between glucose and insulin compartments.
In the context of determining the equilibrium of the system (1)-(2), let ,
,  ,
,  and
and  be the equilibrium states. At the equilibrium we have
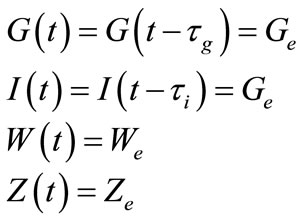
where we have set

so that
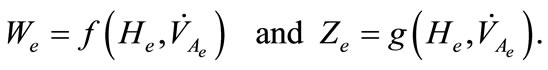
Therefore we have the system
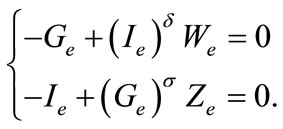 (3)
(3)
Since it is known that glucose and insulin take the values strictly positive that is
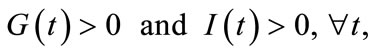
it follows that the equilibrium state is determined by
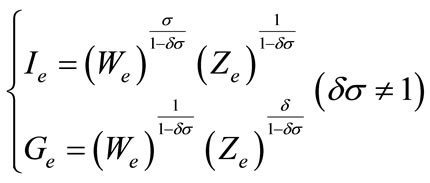 (4)
(4)
Proposition 2.1
Assume that
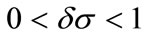
then the equilibrium state defined by (4) is stable. 
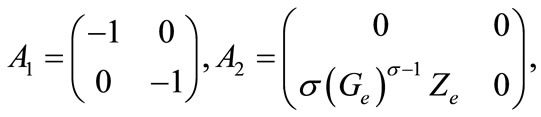
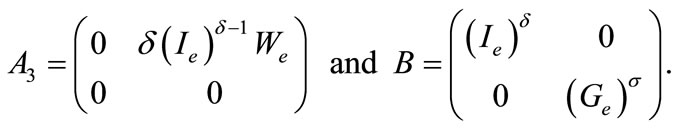
3. Asymptotic States The asymptotic states of the system (1)-(2) are determined by reformulating it in simple notations in order to find the linearized system around the equilibrium point. Hence, it is written as
 (5)
(5)
 (6)
(6)
where we have set
and

Let us take
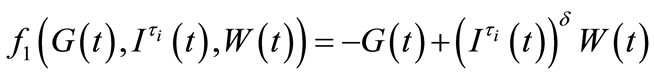
and
Using the first order Taylor series around the equilibrium point, we get
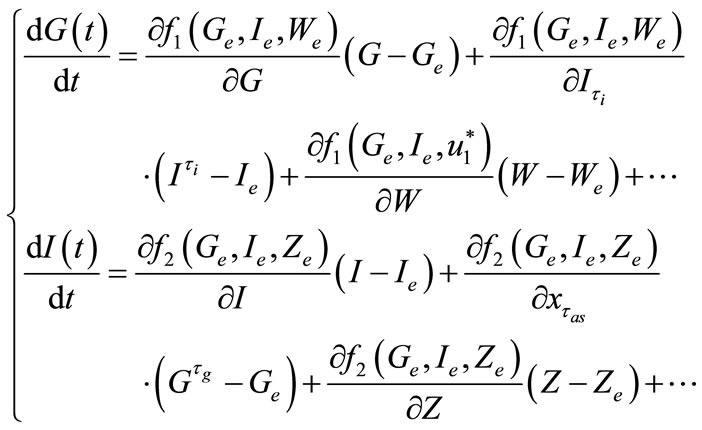 (7)
(7)
After calculation, the linearized system becomes
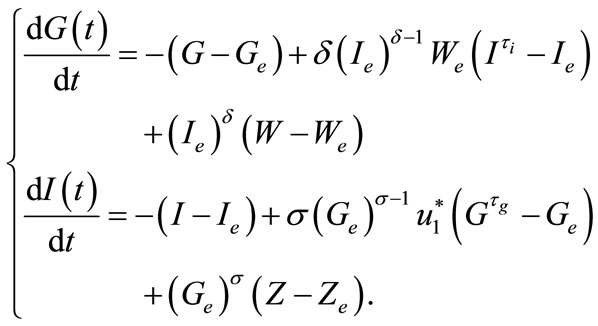 (8)
(8)
Setting

the system (8) becomes
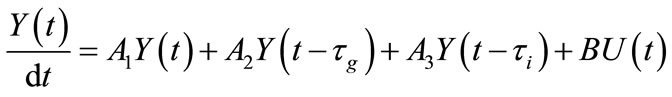 (9)
(9)
where we have set
The linear part, the part with delays and the part involving the controls are three different terms of second member of the system (9). In the stability study, the last one is not taken into account. The details related to this basic property for the stability of delay differential equations can be found in . Thereafter, we are interested in the following system
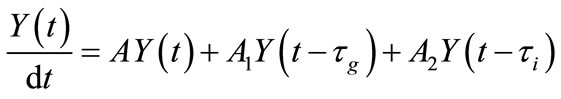 (10)
(10)
from which the characteristic equation becomes
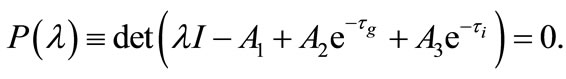 (11)
(11)
The calculation leads us to obtain
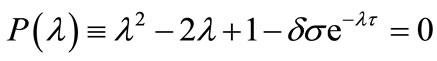 (12)
(12)
where
Investigation of bifurcation points is done using approach closed to that of the Alienor transformation for global optimization . First we need the following definition.
Definition 3.1
A subset  of
of  is s dense in
  if for all,
  there exists
  such that
  where
where  denotes the Euclidian distance between
  and
and .
. 
The proof of the following result can be found in .
Lemma 3.2
The Archimedean curve defined by the polar equation  is
is  -dense in

In (12) let us set , the determination of Hopf bifurcation points results in solving the system
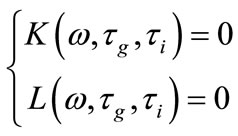
where
 (13)
(13)
are respectively real and imaginary part of  . Clearly, for some appropriate regular assumptions on functions
  and
and , there exists a point
such that  is solution of (12).
The purpose of calculation is to try and find out bifurcation points using the  -dense curves in
  For a fixed approximated
  we let
  to be a dense curve in
  and we set
 (14)
(14)
Let assume that there exists  and
and  solution of
 (15)
(15)
The point  is solution of (14) such that
  is a bifurcation point that depends on the parameter
 . Note that systems of type (15) are easier to solve than the system (14). In other words, a characterization of the space of bifurcation points can be done knowing properties of curves
The general algorithm for computing the bifurcation points from the systems (10) constitutes the main outcomes presented in . We adopt the algorithm to our situation as follows.
1) Set  and define
  as
as  -dense curve in
 ;
;
2) Write the functions  and
and  as defined in (13);
3) Define  and
and  where
where  is angle to be determined;
4) Find  solution of
  and
and ;
;
5) Set  as bifurcation point.
We apply this algorithm in order to get the parameter of Hopf bifurcation of the system (12). From the results presented in we set the parameter of Hopf bifurcations as given by
 (16)
(16)
where  is obtained at step 4 of above algorithm and
  is a constant to be appropriately chosen.. The curve defined by (16) is
  -dense in
  in the plane
 .
.
4. Simulation of Transition States for Physical Activity The role of physical activity in Type 2 diabetes is to maintain glucose concentration level in a narrow range and to improve insulin sensitivity. The numerical simulation is carried on three types of regular physical activity (physical exercise of 30 minutes per day) for a 30 years old woman: Walking, Jogging and Running Fast. The equilibrium values are presented in the Table 1 .
We consider the following identified functions f and g as presented in .

We consider the rest values of unhealthy woman. Therefore we take  and
and  for plasma glucose and insulin respectively. The equilibrium values (values for healthy person) of plasma glucose and insulin are taken as
  and
and  respectively and the constants
  and
and  are set as in that is
Taking  to have a curve that covers the space
  of the delay parameters given and setting initial value
  the algorithm above allows us to get
  so that considering three types of physical activities, the parameters of delay Hopf bifurcation are given in the Tables 2-4 respectively. Since Hopf bifurcation is intermediate behavior between stability and instability, the state of parameters is set in the way such that the delay parameters for stability are less than delay Hopf parameters while delay parameters for instability are greater than them.
Table 1. Equilibrium values cardiovascular and respiratory controls during physical activity for a 30 years old woman.
The test results for three types of physical activity related to different delay parameters from Tables 2-4 are illustrated in Figures 2-4. In each figure, we have illustrated a stable state and unstable that corresponds to delay parameters close to Hopf bifurcation point.
Phase portraits of each transition state are plotted in Figures 5-7.
Table 2. Delay parameters from the resolution of algorithm in the walking case where q* = 1.1393.
Table 3. Delay parameters from the resolution of algorithm in the jogging case where q* = 0.3905.
Table 4. Delay parameters from the resolution of algorithm in the running fast case where q* = 0.9457.
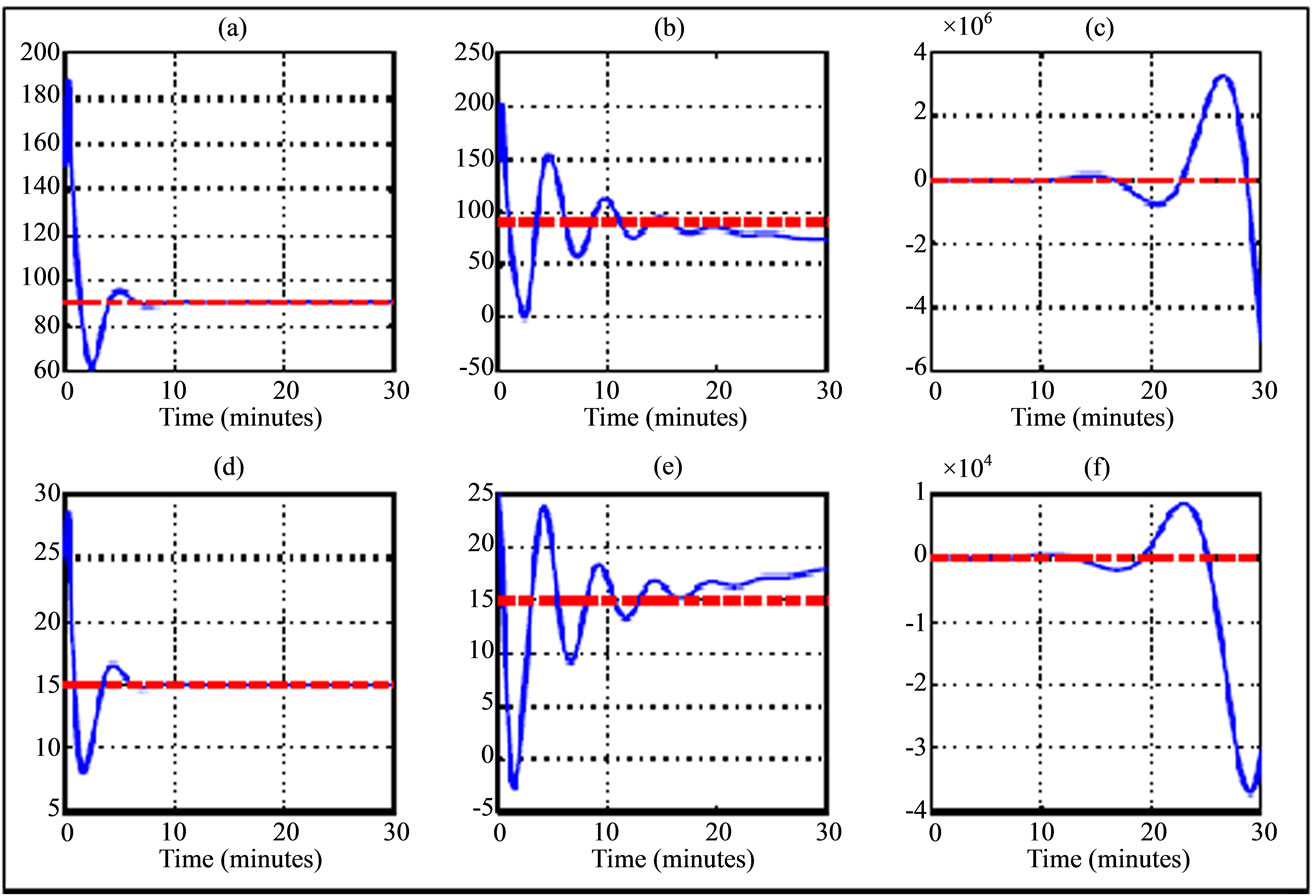
Figure 2. Variation trajectory of plasma glucose ((a)-(c)) and insulin ((d)-(f)) compared to their respective equilibrium value (dash line) for a 30 years old woman during walking physical activity. The simulations are related to delay parameters from Table 2. The transition phases are illustrated from left to right (phase asymptotically stable towards unstable phase) and the curves in the middle correspond to Hopf bifurcation parameters.
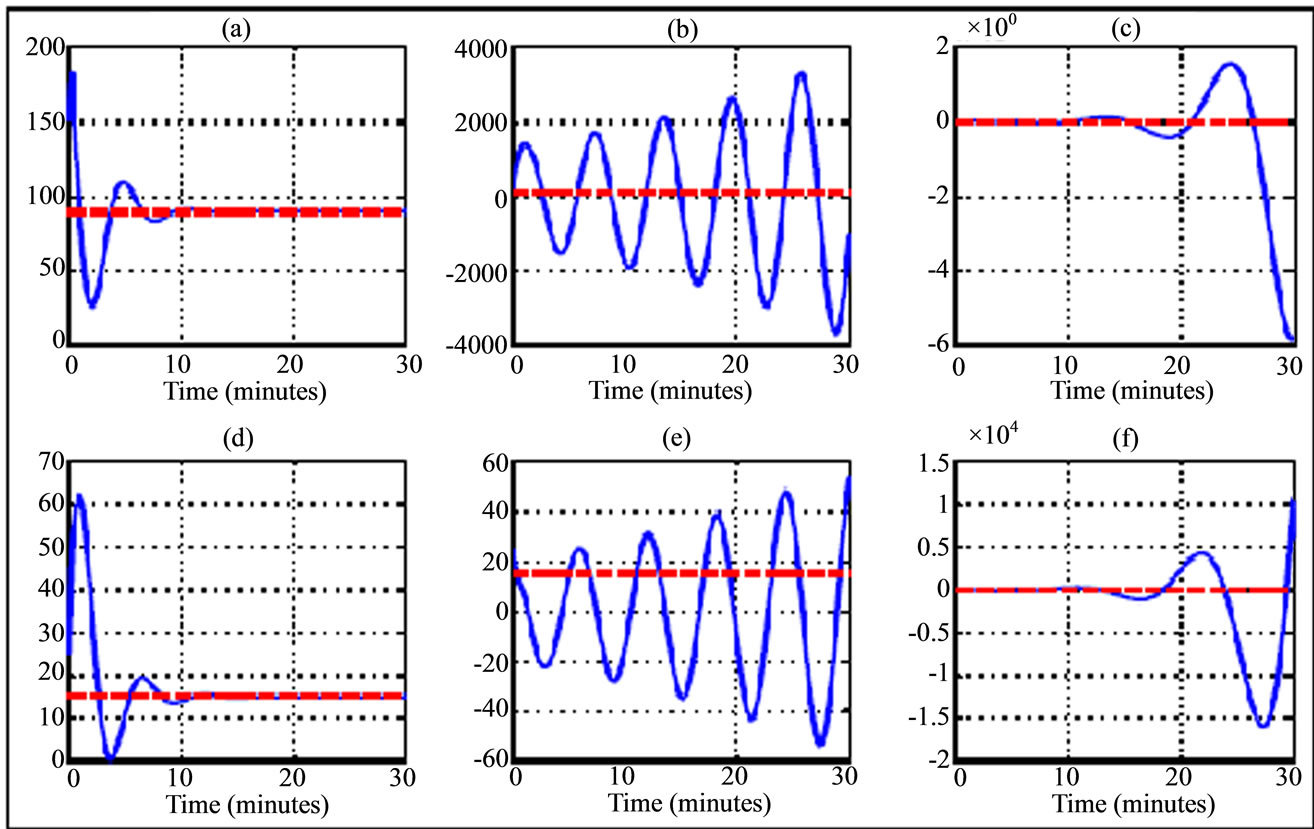
Figure 3. Variation trajectory of plasma glucose ((a)-(c)) and insulin ((d)-(f)) compared to their respective equilibrium value (dash line) for a 30 years old woman during jogging physical activity. The simulations are related to delay parameters from Table 3. The transition phases are illustrated from left to right (phase asymptotically stable towards unstable phase) and the curves in the middle correspond to Hopf bifurcation parameters.
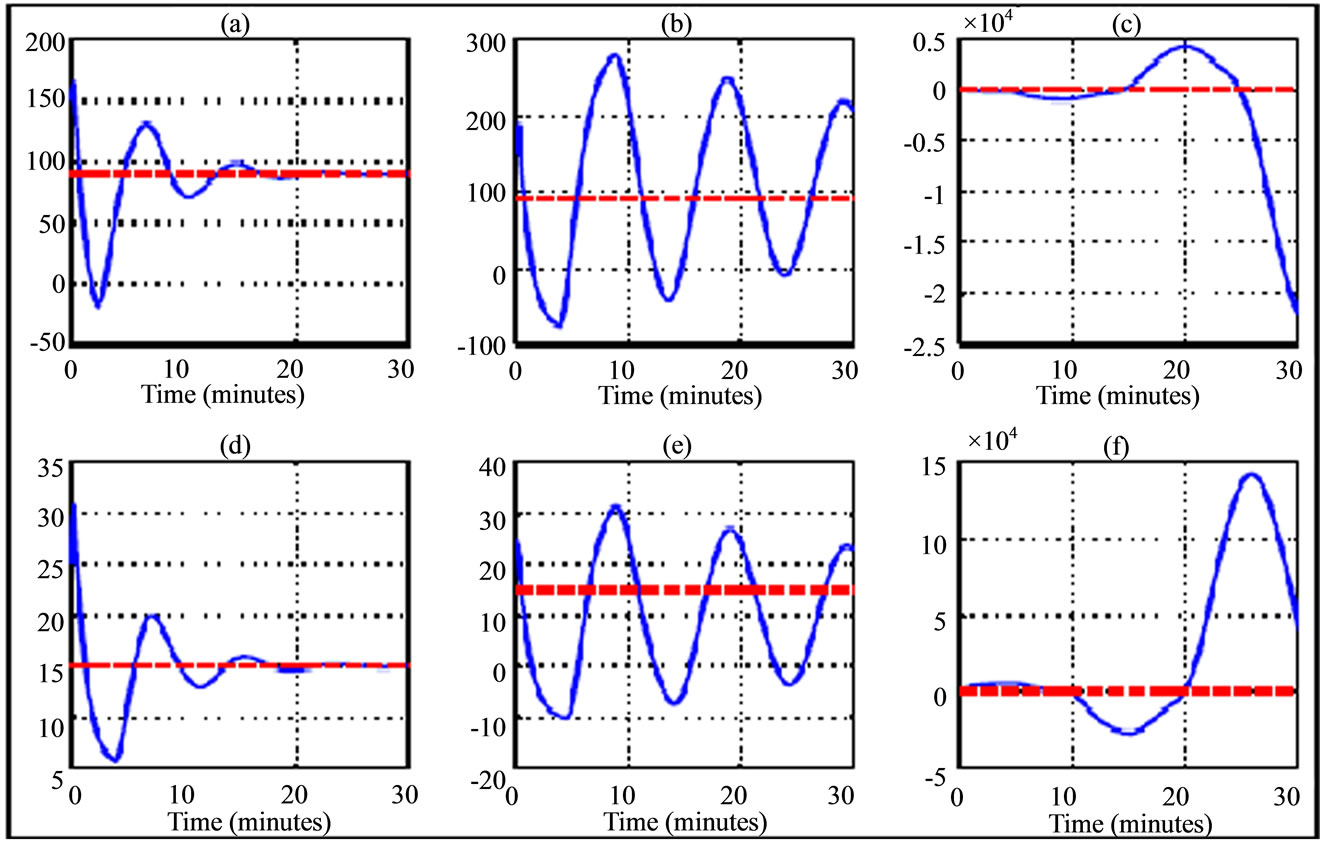
Figure 4. Variation trajectory of plasma glucose ((a)-(c)) and insulin ((d)-(f)) compared to their respective equilibrium value (dash line) for a 30 years old woman during running fast physical activity. The simulations are related to delay parameters from Table 4. The transition phases are illustrated from left to right (phase asymptotically stable towards unstable phase) and the curves in the middle correspond to Hopf bifurcation parameters.
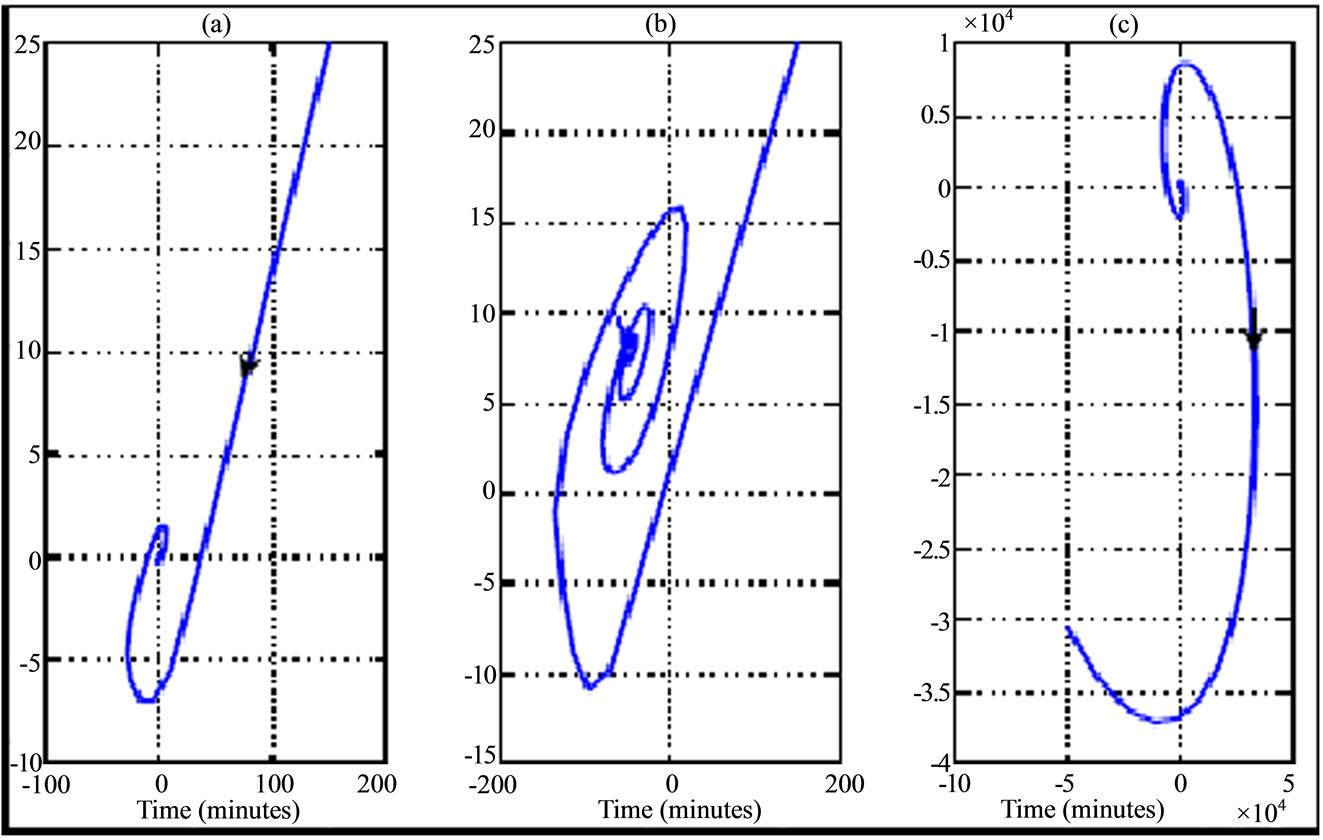
Figure 5. Phase portrait (plasma glucose versus plasma insulin according to variation of transition phases plotted in Figure 2) for a 30 years old woman during walking physical activity. The curves are illustrated from left to right (phase asymptotically stable towards unstable phase) and the curve in the middle correspond to Hopf bifurcation.
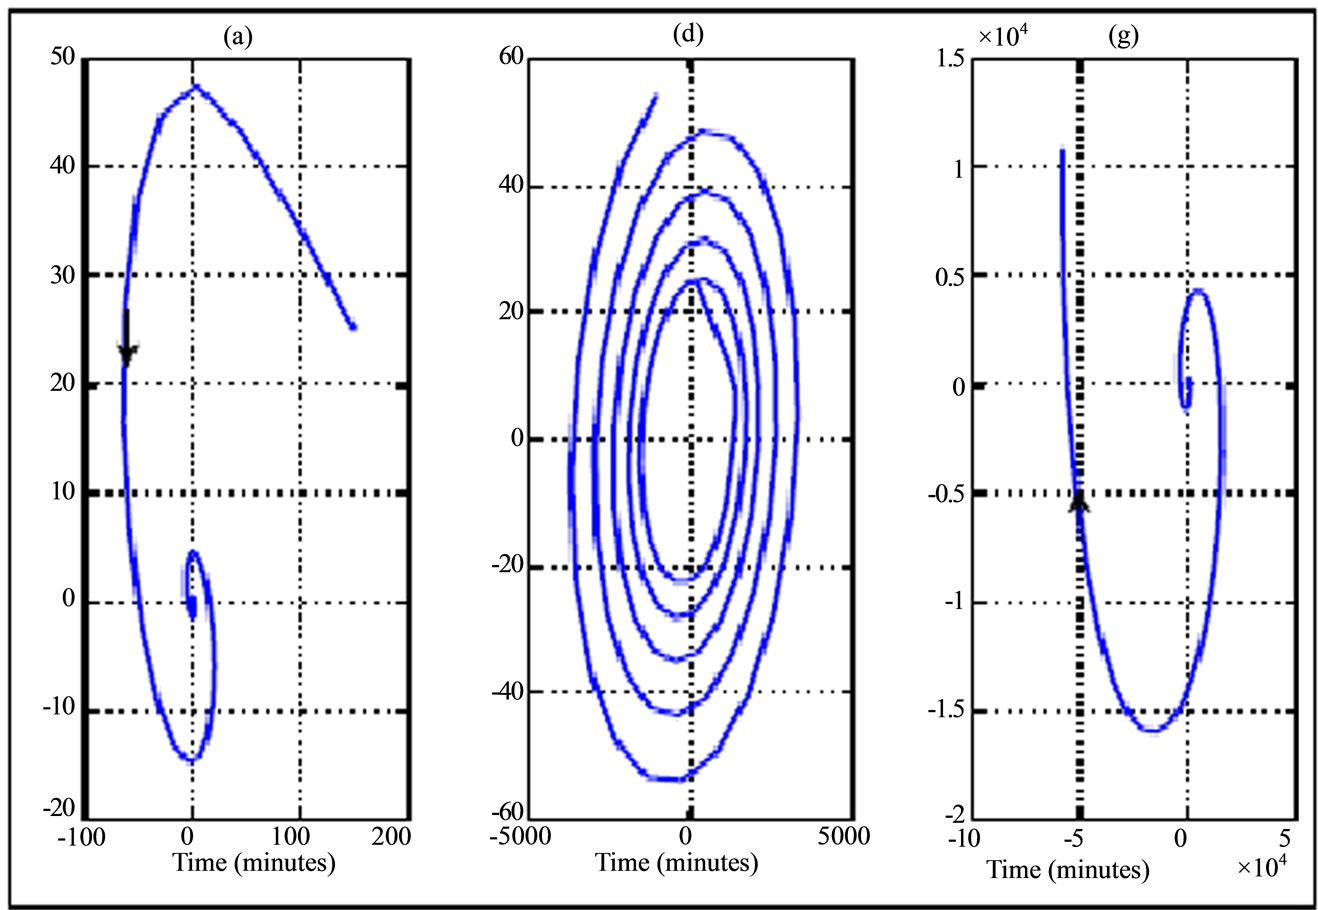
Figure 6. Phase portrait (plasma glucose versus plasma insulin according to variation of transition phases plotted in Figure 3) for a 30 years old woman during jogging physical activity. The curves are illustrated from left to right (phase asymptotically stable towards unstable phase) and the curve in the middle correspond to Hopf bifurcation.
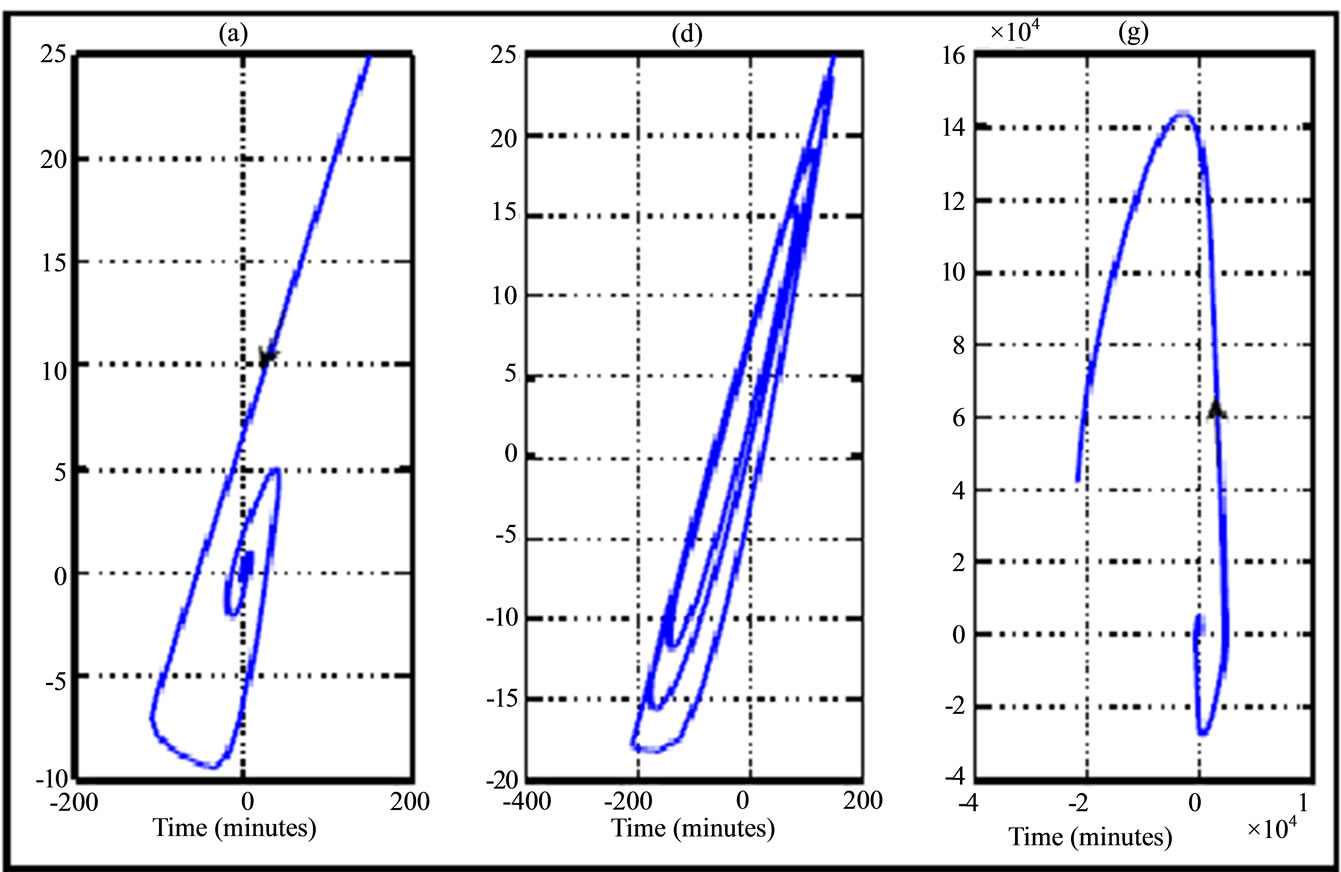
Figure 7. Phase portrait (plasma glucose versus plasma insuslin according to variation of transition phases plotted in Figure 4) for a 30 years old woman during running fast physical activity. The curves are illustrated from left to right (phase asymptotically stable towards unstable phase) and the curve in the middle correspond to Hopf bifurcation.
In the walking case as first scenario of physical activity, the numerical simulation of transition phase of plasma glucose and insulin dynamic uses the delay parameters given in Table 2. This transition phase is illustrated in Figure 2 while phase portrait those two physiological parameters for Type 2 diabetes are shown in the Figure 5. We note that during walking, a small perturbation of Hopf's delay parameters allows the subject to pass from stable state (Figures 2(a) and (d)) to unstable state (Figures 2(c) and (f)). In this situation of instability, it appears that the state of subject worsens from the 10th minute of a state close to the equilibrium. In the case of stability, the state of the subject remains stationary around the equilibrium but a small perturbation causes oscillations which correspond to Hopf bifurcations (Figures 2(b) and (e)). The small perturbation of Hopf bifurcation’s delay parameters can be used to tumble to an unstable state. The stability and instability behaviors of transition phase of plasma glucose and insulin dynamic are also shown by the phase portrait where we have a stable spiral (Figure 5(a)) and unstable spiral (Figure 5(c)).
The results of numerical simulation by taking delay parameters given in the Tables 3 and 4 respectively show the variation of transition phase of plasma glucose and insulin dynamic in jogging case (Figures 3 and 6) and running fast case (Figures 4 and 7). From these figures we note similarity in behavior to walking case (Figures 2 and 5).
5. Conclusion Remarks In this work, we have investigated Hopf bifurcation for a mathematical model that describes plasma glucose and the plasma insulin responses to cardiovascular and respiratory controls (heart rate and alveolar ventilation). An algorithm is used to find delay parameters of stability, instability and Hopf bifurcation for a 30 years old woman during three different physical activities which are walking, jogging, and running. The results show that Hopf bifurcations are the intermediate oscillation solutions from stability to instability regions.
References
Multiple Risk Factor Intervention Trial Research Group (1982) Multiple risk factor intervention trial: Risk factor changes and mortality result. The Journal of the American Medical Association, 248, 1465-1477. http://dx.doi.org/10.1001/jama.1982.03330120023025
Turner, R.C., Cull, C.A., Frighi, V. and Holman, R.R. (1999) Glycemic control with diet, sulfonylurea, metformin, or insulin in patients with type 2 diabetes mellitus: Progressive requirement for multiple therapies (UKPDS 49), UK Prospective Diabetes Study (UKPDS) Group. The Journal of the American Medical Association, 281, 2005-2012. http://dx.doi.org/10.1001/jama.281.21.2005
Bennett, D.L. and Gourley, S.A. (2004) Asymptotic properties of a delay differential equation model for the interaction of glucose with the plasma and interstitial insulin. Applied Mathematics and Computation, 151, 189-207. http://dx.doi.org/10.1016/S0096-3003(03)00332-1
Simon, C. and Brandenberger, G. (2002) Ultradian oscillations of insulin secretion in humans. Diabetes, 51, S258- S261. http://dx.doi.org/10.2337/diabetes.51.2007.S258
Sturis, J., Polonsky, K.S., Mosekilde, E. and Van Cauter, E. (1991) Computer-model for mechanisms underlying ultradian oscillations of insulin and glucose. American Journal of Physiology, 260, E801-E809.
Tolic, I.M., Mosekilde, E. and Sturis, J. (2000) Modeling the insulin-glucose feedback system: The significance of pulsatile insulin secretion. Journal of Theoretical Biology, 207, 361-375. http://dx.doi.org/10.1006/jtbi.2000.2180
Topp, B., Promislow, K., De Vries, G., Miura, R.M. and Finegood, D.T. (2000) A model of  -cell mass, insulin, and glucose kinetics: Pathways to diabetes. Journal of Theoretical Biology, 206, 605-619. http://dx.doi.org/10.1006/jtbi.2000.2150
Bergman, R.N., Finegood, D.T. and Kahn, S.E. (2002) The evolution of beta-cell dysfunction and insulin resistance in type 2 diabetes. European Journal of Clinical Investigation, 32, 35-45.
Bergman, R.N., Ider, Y.Z., Bowden, C.R. and Cobelli, C. (1979) Quantitative estimation of insulin sensitivity. American Journal of Physiology, 236, E667-E677.
Bergman, R.N. and Cobelli, C. (1980) Minimal modeling/partition analysis and the estimation of insulin sensitivity. Federation Proceedings, 39, 110-115.
De Gaetano, A. and Arino, O. (2000) Mathematical modeling of the intravenous glucose tolerance test. Journal of Mathematical Biology, 40, 136-168. http://dx.doi.org/10.1007/s002850050007
Mukhopadhyay, A., DeGaetano, A. and Arino, O. (2004) Modeling the intravenous glucose tolerance test: A global study for a single-distributed-delay model. Discrete and Continuous Dynamical Systems—Series B, 4, 407-417.
Bolie, V.W. (1961) Coefficients of normal blood glucose regulation. Journal of Applied Physiology, 16, 783-788.
Cobelli, C., Pacini, G., Toffolo, G. and Sacca, L. (1986) Estimation of insulin sensitivity and glucose clearance from minimal model: new insights from labeled IVGTT. American Journal of Physiology, 250, E591-E598.
Bergman, R.N., Phillips, L.S. and Cobelli, C. (1981) Physiologic evaluation of factors controlling glucose tolerance in man: measurement of insulin sensitivity and beta-cell glucose sensitivity from the response to intravenous glucose. Journal of Clinical Investigation, 68, 1456-1467. http://dx.doi.org/10.1172/JCI110398
Cobelli, C., Caumo, A. and Omenetto, M. (1999) Minimal model SG overestimation and SI underestimation: Improved accuracy by a Bayesian two-compartment model. American Journal of Physiology, 277, E481-E488.
Hovorka, R., Shojaee-Moradie, F., Carroll, P.V., Chassin, L.J., Gowrie, I.J., Jackson, N.C., Tudor, R.S., Umpleby, A.M. and Jones, R.H. (2002) Partitioning glucose distribution/transport, disposal, and endogenous production during IVGTT. American Journal of Physiology, Endocrinology and Metabolism, 282, E992-E1007.
Ntaganda, J.M. and Mampassi, B. (2012) Modelling glucose and insulin in diabetic during physical activity. Proceeding of the Fourth International Conference on Mathematical Sciences, Al Ain, 11-14 March 2012, 331-344.
Drozdov, A. and Khanina, H. (1995) A model for ultradian oscillations of insulin and glucose. Mathematical and Computer Modelling, 22, 23-38. http://dx.doi.org/10.1016/0895-7177(95)00108-E
Stépan, G. (1989) Retarded dynamical systems: Stability and characteristic functions. Longman, New York.
Li, J., Kuang, Y. and Mason, C.C. (2006) Modeling the glucose-insulin regulatory system and ultradian insulin secretory oscillations with two explicit time delays. Journal of Eoretical Biology, 242, 722-735.
Insperger, T. and Stépan, G. (2011) Semi-discretization method for time-delay systems. Springer, New York.
Adimy, M., Crauste, F., Hbid, M.L. and Quesmi, R. (2005) Stability and Hopf bifurcation for a cell population model with state-dependent delay. SIAM Journal on Applied Mathematics, 70, 1611-1633. http://dx.doi.org/10.1137/080742713
Engelborghs, K., Lemaire, V., Bélair, J. and Roose, D. (2001) Numerical bifurcation analysis of delay diberential equations arising from physiological modeling. Journal of Mathematical Biology, 42, 361-385. http://dx.doi.org/10.1007/s002850000072
Hovorka, R. and Cordingley, J. (2007) Parenteral glucose and glucose control in the critically Ill: A kinetic appraisal. Journal of Diabetes Science and Technology, 1, 357-365. http://dx.doi.org/10.1177/193229680700100307
Del Prato, S. and Tiengo, A. (2001) The importance of first phase insulin secretion: Implications for the therapy of type 2 diabetes mellitus. Diabetes/Metabolism, Research and Review, 17, 164-174. http://dx.doi.org/10.1002/dmrr.198
Giugliano, D., Ceriello, A. and Paolisso, G. (1996) Oxidative stress and diabetic vascular complications. Diabetes Care, 19, 257-267. http://dx.doi.org/10.2337/diacare.19.3.257
Kadish, A.H. (1963) Automation control of blood sugar a servomechanism for glucose monitoring and control. ASAIO Journal, 9, 363.
Pepe, P. and Jiang, Z.P. (2005) A Lyapunov-Krasovski methodology for ISS and IISS for time-delay system. Proceedings of the 44th IEEE Conference on Decision and Control, and the European Control Conference, Seville, 12-15 December 2005.
Cherruault, Y. (1999) Optimisation, méthodes locales et globales, mathématiques. Presses Universitaires de France, Paris. (in French)
Reval Langa, F.D., Abdoul Karim, M.T., Daoussa Haggar, M.S. and Mampassi, B. (2011) An approach for determining Hopf bifurcation points of multiple delayed linear differential systems. Pioneer Journal of Computer Science and Engineering Technology, 2, 35-42.