Computational Molecular Bioscience
Vol.2 No.1(2012), Article ID:18270,13 pages DOI:10.4236/cmb.2012.21003
Factors That Affect the Computational Prediction of Hot Spots in Protein-Protein Complexes
1College of Pharmacy, Nankai University, Tianjin, China
2State Key Laboratory of Elemento-Organic Chemistry, Elemento-Organic Chemistry Institute, Nankai University, Tianjin, China
3Department of Immunology, Beckman Research Institute of the City of Hope, Duarte, USA
Email: *NVaidehi@coh.org, *jianpinglin@nankai.edu.cn
Received February 1, 2012; revised February 21, 2012; accepted March 7, 2012
Keywords: Hotspot Prediction; Computational Mutagenesis; Concoord; Ensemble; Protein-Protein Complexes
ABSTRACT
Protein-protein complexes play an important role in the physiology and the pathology of cellular functions, and therefore are attractive therapeutic targets. A small subset of residues known as “hot spots”, accounts for most of the protein-protein binding free energy. Computational methods play a critical role in identifying the hotspots on the proteinprotein interface. In this paper, we use a computational alanine scanning method with all-atom force fields for predicting hotspots for 313 mutations in 16 protein complexes of known structures. We studied the effect of force fields, solvation models, and conformational sampling on the hotspot predictions. We compared the calculated change in the protein-protein interaction energies upon mutation of the residues in and near the protein-protein interface, to the experimental change in free energies. The AMBER force field (FF) predicted 86% of the hotspots among the three commonly used FF for proteins, namely, AMBER FF, Charmm27 FF, and OPLS-2005 FF. However, AMBER FF also showed a high rate of false positives, while the Charmm27 FF yielded 74% correct predictions of the hotspot residues with low false positives. Van der Waals and hydrogen bonding energy show the largest energy contribution with a high rate of prediction accuracy, while the desolvation energy was found to contribute little to improve the hot spot prediction. Using a conformational ensemble including limited backbone movement instead of one static structure leads to better predicttion of hotpsots.
1. Introduction
Protein-protein complexes are involved in various physiological processes and are also challenging targets for various pathological conditions. Protein-protein interaction surfaces are large and hence designing small molecule inhibitors that would disrupt the complex formation is a major challenge. It is known that a small subset of residues known as “hot spots” accounts for most of the protein-protein binding free energy [1]. Hot spots are shown to be surrounded by energetically less important residues forming a “hydrophobic O-ring” responsible for bulk solvent exclusion [2]. Identification of hotspots in protein-protein complexes is still challenging both experimentally and computationally, yet important to understand protein-protein binding and complex stability. It has been found that hot spots cannot be unequivocally defined by any single attribute such as location of the residue in the protein complex, charge, protein shape, or hydrophobicity [3-6]. Experimentally, alanine scanning mutagenesis has been used successfully on few proteinprotein complexes to probe the effect of these mutations on the stability of the protein-protein complexes to identify hot spots [7-11]. But alanine scanning mutagenesis is both laborious and expensive because hundreds of mutants need to be analyzed by biophysical methods [12]. Moreover, there are hotspots that are not in the proteinprotein interface. Such “allosteric hotspots” are more tedious to locate using experimental techniques. Therefore computational alanine scanning methods that can reliably predict hotspots and quantify the binding free energy is desirable [13-16].
In the past decade, a number of computational alanine scanning methods have been developed to identify hot spots. Simple empirical energy-based computational methods [17,18], linear interaction energy methods [19], Monte Carlo methods [20], and FOLDEF whose energy terms are derived for predicting protein stability [21] are computationally feasible, while still providing good prediction for more than 70% of the mutants. All these methods use a single protein-protein complex conformation from the crystal structure and empirical energy terms to calculate the change in protein-protein binding energy upon mutation. Protein-protein complexes are particularly dynamic and it is important to account for this flexibility while calculating the possible hotspots [22]. The protein-protein binding free-energy calculation using an all-atom forcefield (FF) combined with molecular dynamics simulations, has been used to improve the prediction of hot spots [16,23-26]. These methods provide good qualitative prediction of results, but they are still computationally intensive for many large protein-protein complexes [15]. There is change in binding free energy measured for several single point mutants in sixteen protein-protein complexes with known crystal structures of the complexes [17]. This serves as a gold standard for validating any computational method to predict hotspots.
In this paper, we have used alanine scanning method with all-atom forcefields (FF) and conformational sampling, for identifying hotspots in 16 different protein-protein complexes. We have compared the performance of various commonly used FF such as Charmm27 [27], AMBER9 (ff03) [28], and OPLS (2005) [29], towards prediction of hotspots in 16 protein-protein complexes with known crystal structures. We have also studied the role of implicit solvation methods such as Delphi [30], and Adaptive Poisson-Boltzman solvation APBS [31], in the hotspot predictions. Protein-Protein complex interfaces are dynamic and hence conformational sampling could play an important role in identifying hotspots. To keep the conformational sampling procedure computationally viable, we used a fast conformational sampling method based on geometric constraints Concoord [32], and studied the effect of sampling on the calculated protein-protein binding energies. Our results show that the Charmm27 FF predicts 74% of correct positives with a low percentage of false positives, while the AMBER force field (FF) performed better for the hot spot prediction (86% correct out of a total of 115 mutations), while showing a high rate of false positives. Desolvation energy was found to contribute little to improve the hot spot prediction efficiency. This is understandable given that most of the hotspots are dominated by small and hydrophobic residues [33]. Conformational sampling with Concoord improves the prediction efficiency of hot spots from 85% to 90%.
2. Computational Methods
2.1. Datasets
Datasets of single mutations and mutational data for 16 chosen protein complexes were taken from reference [17] and references therein, www.rtc.riken.go.jp/jouhou/pro therm/protherm.html, and http://mullinslab.ussf.edu/kurt /hotspot/index.php. The 16 protein complexes are shown in Table S1 of the supporting information.
2.2. Preparation of the Protein-Protein Complexes and Mutations
The coordinates of the 16 protein-protein complexes (shown in Table S1) were downloaded from the PDB databank. The program VMD [34] was used to add hydrogens. The potential energy of each protein-protein complex was minimized for 500 steps using conjugate gradient method in NAMD [35] (with Charmm force field [27]) and then annealed to 300K temperature. The annealed structures were minimized for 200 steps of conjugate gradient method in AMBER [28], Maestro 7.5 [36] upon which the minimization converged.
2.3. Methods for Calculating Protein-Protein Binding Free Energy and Alanine Scanning Mutations
We have calculated the protein-protein binding free energy using [24]
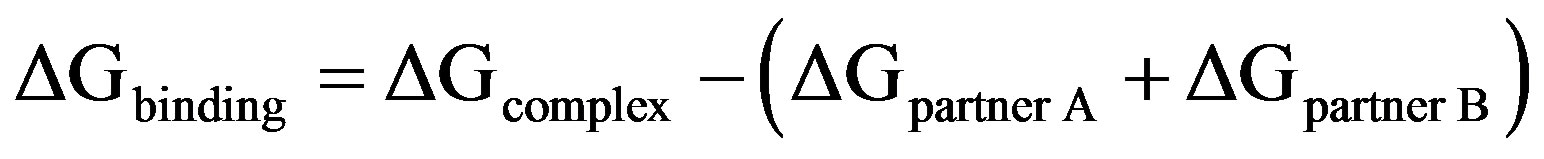 (1)
(1)
where
ΔG = Egas + ΔGsolvation
Egas = Einternal + Eelectrostaic + Evdw
Einternal = Ebond + Eangle + Etorsion
The Ebond, Eangle, Etorsion are contributions to the internal energy from the bonds, angles, torsion angles. The Eelectrostatic, Evdw are the electrostatic and van der Waals interaction energies, respectively. Egas was calculated using NAMD energy plugin in VMD [34] (for the Charmm FF [27]), MM_PBSA for the AMBER 9 FF (ff03 force field) [28], and Maestro 7.5 [36] for the OPLS2005 FF [29]). ΔGsolvation is the polar contribution to the solvation energy and was calculated using two methods, Delphi [30] (with 0.5 Å spacing grid, 1000 iterations, a dielectric constant of 2 for solute, 80 for exterior medium), and Adaptive Poisson-Boltzman Solvation APBS [31] (with 0.5 Å spacing grid, 1000 iterations, a dielectric constant of 2 for solute, 80 for exterior medium). Mutations were modeled using a mutation plugin in VMD [34]. And no more further optimization was performed [26].
The change in binding energy of the two monomers of a protein-protein complex, due to mutation to alanine is given by
 (2)
(2)
where “mut” represents mutants, WT represents wild type structures. DDGbinding is the change in binding energy of the two monomers upon mutation of a single residue in the complex to alanine.
2.4. Hydrogen Bonding Energy
Since none of the FF tested here have an explicit hydrogen bond term, we have examined the effect of hydrogen bonding potential on the protein-protein binding energy, using a stand alone hydrogen bond potential [37]. The hydrogen bond potential we have used is given by:
 (3)
(3)
where ε is a weight of the hydrogen bond interaction; σ is given by s = 1.73R0, R0 is the optimal distance between hydrogen donor D and acceptor A at minimal potential, Emin; θ and θ0 are the D-A-AA and target D-A-AA angles, respectively (D indicates donor; A , acceptor; AA, acceptor antecendent). SW is a switching function [38] to smoothly decrease Ehond to zero beyond a cut-off distance.
2.5. Concoord Conformational Sampling
Conformational sampling was performed using Concoord [32], a method that starting from a crystal structure, generates protein conformations that fulfill a set of upper and lower interatomic distance limits which depends on distances measured in experimental structures and the strength of the interatomic interactions. For each wild type protein complex structure, we generated 60 conformers [from reference 39, 60 is a reasonable number of conformers for convergence] and then performed alanine scanning mutation for each of the 60 conformers. For each conformer, mutations were modeled using a mutation plugin in VMD [34]. And no more further optimization was performed [26]. The binding energy was calculated as the average of all the binding energy for each conformation in the ensemble.
3. Results and Discussion
The change in binding free energy (interaction energy between partners of protein complex + desolvation energy) as defined in the methods section was calculated for a total of 313 mutations in 16 protein-protein complexes. This test set was chosen due to availability of the experimentally measured change in binding free energies upon several alanine mutations. Additionally, these 16 protein complexes have known crystal structures. In our calculations, hot spots are defined as residues that show a change in calculated or observed binding affinities of more than 1 kcal/mol upon alanine replacement, and “neutral residues” are those positions which upon mutation to alanine show less than 1 kcal/mol difference in predicted or observed protein-protein binding affinities [17]. The number of total hotspots is a combination of those hotspots present in the protein-protein interaction interface, and the hotspots that have allosteric effect on protein-protein interactions. Neutral residues do not affect the protein-protein interaction upon mutation.
3.1. Comparison between Different Force Fields
Table 1 shows the % correct predictions for various FF and also the various energy components in each of these FF. The first three rows of Table 1 shows the percentage of hotspots and neutral residues predicted correctly with various all-atom FF. The AMBER FF performed better among the three, with 86% correct prediction of total hotspots and 93% for the hotspots in the interface, while showing a high percentage of false positives or low percentage of correct prediction of neutral residues as shown in Figure 1. The Charmm27 FF on the other hand shows good prediction for both hotspots (74%) and for neutral residues (61%) and the OPLS force field predicted the least number of hot spots among the three FF. All of the three force fields predicted more than 60% of the hot spots. Interfacial hot spots have higher percentage of correct prediction than the allosteric ones.
3.2. Effect of Solvation on Prediction of Hotspots
Two continuum solvent methods solving the PoissonBoltzman equations, namely the Adaptive Poisson-Boltzman solvation (APBS) [31] and Delphi [30] were tested in the prediction of hot spots. From Table 1, it is seen that inclusion of solvation effects using Delphi improved
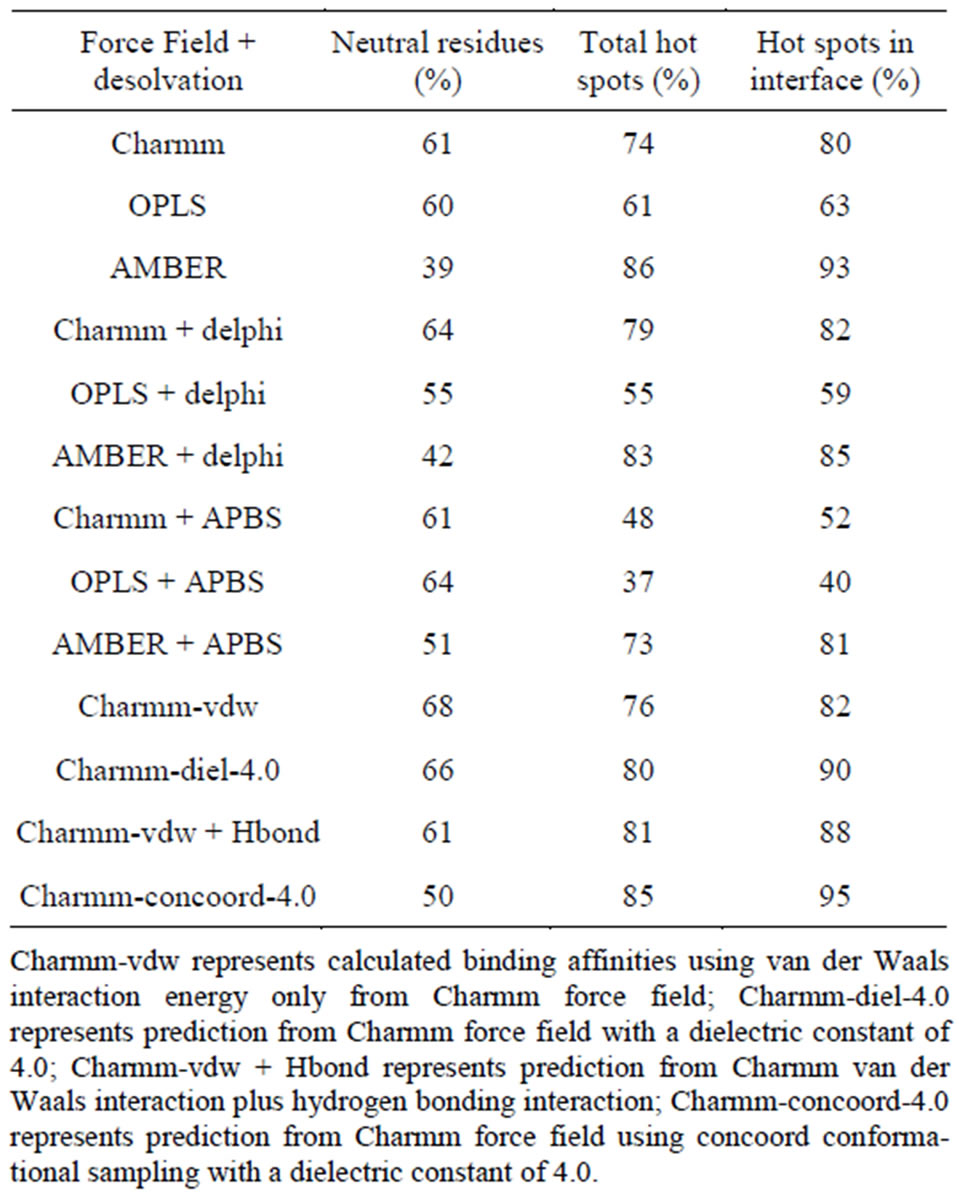
Table 1. Comparison of the performance of different all-atom force fields and solvation models for hot spot prediction.
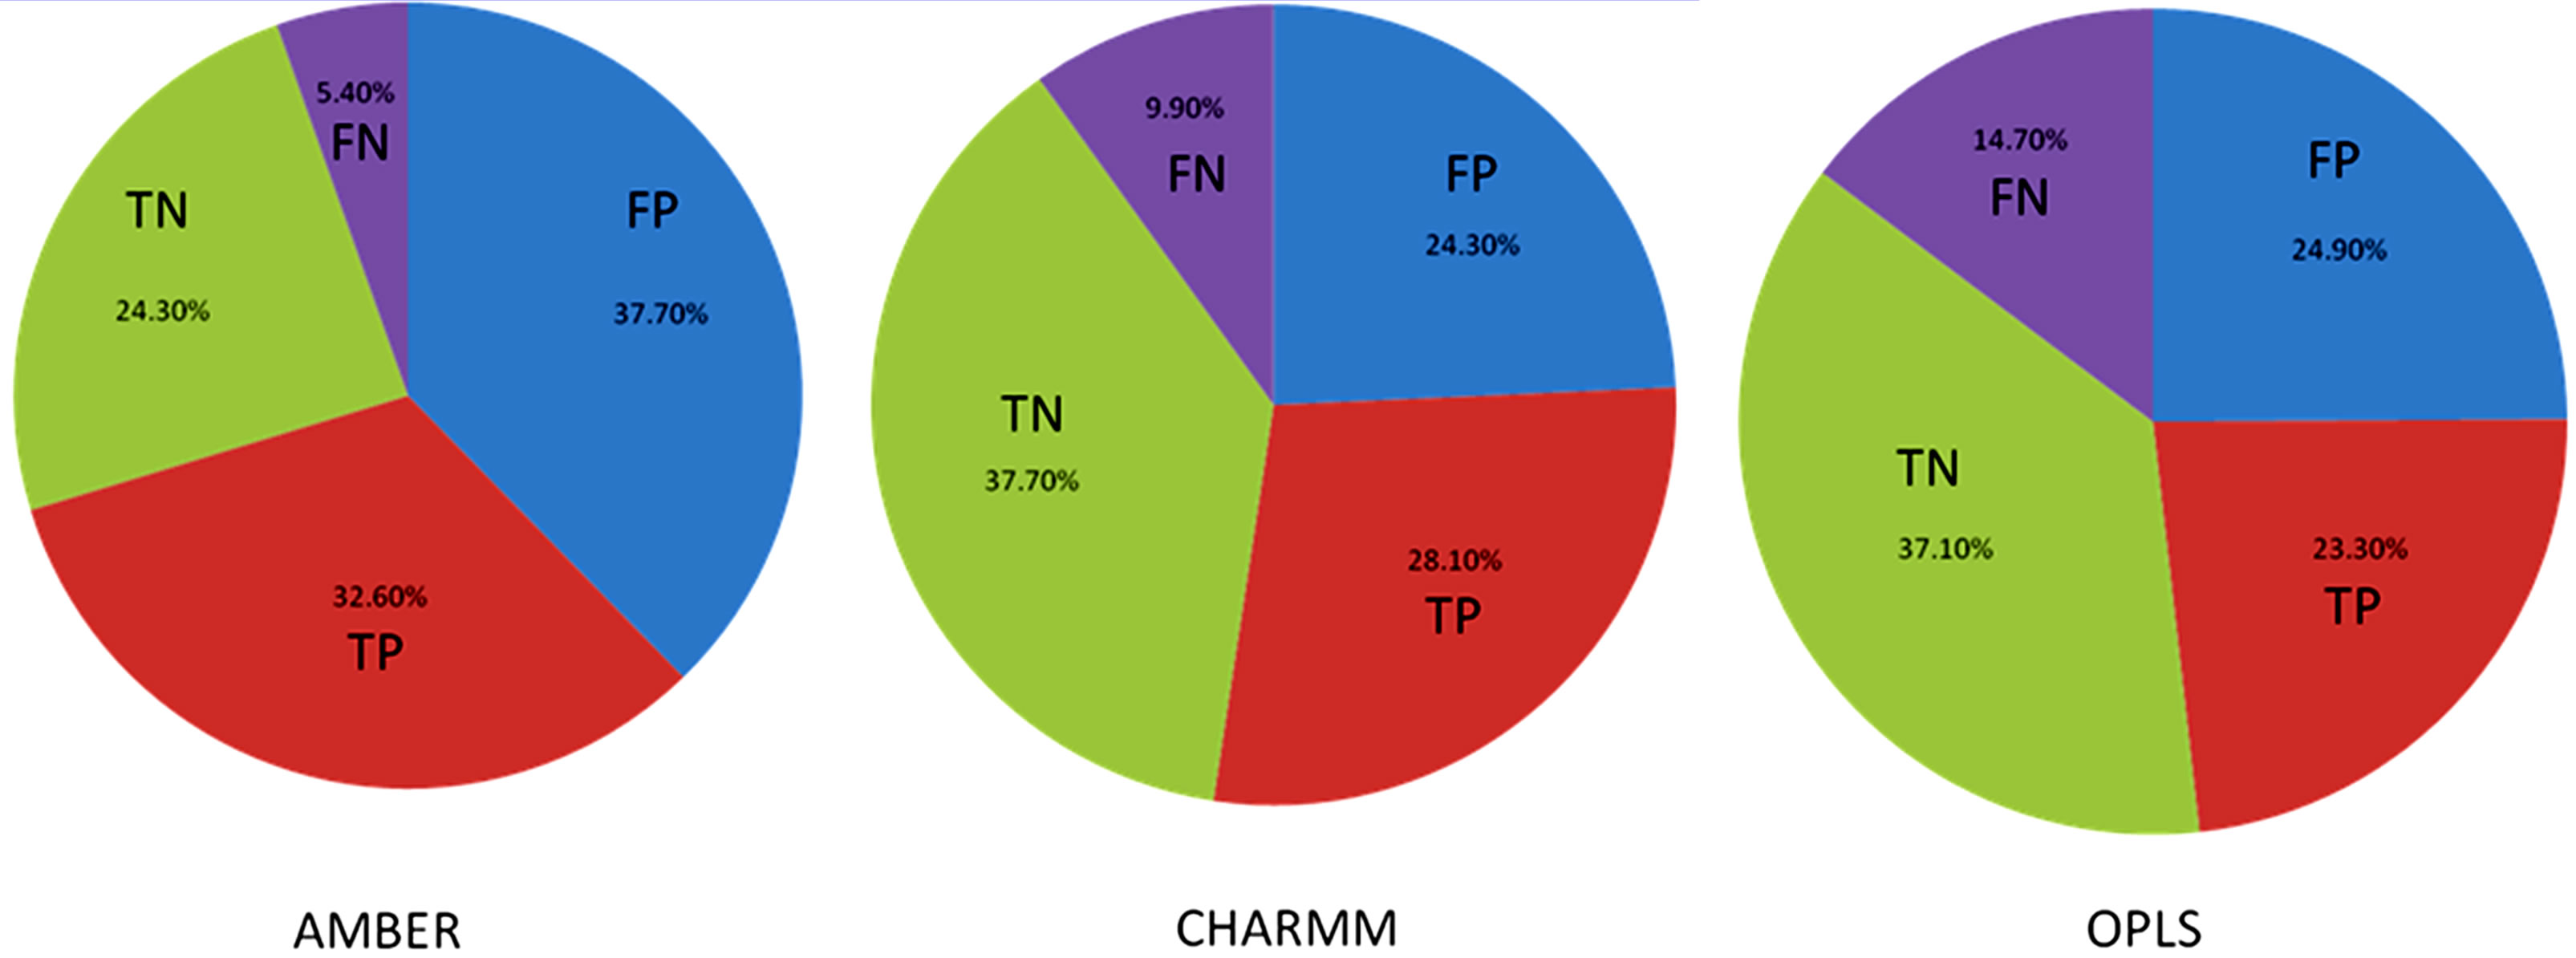
Figure 1. Pie chart of the prediction of hot spots and neutral residues for different force fields. TP is the true positive, neutral residues are true negative (TN). FP represents false positive, and FN represents false negative.
both the hotspot (from 74% to 79%) and neutral residue (from 61% to 64%) predictions for the Charmm force field. For other forcefields, inclusion of the solvation energies, decreased the percentage of hotspot residues predicted. Overall the effect of solvation is minor on hotspot predictions since most of the residues in the interface are hydrophobic and hence burial desolvation penalty is low. This is consistent with the analysis of the nature of residues in the interface of protein-protein complexes [33] and the O-ring hypothesis [2] that most of the hot spot residues are small and hydrophobic or that the hot spot residues are surrounded by hydrophobic residues (form an O-ring) to block the interactions between hot spot and solvent.
We have further analyzed the effect of solvation on prediction of mutation of polar versus non-polar residue hotspots. Tables S2-S4 of the supplementary material shows this data. It is seen that Amber FF performed the best with 85% of polar mutants and 88% of non-polar mutants for hotspots predicted correctly. This percentage is not affected substantially by inclusion of solvation. This is because the polar residues still stay partially solvated even upon formation of protein-protein interface. The protein-protein interface is dynamic and has a substantial solvent exposed surface area. Charmm FF with Delphi solvation predicted 68% of true positives with 73% of polar hot spots, and 84% of non-polar hot spots. The prediction of hotspots worsened by including solvation with OPLS force field. From this section onwards we have pursued further analysis with Charmm FF only, since Charmm FF with solvation showed the best prediction of hotspots.
3.3. Effect of Electrostatics and Van Der Waals Interactions on Hot Spot Predictions
To understand the role of various energy components such as electrostatics and van der Waals interactions in the protein-protein interface, we separated the van der Waals interaction energies and calculated the percentage of mutation residues predicted using just the van der Waals and electrostatic interactions. As seen in Table 1, using van der Waals interactions alone we find that the Charmm FF predicts about 2% more hotspots than using the complete energy function in Charmm. This indicates that the van der Waals interaction is critical to the protein-protein interface interactions. The study of proteinprotein interactions by other groups have shown that van der Waals interactions are important [39,40] in hot spot predictions. From Table S5, including Delphi solvation energy with Charmm-VDW reduced the prediction of hotspots dramatically. This indicated that solvation energy compliments the electrostatic interaction, and should not be included if the electrostatics are omitted [26,39].
Baker and coworkers showed that [17], hydrogen bonding term provides a better description of polar interactions in protein interfaces than electrostatics with a prediction of 76% over 56% [17]. Accurate calculation of electrostatics is notoriously difficult and the protein internal dielectric constant has been shown to be important in binding energy prediction [26,39]. This is a tricky parameter when it comes to calculating protein-protein interaction energies since these surfaces could be solvent exposed. Therefore we studied the effect of a range of internal dielectric constant varying from 1 to 80 for the calculation of electrostatic energies. We use the mutations available for the protein-protein complex (1JCK) as an example to optimize the internal dielectric constant to be used for the hot spot predictions. We chose this system since there are only nine mutants including 8 hot spots with polar, non-polar, charged amino acids. Figure 2 shows the variation of the calculated change in binding energy as a function of the dielectric constant and it shows that the electrostatic energy difference and the binding energy difference become stable when the dielectric constant is greater than 4. We examined the effect of electrostatic interactions on hotspot predictions with dielectric 4.0 in Charmm FF. From Table 1, we can

Figure 2. Effect of the dielectric constant on the difference in the total binding energy and electrostatic energy.
see that the prediction of hot spots increased by 4%, and the prediction of interfacial hot spots increased by 10%.
3.4. Effect of Hydrogen Bond Energy on Hot Spot Predictions
Since the electrostatic energies are notoriously difficult to calculate accurately especially at the protein-protein interface, we added an explicit hydrogen bond function to examine if we could eliminate the electrostatic component of the energy. Moreover, the all-atom forcefields tested in this study do not have an explicit hydrogen bond term in the potential energy function. To be able to test the influence of the hydrogen bonds on protein-protein interactions we used an explicit hydrogen bond function described in detail in the Methods section (Section 2.4). We calculated the hydrogen bond energy using this function and added the van der Waals energy from Charmm FF. It is seen from Table 1, that the hot spot prediction improves by 5% upon inclusion of hydrogen bond energies, compared to using only van del Waals energies. This correlates with the fact that residues that most frequently form a hot spot are tryptophan (21%), arginine (13%), and tyrosine (12%) [15], those show both hydrogen bonding as well hydrophobic interaction with other residues. If hydrogen bonding energy alone was used to predict the hot spot, only 9.8% of the hot spots (data not shown in the table) were predicted correctly. This indicates that hydrogen bonding energy is important in predicting hotspots, but is not as important as van der Waals energy. Since the intermolecular electrostatic and polar solvation free energies cancel each other upon proteinprotein binding [26,41], one needs only hydrogen bonding and van der Waals energies to predict the hot spots.
3.5. Effect of Conformational Sampling on Hotspot Predictions
Because protein-protein interface is dynamic, making mutations in the interface could lead to conformational changes in the neighborhood of the mutations or in some cases even show allosteric conformational changes. Here we have examined the effect of including conformational sampling (both backbone and side chains) in the prediction of hotspots. For faster computations, we have used a distance constraints based method, known as Concoord [32]. It has been shown that the sampling done by Concoord method is equivalent to MD simulations [32]. We have used Concoord method to generate a conformational ensemble for each of the 15 protein-protein complexes. One of the 16 protein-protein complexes was omitted because it is a multimer and not feasible with Concoord. The RMSD in coordinates of the Cα atoms in the ensemble of conformations generated by Concoord for the various protein complexes, varies from 1.8 Å to 6.0 Å. The variation in conformations in the ensemble for each protein comes mostly from the loop regions. The RMSD spread in the protein-protein interface is between 0.6Å and 2.6 Å. Compared to the entire proteins, the protein-protein interface is more rigid. Figure 3 (a) shows the fluctuation of the interfacial residues for 60 conformers of protein 1JCK and Figure 3(b) shows the RMSD by residues (RMSF) of the protein. Figure 3 shows that the conformations generated by Concoord [32] show variability in the interface. The RMSF figure shows that the interfacial residues are more rigid than the rest residues of the proteins (see Figure S2 for RMSF of other proteins). From Table 1 it is clear that including conformational sampling for the protein-protein complexes leads to 85% correct prediction of the hotspots and 95% of interfacial hot spots predicted which is a substantial increase compared to using single static conformation. 3.6 Comparison of calculated change in binding energy to the experimental values.
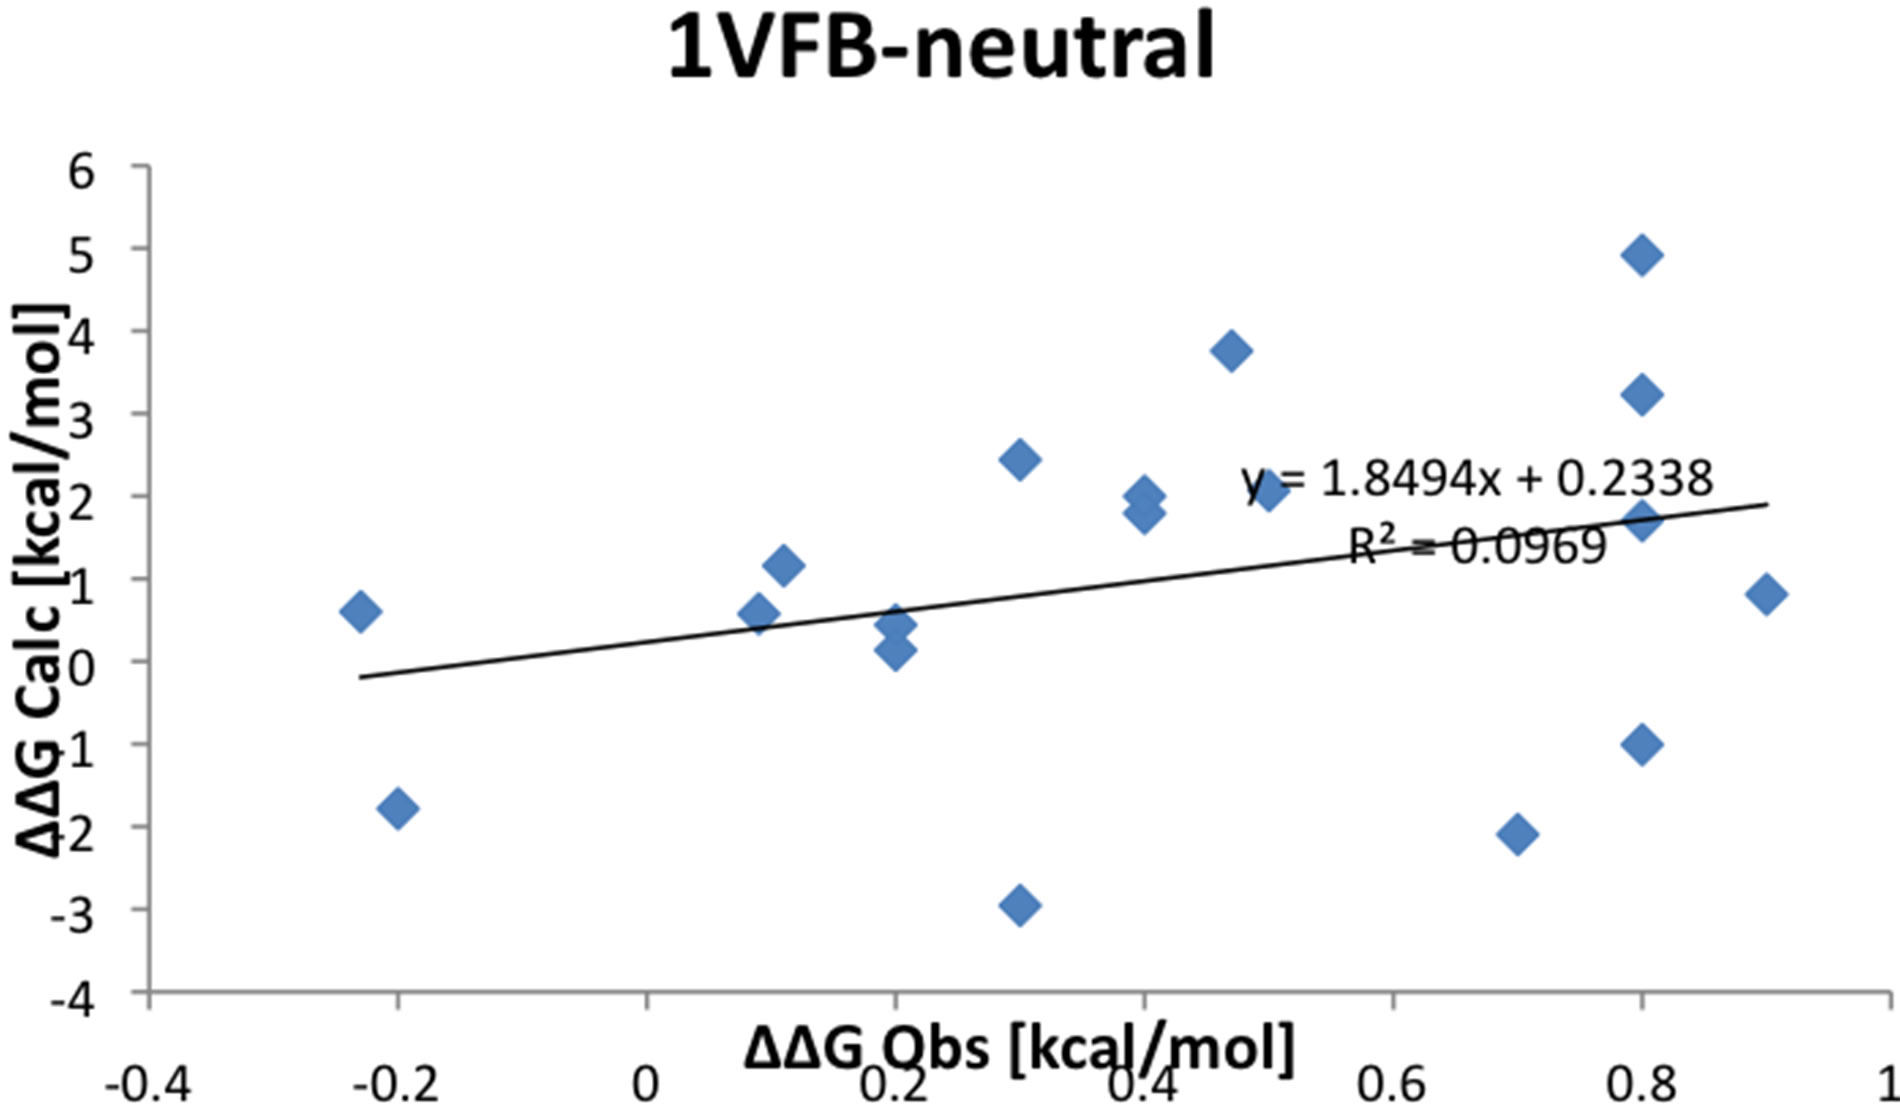
Although Charmm FF function with dielectric constant 4.0 predicted 90% of the interfacial hotspots correctly, the accuracy of the predictions for different protein interfaces range from 50% to 100% (see Table S1 of supporting material). The change in binding energy calculated using Charmm FF function with dielectric constant 4.0 for the proteins 1VFB, 1AHW are shown in Figure 4. We have chosen these proteins since they have a wide range of mutations showing both neutral residues and
 (a)
(a)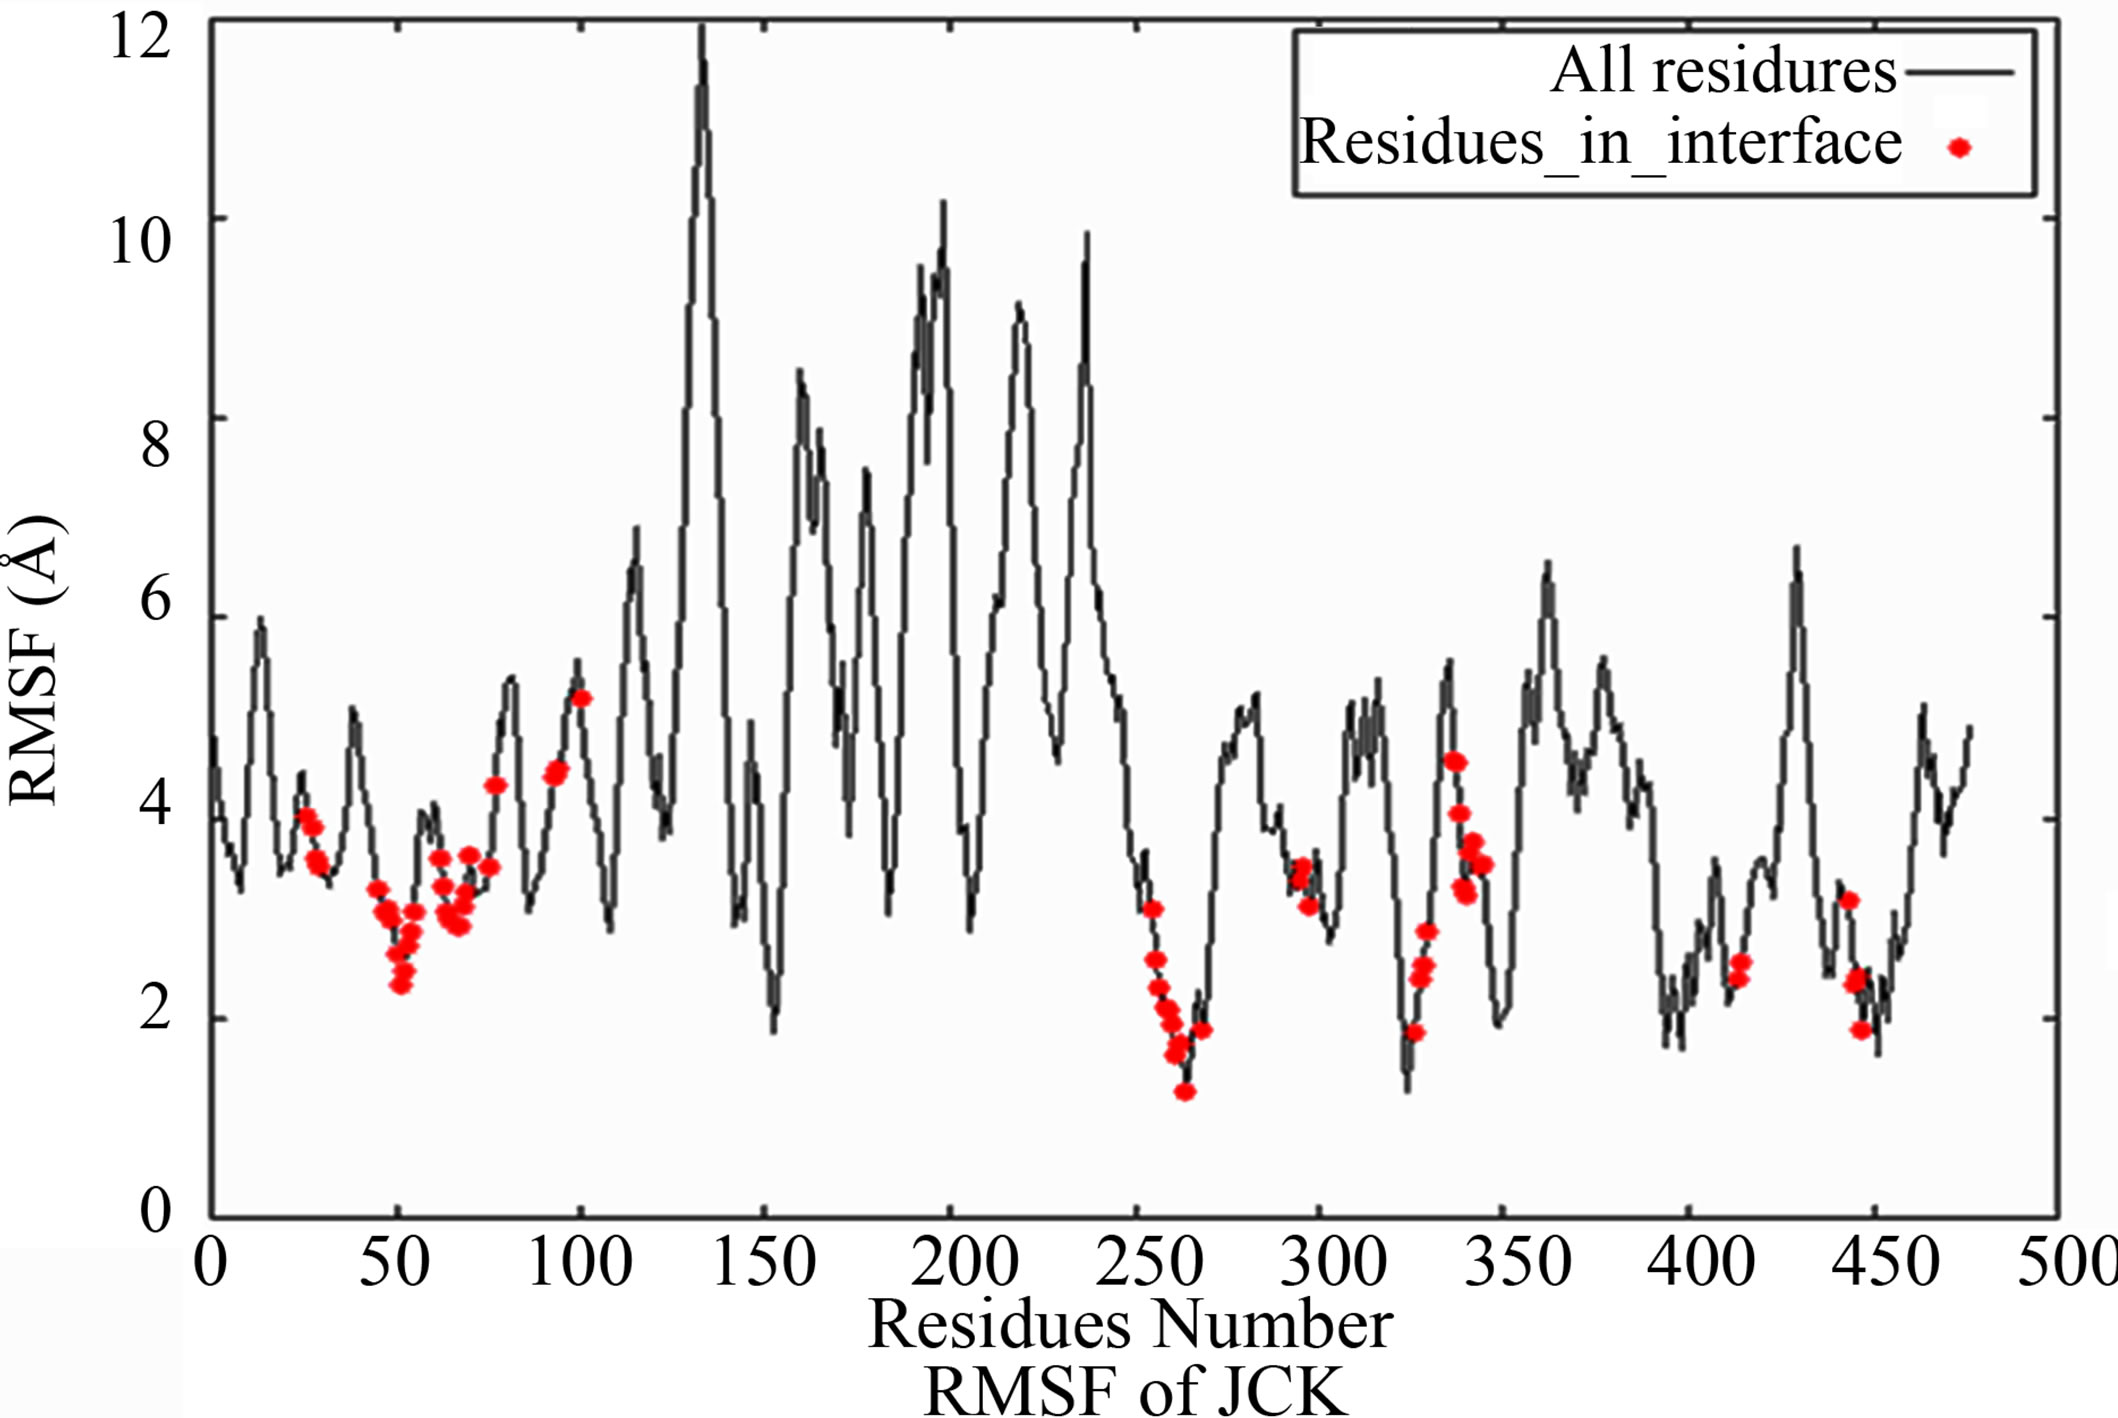 (b)
(b)
Figure 3. (a) Overlay of the donor-acceptor interfaces of 60 conformers of protein 1JCK. Pink represents the surface of the interface of one monomer, and pale cyan represents the surface of the other monomer. The interfacial residues are represented in trace representation and each color represents one conformer; (b) RMSF of Cα atoms for each residue averaged 60 conformers for protein 1JCK. Black solid line represents all residues, and red dots are residues in the interface.


Figure 4. Correlation between the experimentally measured free energies of binding of the monomers in protein-protein complex 1AHW, and the calculated free energies of binding.
hotspots. The correlation coefficient between the experimental free energies and calculated change in binding energy ranges from 0.7 to 0.8. For 1VFB, Figure S1 of supporting material shows the correlation for the neutral and hotspot residues separately. The correlation coefficient for the hotspots is 0.7 while for the neutral residues, the correlation is poor with a coefficient of 0.3.
3.6. Comparison of Performance of All-Atom Forcefield with Other Methods
Table 2 shows comparison of our results with Robetta that uses a knowledge based forcefield for alanine scanning [17]. The performance of Charmm force field with dielectric constant 4.0 and inclusion of hydrogen bonds is similar to that of Robetta method. We have calculated the sensitivity and accuracy of the prediction from the number of true positives (TP), true negatives (TN), false positives (FP) and false negatives (FN). The following terms are defined as sensitivity = TP/(TP + FN); precision precision = TP/(TP + FP); accuracy = (TP + TN)/(TP + FP + TN + FN) and Specificity = TN/(TN + FP). Other methods such as FOLDEF and KFC perform similar to Robetta [42,43].
4. Conclusions
In summary, we studied different factors that affect the prediction efficiency of computational alanine scanning methods, including type of force fields, solvation models, and conformational sampling. The AMBER force field (FF) performed better among the three widely used force fields for hot spot predictions (86% correct prediction), while showing a high rate of false positives since the percentage of neutral residues correctly predicted was low with AMBER FF. The Charmm FF however showed an evenly balanced prediction of both hot spots and neutral residues. Dielectric constant of 4.0 for electrostatic interaction calculation improves the hot spot prediction efficiency dramatically. Among all the energy terms, van der Waals energy seems to play a critical role followed by the hydrogen bond energy. Conformational sampling with Concoord also predicts the hot spots better than using a single conformation.
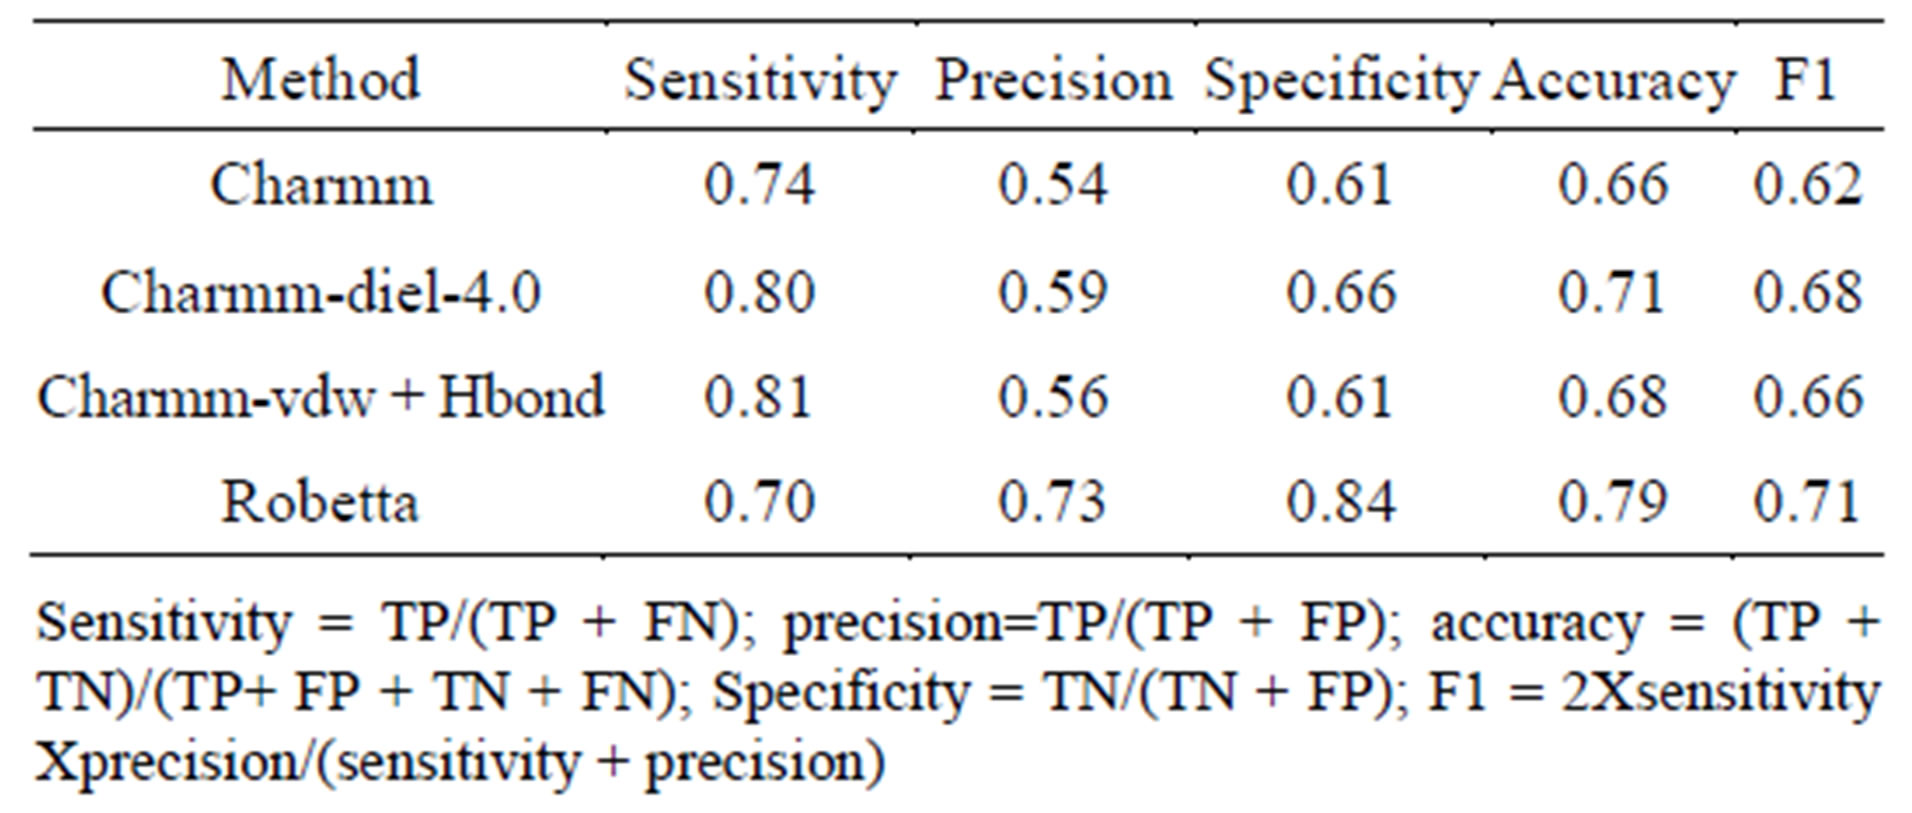
Table 2. Comparison of the current all-atom forcefields with ROBETTA method that uses knowledge based forcefields.
Using these techniques we identified an allosteric inhibitor for the formation of the protein-protein complexSTAT3 dimer that has been published elsewhere [44].
5. Acknowledgements
JL thanks Dr. Gouthaman Balaraman for sharing the script to calculate the hydrogen bond function. We thank the STAT3 drug design project team at Beckman Research Institute of the City of Hope for instigating this project with the goal of designing small molecules for disrupting the STAT3 dimer.
REFERENCES
- T. Clackson and J. A. Wells, “A Hotspot of Binding Energy in a Hormone Receptor Interface,” Science, Vol. 267, 1995, pp. 383-386. doi:10.1126/science.7529940
- A. A. Bogan and K. S. Thorn, “Anatomy of Hot Spots in Protein Interfaces, Review,” Journal of Molecular Biology, Vol. 280, 1998, pp. 1-9. doi:10.1006/jmbi.1998.1843
- O. Keskin, B. Ma, et al., “Hot Regions in Protein-Protein Interactions: The Organization and Contribution of Structurally Conserved Hot Spot Residues,” Journal of Molecular Biology, Vol. 345, No. 5, 2005, pp. 1281-1294. doi:10.1016/j.jmb.2004.10.077
- W. L. DeLano, “Unraveling Hot Spots in Binding Interfaces: Progress and Challenges,” Current Opinion in Structural Biology, Vol. 12, No. 1, 2002, pp. 14-20. doi:10.1016/S0959-440X(02)00283-X
- L. Lo Conte, C. Chothia, et al., “The Atomic Structure of Protein-Protein Recognition Sites,” Journal of Molecular Biology, Vol. 285, No. 5, 1999, pp. 2177-2198. doi:10.1006/jmbi.1998.2439
- S. N. Jones, A. T. Sands, et al., “The Tumorigenic Potential and Cell Growth Characteristics of p53-Deficient Cells Are Equivalent in the Presence or Absence of Mdm2,” Proceedings of the National Academy of Sciences USA, Vol. 3, No. 24, 1996, pp. 14106-14111. doi:10.1073/pnas.93.24.14106
- O. Y. Tikhomirov and J. W. Thomas, “Alanine Scanning Mutants of Rat Proinsulin I Show Functional Diversity of Anti-Insulin Monoclonal Antibodies,” Journal of Immunology, Vol. 165, No. 7, 2000, pp. 3876-3882.
- B. C. Cunningham and J. A. Wells, “Rational Design of Receptor-Specific Variants of Human Growth Hormone,” Proceedings of the National Academy of Sciences USA, Vol. 88, No. 8, 1991, pp. 3407-3411. doi:10.1073/pnas.88.8.3407
- Z. Hu, B. Ma, et al., “Conservation of Polar Residues as Hot Spots at Protein Interfaces,” Proteins, Vol. 39, No. 4, 2000, pp. 331-342. doi:10.1002/(SICI)1097-0134(20000601)39:4<331::AID-PROT60>3.0.CO;2-A
- B. Ma, T. Elkayam, et al., “Protein-Protein Interactions: Structurally Conserved Residues Distinguish between Binding Sites and Exposed Protein Surfaces,” Proceedings of the National Academy of Sciences USA, Vol. 100, No. 10, 2003, pp. 5772-5777. doi:10.1073/pnas.1030237100
- K. S. Thorn and A. A. Bogan, “ASEdb: A Database of Alanine Mutations and Their Effects on the Free Energy of Binding in Protein Interactions,” Bioinformatics, Vol. 17, No. 3, 2001, pp. 284-285. doi:10.1093/bioinformatics/17.3.284
- B. Jayaram, K. McConnell, et al., “Free-Energy Component Analysis of 40 Protein-DNA Complexes: A Consensus View on the Thermodynamics of Binding at the Molecular Level,” Journal of Computational Chemistry, Vol. 23, No. 1, 2002, pp. 1-14. doi:10.1002/jcc.10009
- Y. Gao, R. Wang, et al., “Structure-Based Method for Analyzing Protein-Protein Interfaces,” Journal of Molecular Modeling, Vol. 10, No. 1, 2004, pp. 44-54. doi:10.1007/s00894-003-0168-3
- G. M. Verkhivker, D. Bouzida, et al., “Computational Detection of the Binding-Site Hot Spot at the Remodeled Human Growth Hormone-Receptor Interface,” Proteins-Structure Function and Genetics, Vol. 53, No. 2, 2003, pp. 201-219. doi:10.1002/prot.10456
- I. S. Moreira, P. A. Fernandes, et al., “Hot Spots—A Review of the Protein-Protein Interface Determinant Amino-Acid Residues,” Proteins, Vol. 68, No. 4, 2007, pp. 803-812. doi:10.1002/prot.21396
- I. S. Moreira, P. A. Fernandes, et al., “Computational Alanine Scanning Mutagenesis—An Improved Methodological Approach,” Journal of Computational Chemistry, Vol. 28, No. 3, 2007, pp. 644-654. doi:10.1002/jcc.20566
- T. Kortemme and D. Baker, “A Simple Physical Model for Binding Energy Hot Spots in Protein-Protein Complexes,” Proceedings of the National Academy of Sciences USA, Vol. 99, No. 22, 2002, pp. 14116-14121. doi:10.1073/pnas.202485799
- T. Kortemme, D. E. Kim, et al., “Computational Alanine Scanning of Protein-Protein Interfaces,” Science’s STKE, Vol. 2004, No. 219, 2004, p. l2. doi:10.1126/stke.2192004pl2
- J. Aqvist, C. Medina, et al., “A New Method for Predicting Binding Affinity in Computer-Aided Drug Design,” Protein Engineering, Vol. 7, No. 3, 1994, pp. 385-391. doi:10.1093/protein/7.3.385
- G. M. Verkhivker, D. Bouzida, et al., “Monte Carlo Simulations of the Peptide Recognition at the Consensus Binding Site of the Constant Fragment of Human Immunoglobulin G: The Energy Landscape Analysis of a Hot Spot at the Intermolecular Interface,” Proteins, Vol. 48, No. 3, 2002, pp. 539-557. doi:10.1002/prot.10164
- R. Guerois, J. E. Nielsen, et al., “Predicting Changes in the Stability of Proteins and Protein Complexes: A Study of More than 1000 Mutations,” Journal of Molecular Biology, Vol. 320, No. 2, 2002, pp. 369-387. doi:10.1016/S0022-2836(02)00442-4
- E. L. Humphris and T. Kortemme, “Prediction of Protein-Protein Interface Sequence Diversity Using Flexible Backbone Computational Protein Design,” Structure, Vol. 16, No. 12, 2008, pp. 1777-1788. doi:10.1016/j.str.2008.09.012
- P. A. Kollman, et al., “Calculating Structures and Free Energies of Complex Molecules: Combining Molecular Mechanics and Continuum Models,” Accounts of Chemical Research, Vol. 2000, No. 33, 2000, p. 889. doi:10.1021/ar000033j
- I. Massova and P. A. Kollman, “Computational Alanine Scanning to Probe Protein-Protein Interactions: A Novel Approach to Evaluate Binding Free Energies,” Journal of the American Chemical Society, Vol. 121, No. 36, 1999, pp. 8133-8143. doi:10.1021/ja990935j
- S. Huo, I. Massova, et al., “Computational Alanine Scanning of the 1:1 Human Growth Hormone-Receptor Complex,” Journal of Computational Chemistry, Vol. 23, No. 1, 2002, pp. 15-27. doi:10.1002/jcc.1153
- I. S. Moreira, P. A. Fernandes, et al., “Unraveling the Importance of Protein-Protein Interaction: Application of a Computational Alanine-Scanning Mutagenesis to the Study of the IgG1 Streptococcal Protein G (C2 Fragment) Complex,” Journal of Physical Chemistry B, Vol. 110, No. 22, 2006, pp. 10962-10969. doi:10.1021/jp054760d
- A. D. Mackerell Jr., et al., “All-Artom Empirical Potential for Molecular Modeling and Dynamics Studies of Proteins,” Journal of Physical Chemistry B, Vol. 102, 1998, pp. 3586-3616. doi:10.1021/jp973084f
- D. A. Case, T. A. Darden, T. E. Cheatham III, C. L. Simmerling, J. Wang, R. E. Duke, R. Luo, K. M. Merz, B. Wang, D. A. Pearlman, M. Crowley, S. Brozell, V. Tsui, H. Gohlke, J. Mongan, V. Hrnak, G. Cui, P. Beroza, C. Schafmeister, J. W. Caldwell, W. S. Ross and P. A. Kollman, “AMBER 9,” University of California, San Francisco, 2004.
- W. L. Jorgensen, D. S. Maxwell, et al., “Development and Testing of the OPLS All-Atom Force Field on Conformational Energetics and Properties of Organic Liquids,” Journal of the American Chemical Society, Vol. 118, No. 45, 1996, pp. 11225-11236. doi:10.1021/ja9621760
- B. Honig and A. Nicholls, “Classical Electrostatics in Biology and Chemistry,” Science, Vol. 268, No. 5214, 1995, pp. 1144-1149. doi:10.1126/science.7761829
- N. A. Baker, D. Sept, et al., “Electrostatics of Nanosystems: Application to Microtubules and the Ribosome,” Proceedings of the National Academy of Sciences USA, Vol. 98, No. 18, 2001, pp. 10037-10041. doi:10.1073/pnas.181342398
- B. L. de Groot, D. M. van Aalten, et al., “Prediction of Protein Conformational Freedom from Distance Constraints,” Proteins, Vol. 29, No. 2, 1997, pp. 240-251. doi:10.1002/(SICI)1097-0134(199710)29:2<240::AID-PROT11>3.0.CO;2-O
- O. Keskin, B. Y. Ma and R. Nussinov, “Hot Regions in Protein—Protein Interactions: The Organization and Contribution of Structurally Conserved Hot Spot Residues,” Journal of Molecular Biology, Vol. 345, 2005, pp. 1281-1294. doi:10.1016/j.jmb.2004.10.077
- W. Humphrey, A. Dalke, et al., “VMD: Visual Molecular Dynamics,” Journal of Molecular Graphics, Vol. 14, No. 1, 1996, pp. 27-38. doi:10.1016/0263-7855(96)00018-5
- J. C. Phillips, R. Braun, et al., “Scalable Molecular Dynamics with NAMD,” Journal of Computational Chemistry, Vol. 26, No. 16, 2005, pp. 1781-1802. doi:10.1002/jcc.20289
- Maestro, “Schrödinger,” Version 7.5, LLC, New York, 2005.
- F. Fabiola, R. Bertram, et al., “An Improved Hydrogen Bond Potential: Impact on Medium Resolution Protein Structures,” Protein Science, Vol. 11, No. 6, 2002, pp. 1415-1423. doi:10.1110/ps.4890102
- A. T. Brunger, “Free R Value: A Novel Statistical Quantity for Assessing the Accuracy of Crystal Structures,” Nature, Vol. 355, No. 6359, 1992, pp. 472-475. doi:10.1038/355472a0
- I. S. Moreira, P. A. Fernandes, et al., “Hot Spot Occlusion from Bulk Water: A Comprehensive Study of the Complex between the Lysozyme HEL and the Antibody FVD1.3,” Journal of Physical Chemistry B, Vol. 111, No. 10, 2007, pp. 2697-2706. doi:10.1021/jp067096p
- I. D. Kuntz, K. Chen, et al., “The Maximal Affinity of Ligands,” Proceedings of the National Academy of Sciences USA, Vol. 96, No. 18, 1999, pp. 9997-10002. doi:10.1073/pnas.96.18.9997
- A. Benedix, C. M. Becker, et al., “Predicting Free Energy Changes Using Structural Ensembles,” Nature Methods, Vol. 6, No. 1, 2009, pp. 3-4. doi:10.1038/nmeth0109-3
- N. Tuncbag, A. Gursoy, et al., “Identification of Computational Hot Spots in Protein Interfaces: Combining Solvent Accessibility and Inter-Residue Potentials Improves the Accuracy,” Bioinformatics, Vol. 25, No. 12, 2009, pp. 1513-1520. doi:10.1093/bioinformatics/btp240
- K. I. Cho, D. Kim, et al., “A Feature-Based Approach to Modeling Proteinprotein Interaction Hot Spots,” Nucleic Acids Research, Vol. 37, No. 8, 2009, pp. 2672-2687. doi:10.1093/nar/gkp132
- R. Buettner, R. Corzano, et al., “Alkylation of Cysteine 468 in Stat3 Defines a Novel Site for Therapeutic Development,” ACS Chemical Biology, Vol. 6, No. 5, 2011, pp. 432-443. doi:10.1021/cb100253e
Appendix
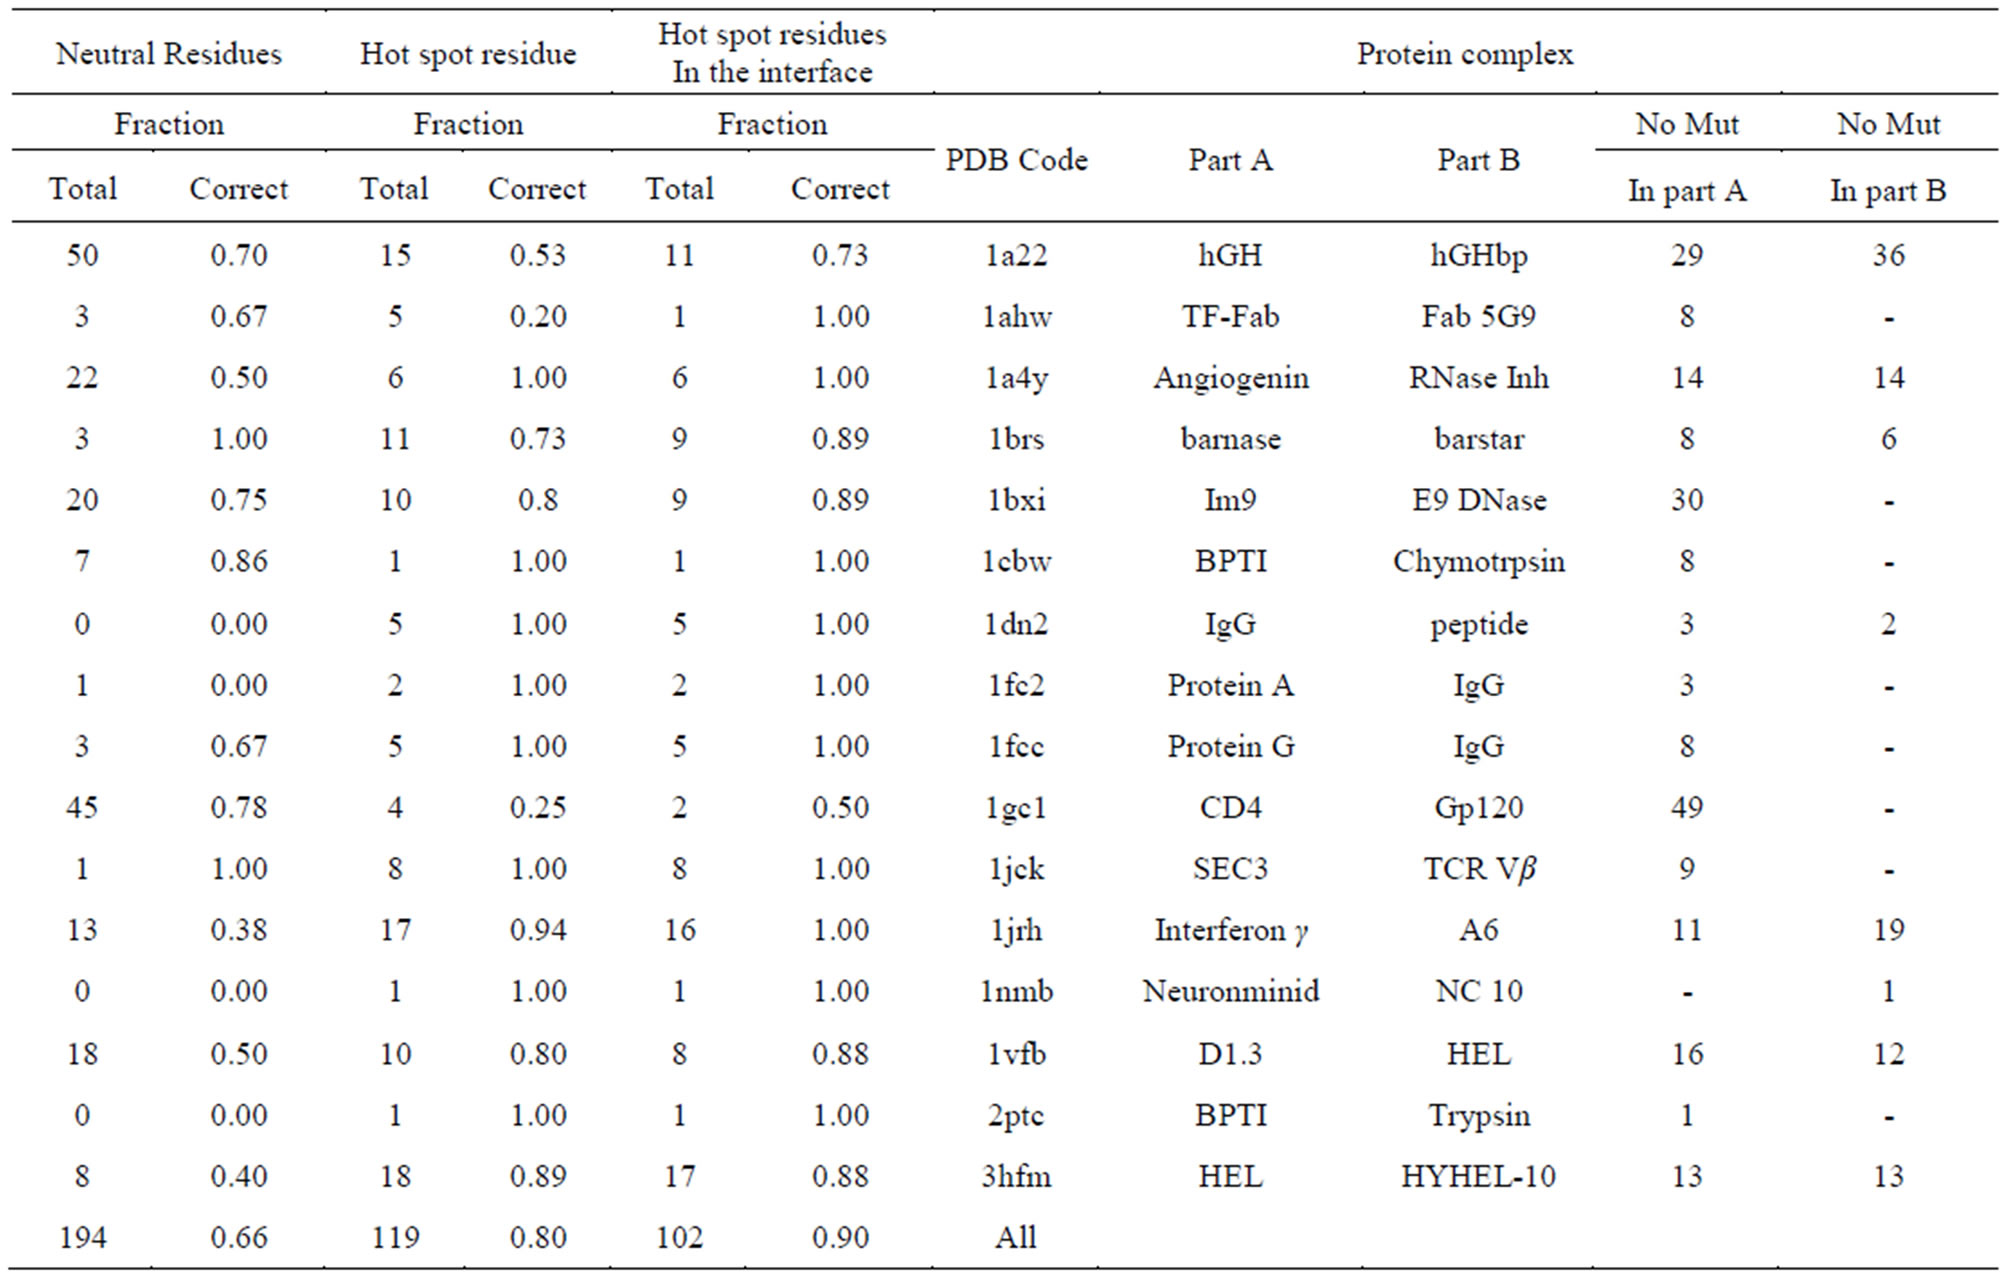
Table S1.Predicted hot spot and neutral residues for 16 proteins studied experimentally by alanine scanning , For calculation, Charmm force field is used and dielectric constant is 4 (Charmm-diel-4.0).
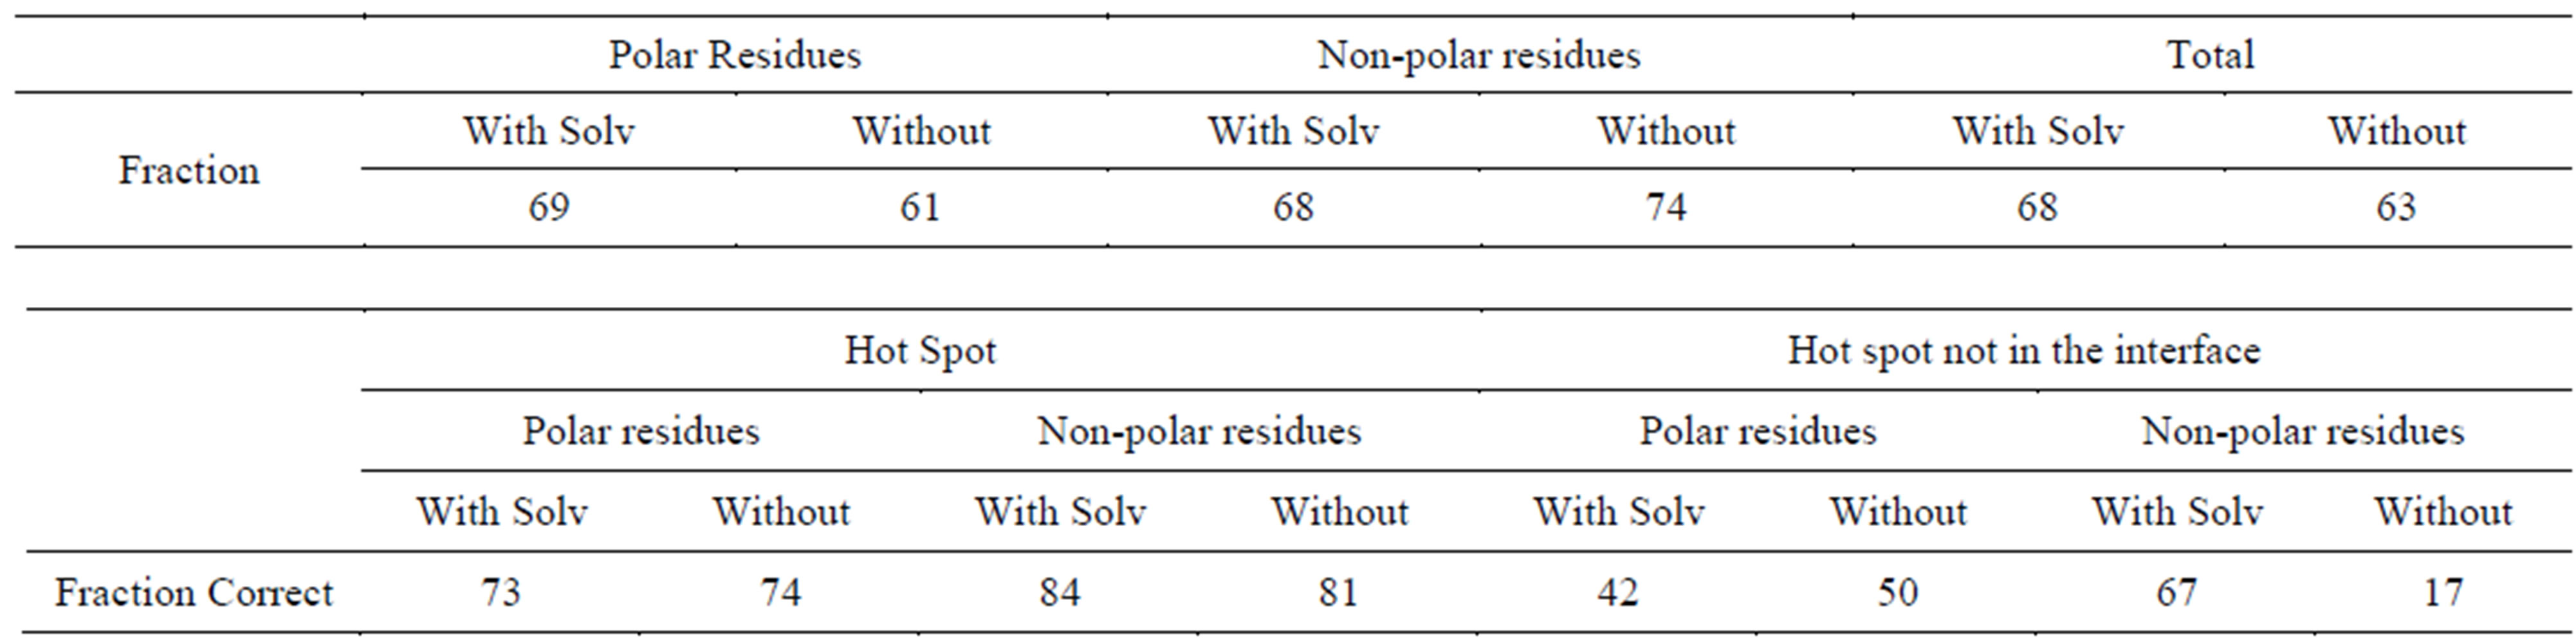
Table S2.Solvent effect on prediction of polar and non-polar residues (Charmm + Delphi).
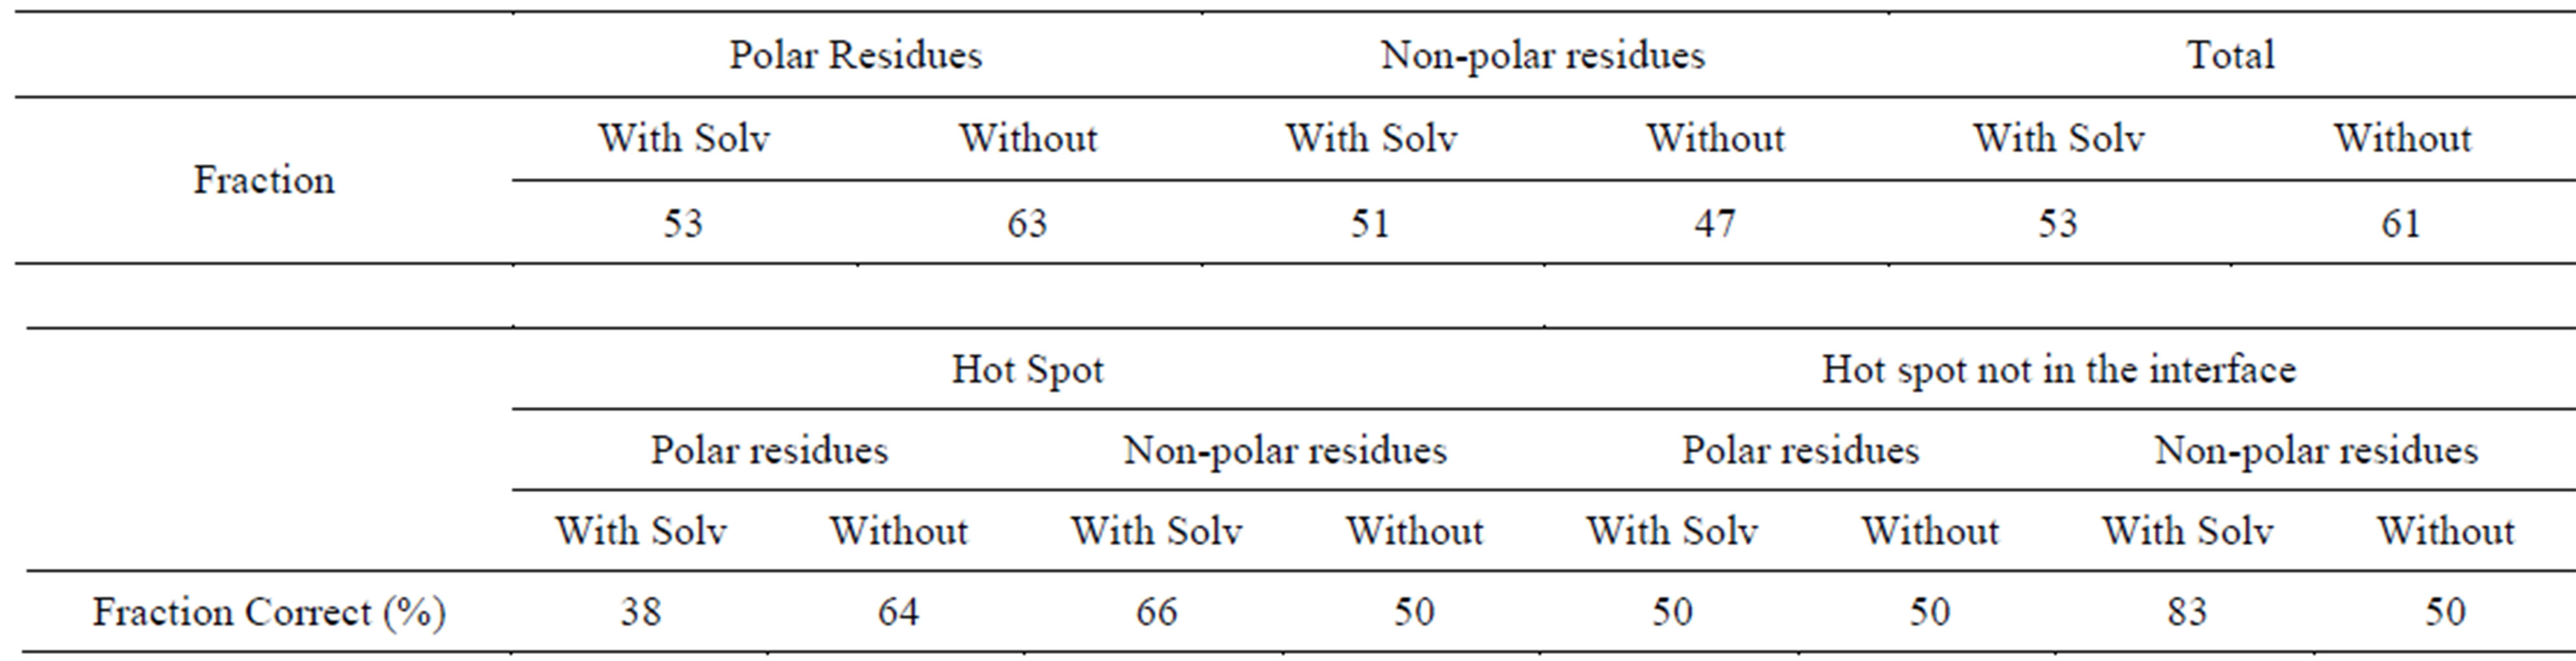
Table S3.Solvent effect on prediction of polar and non-polar residues (OPLS + Delphi).
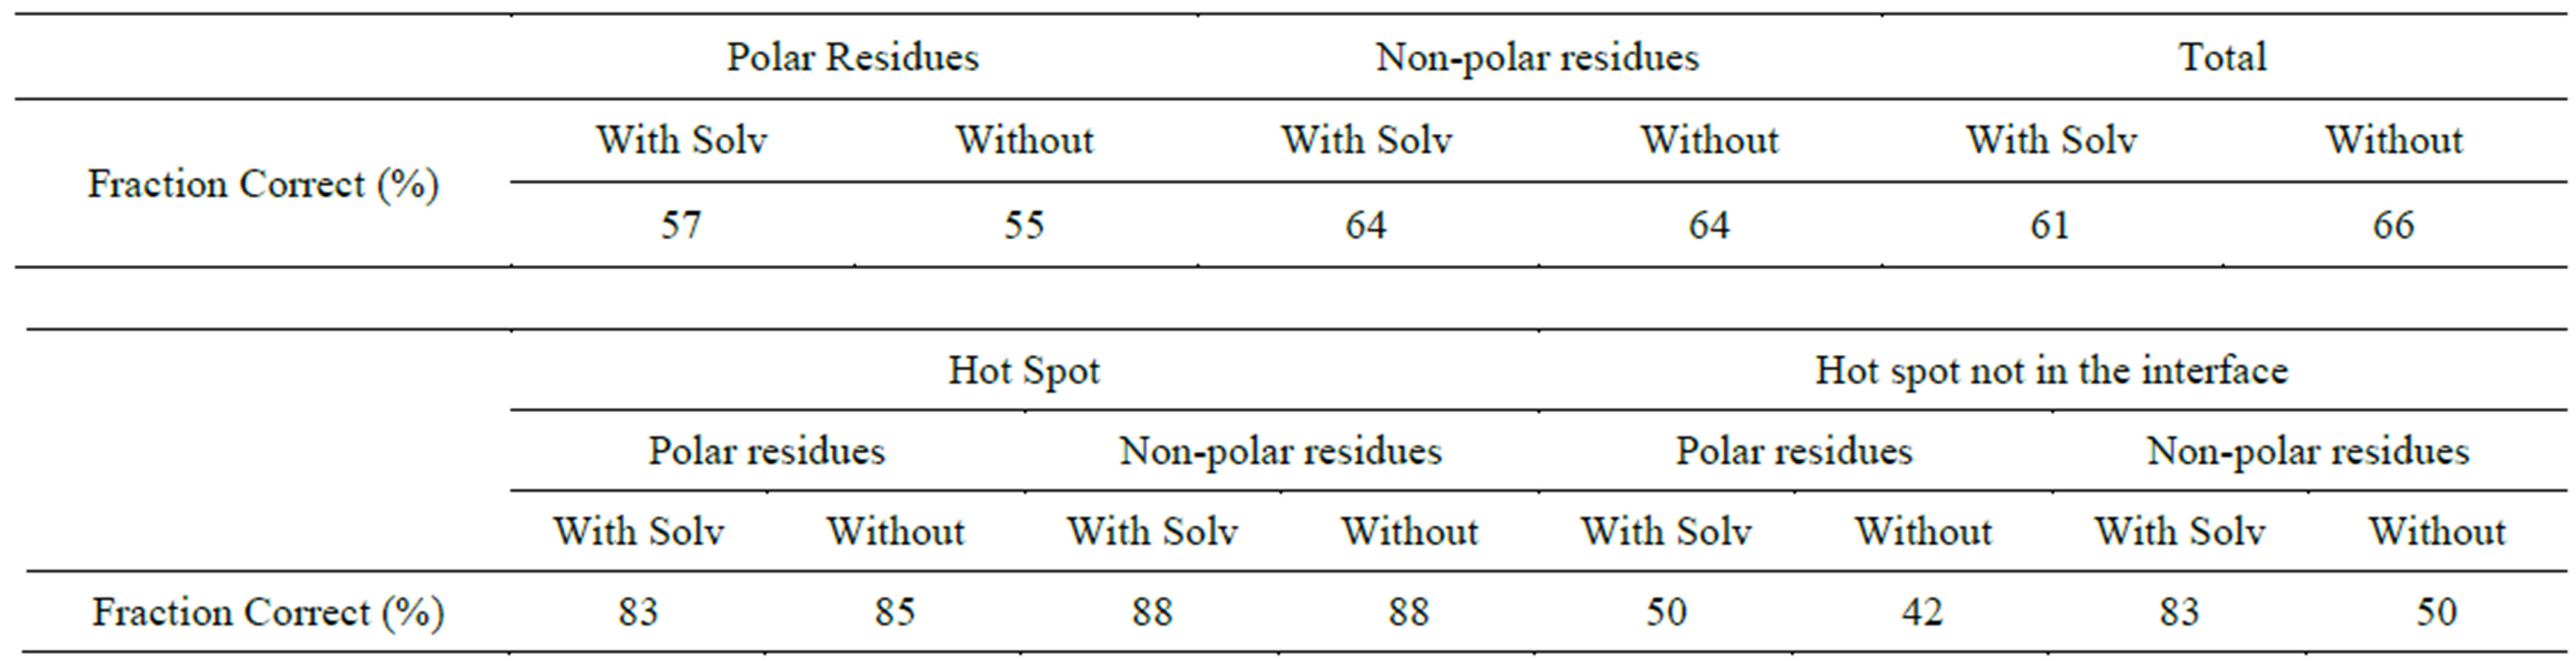
Table S4.Solvent effect on prediction of polar and Non-polar residues (Amber + Delphi).
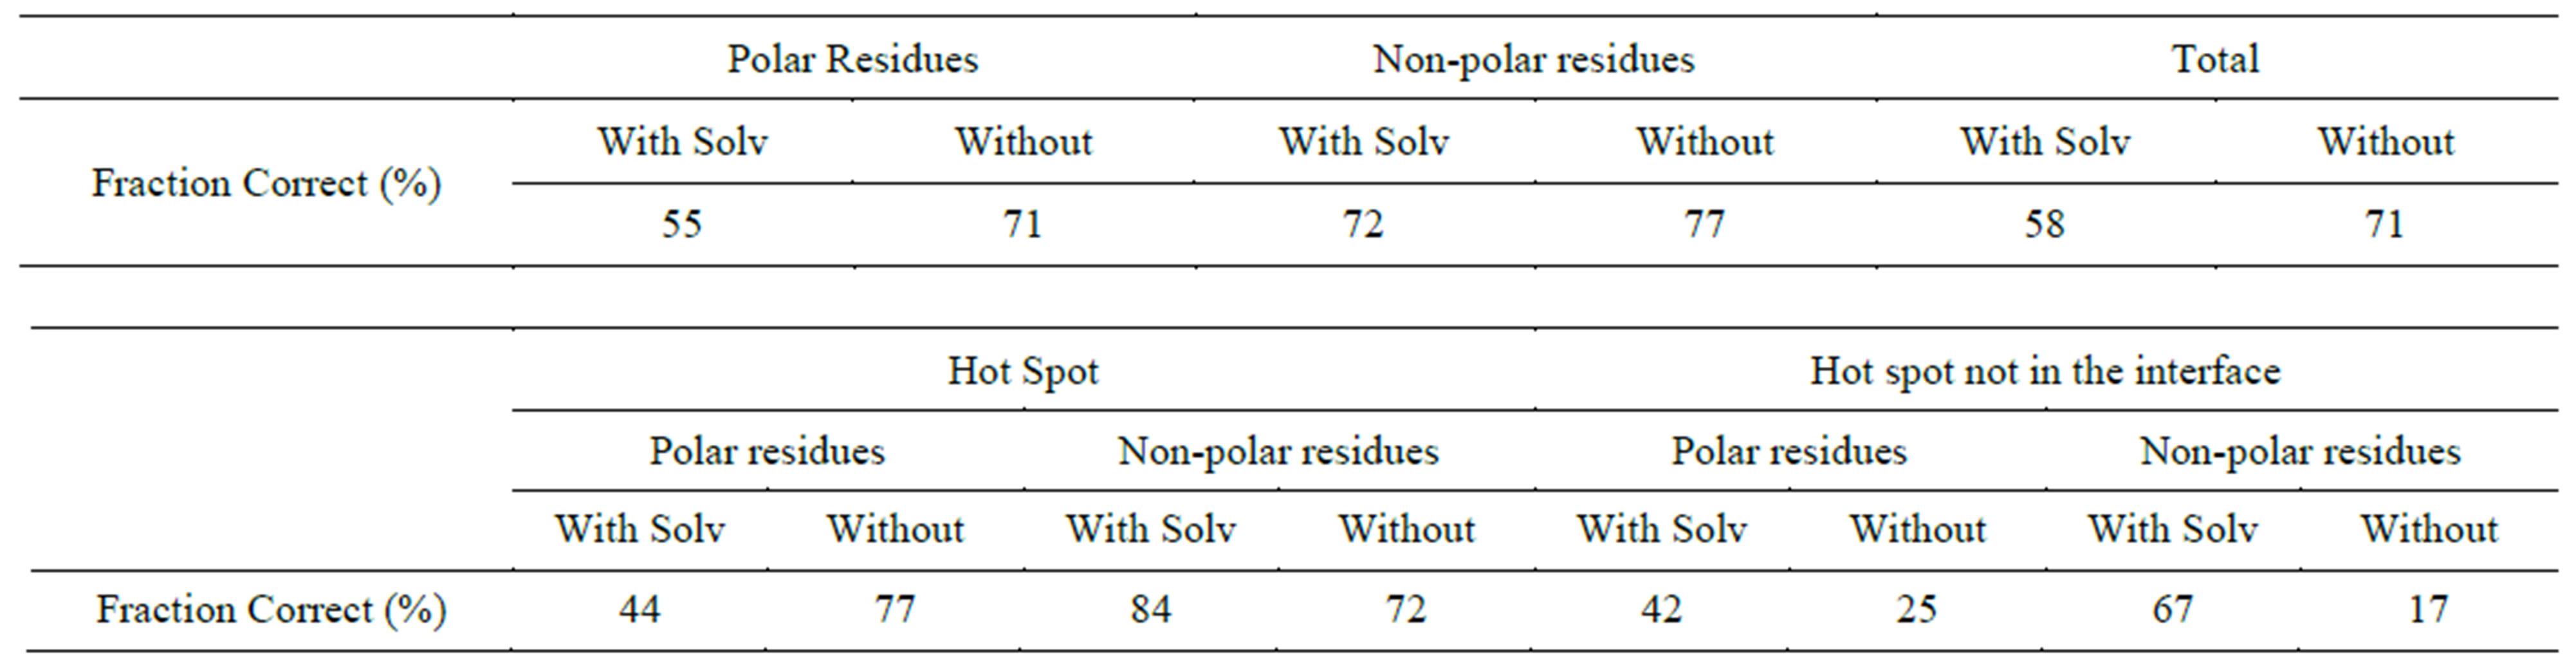
Table S5.Solvent effect on prediction of polar and Non-polar residues (Charmm-vdw + Delphi).
 (a)
(a)  (b)
(b)
Figure S1.Correlation between experimental observable and calculated values for proteins 1VFB. (a) Hot spot; (b) Neutral residues.
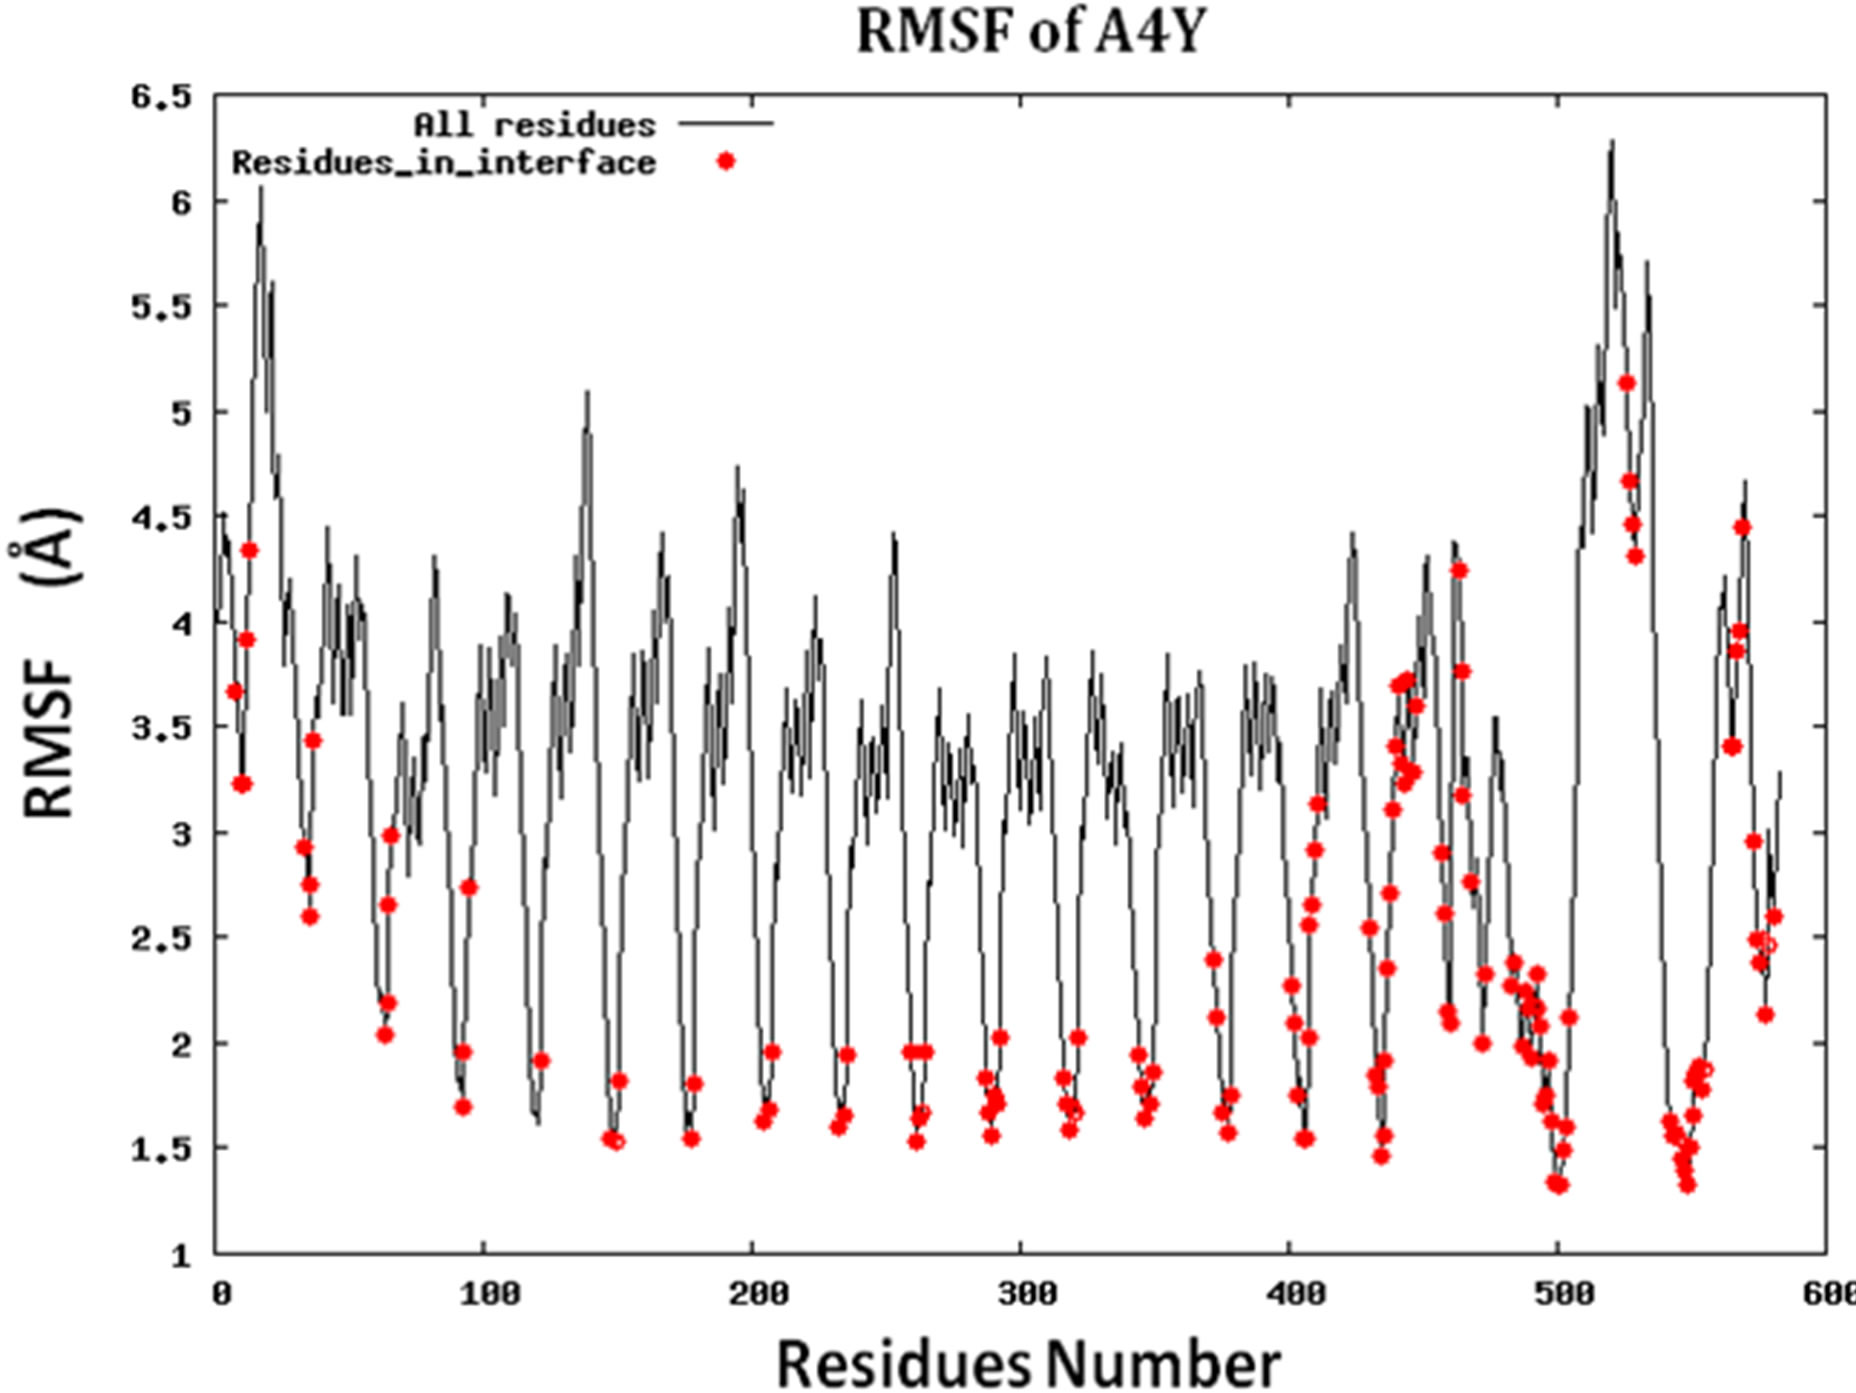
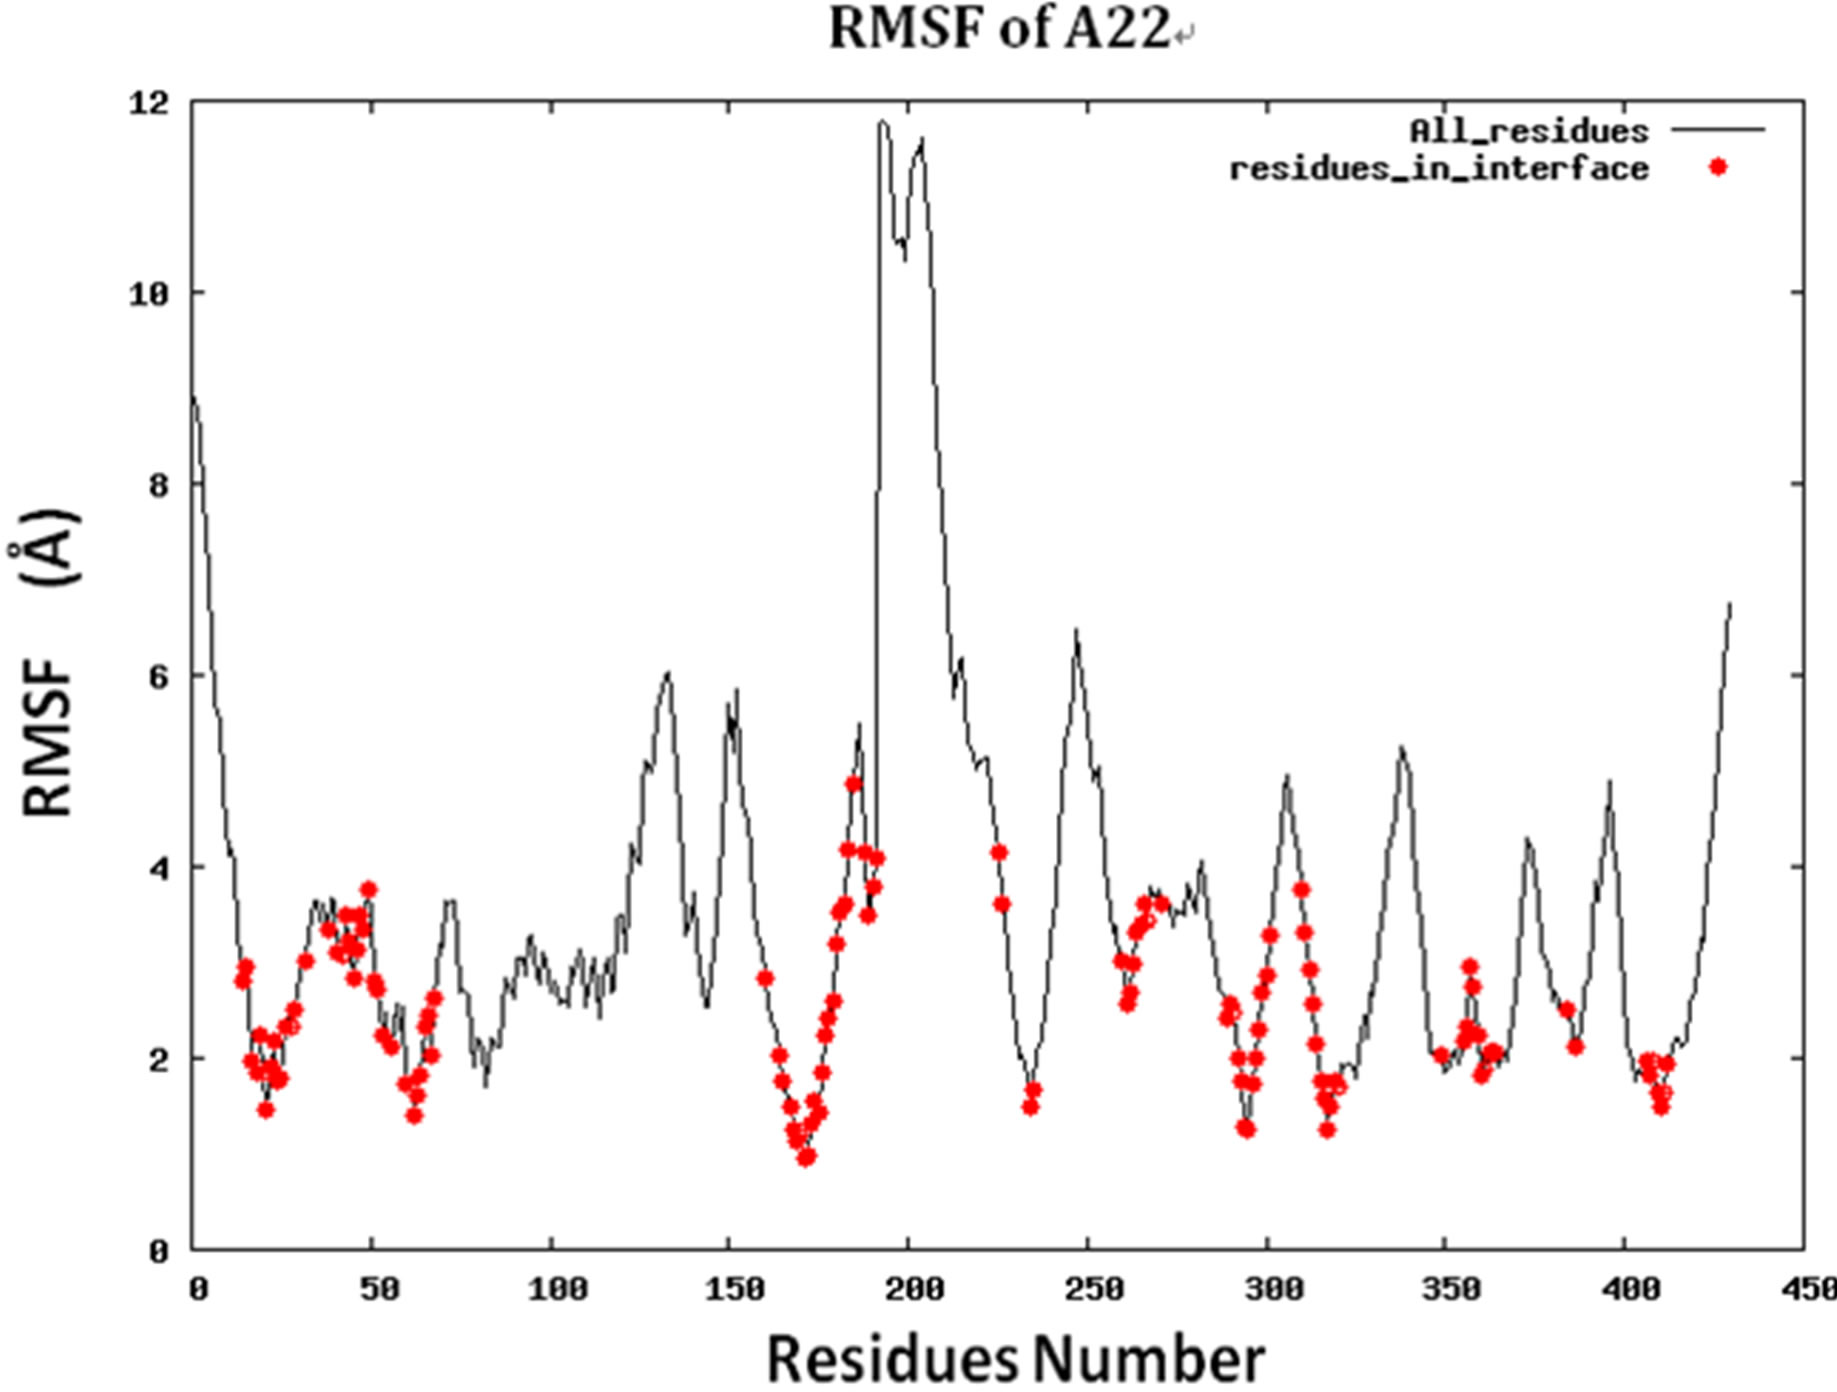
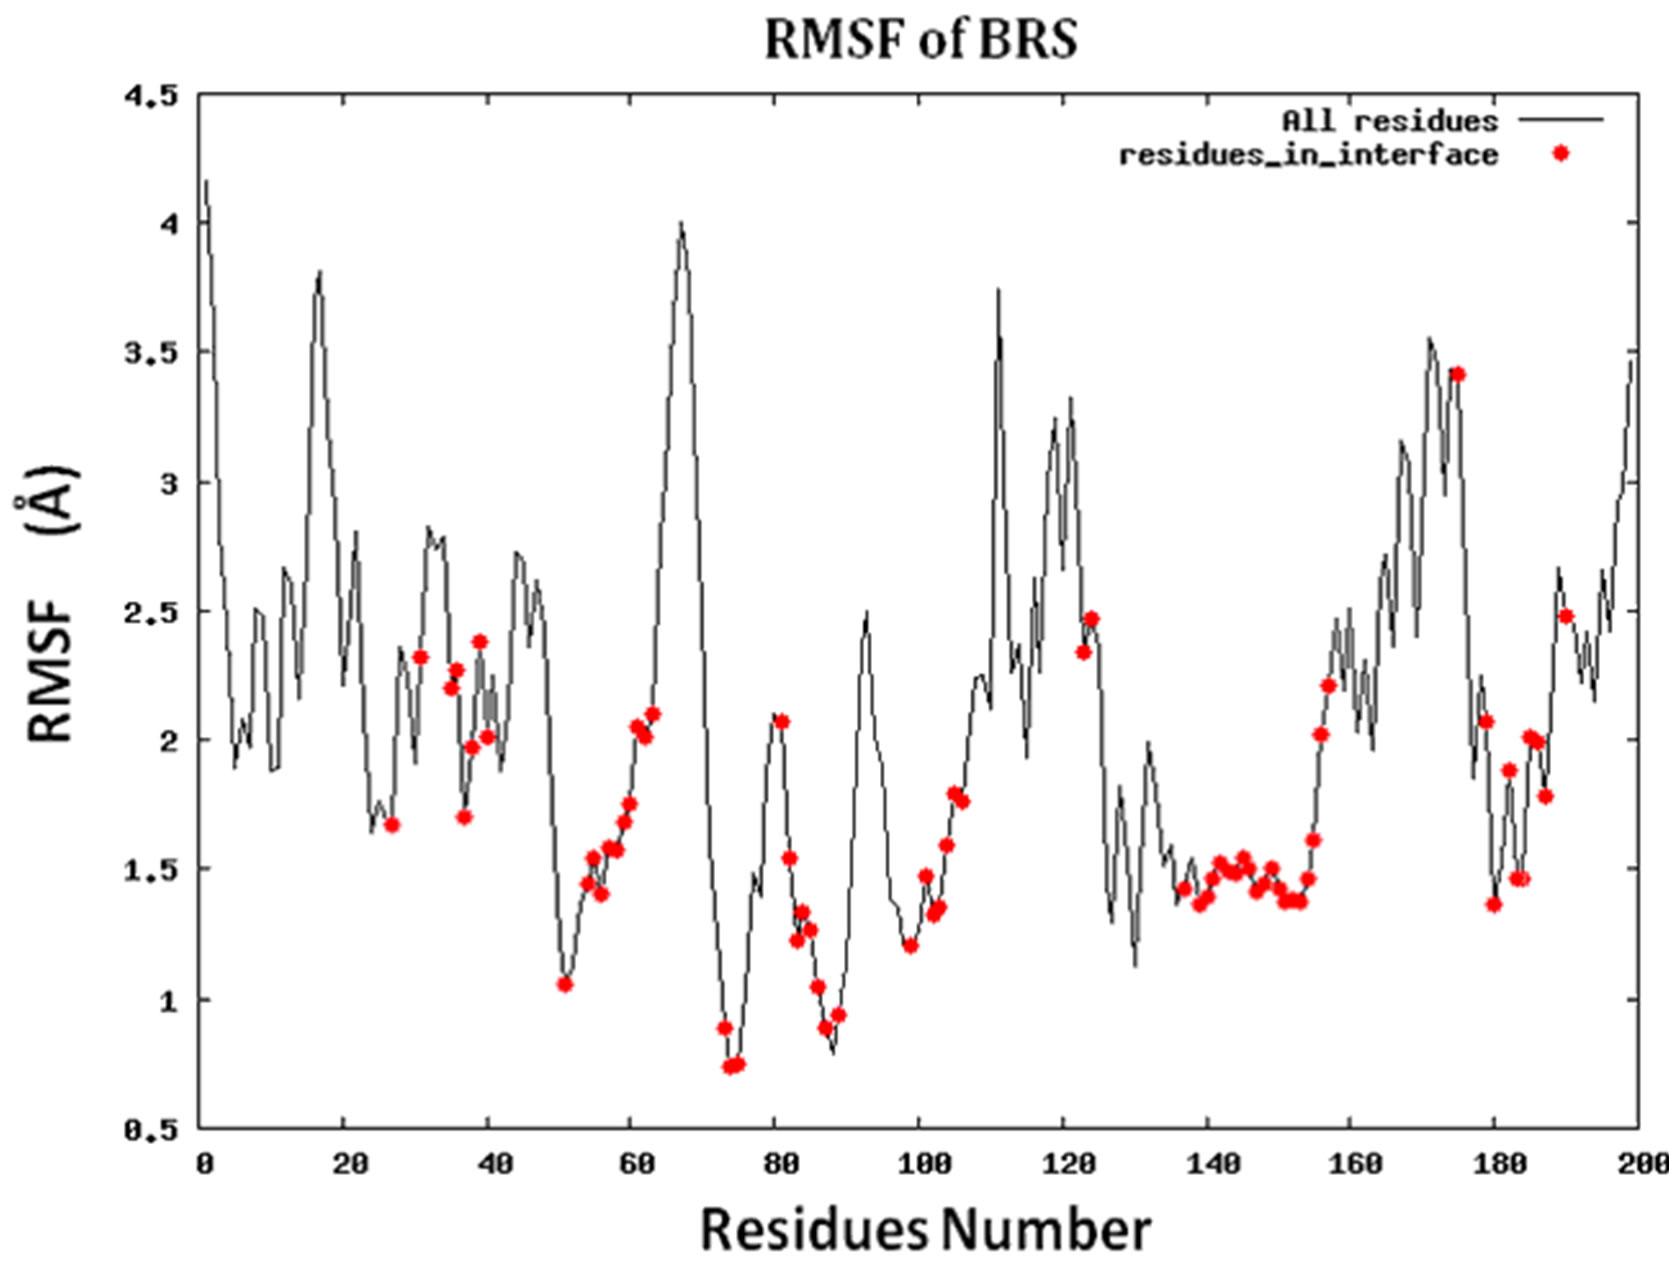
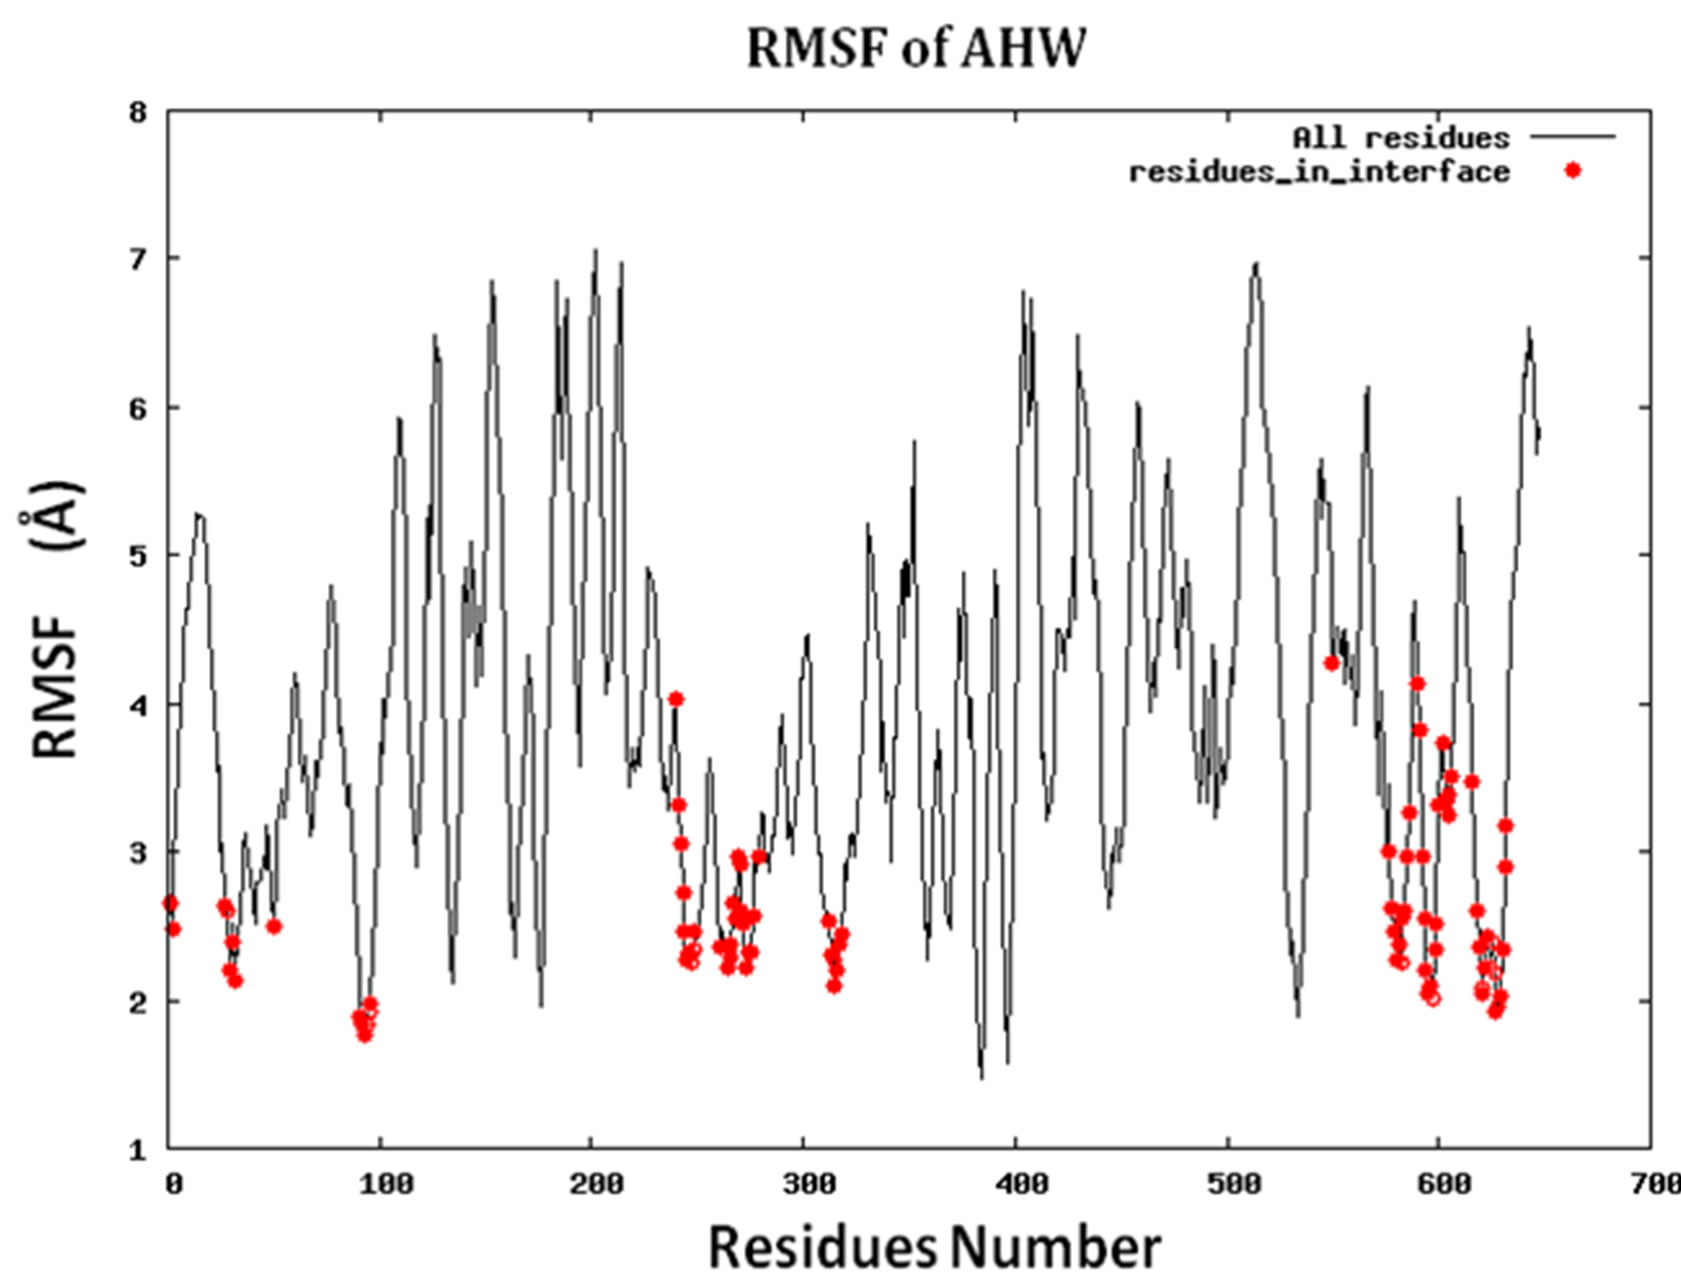
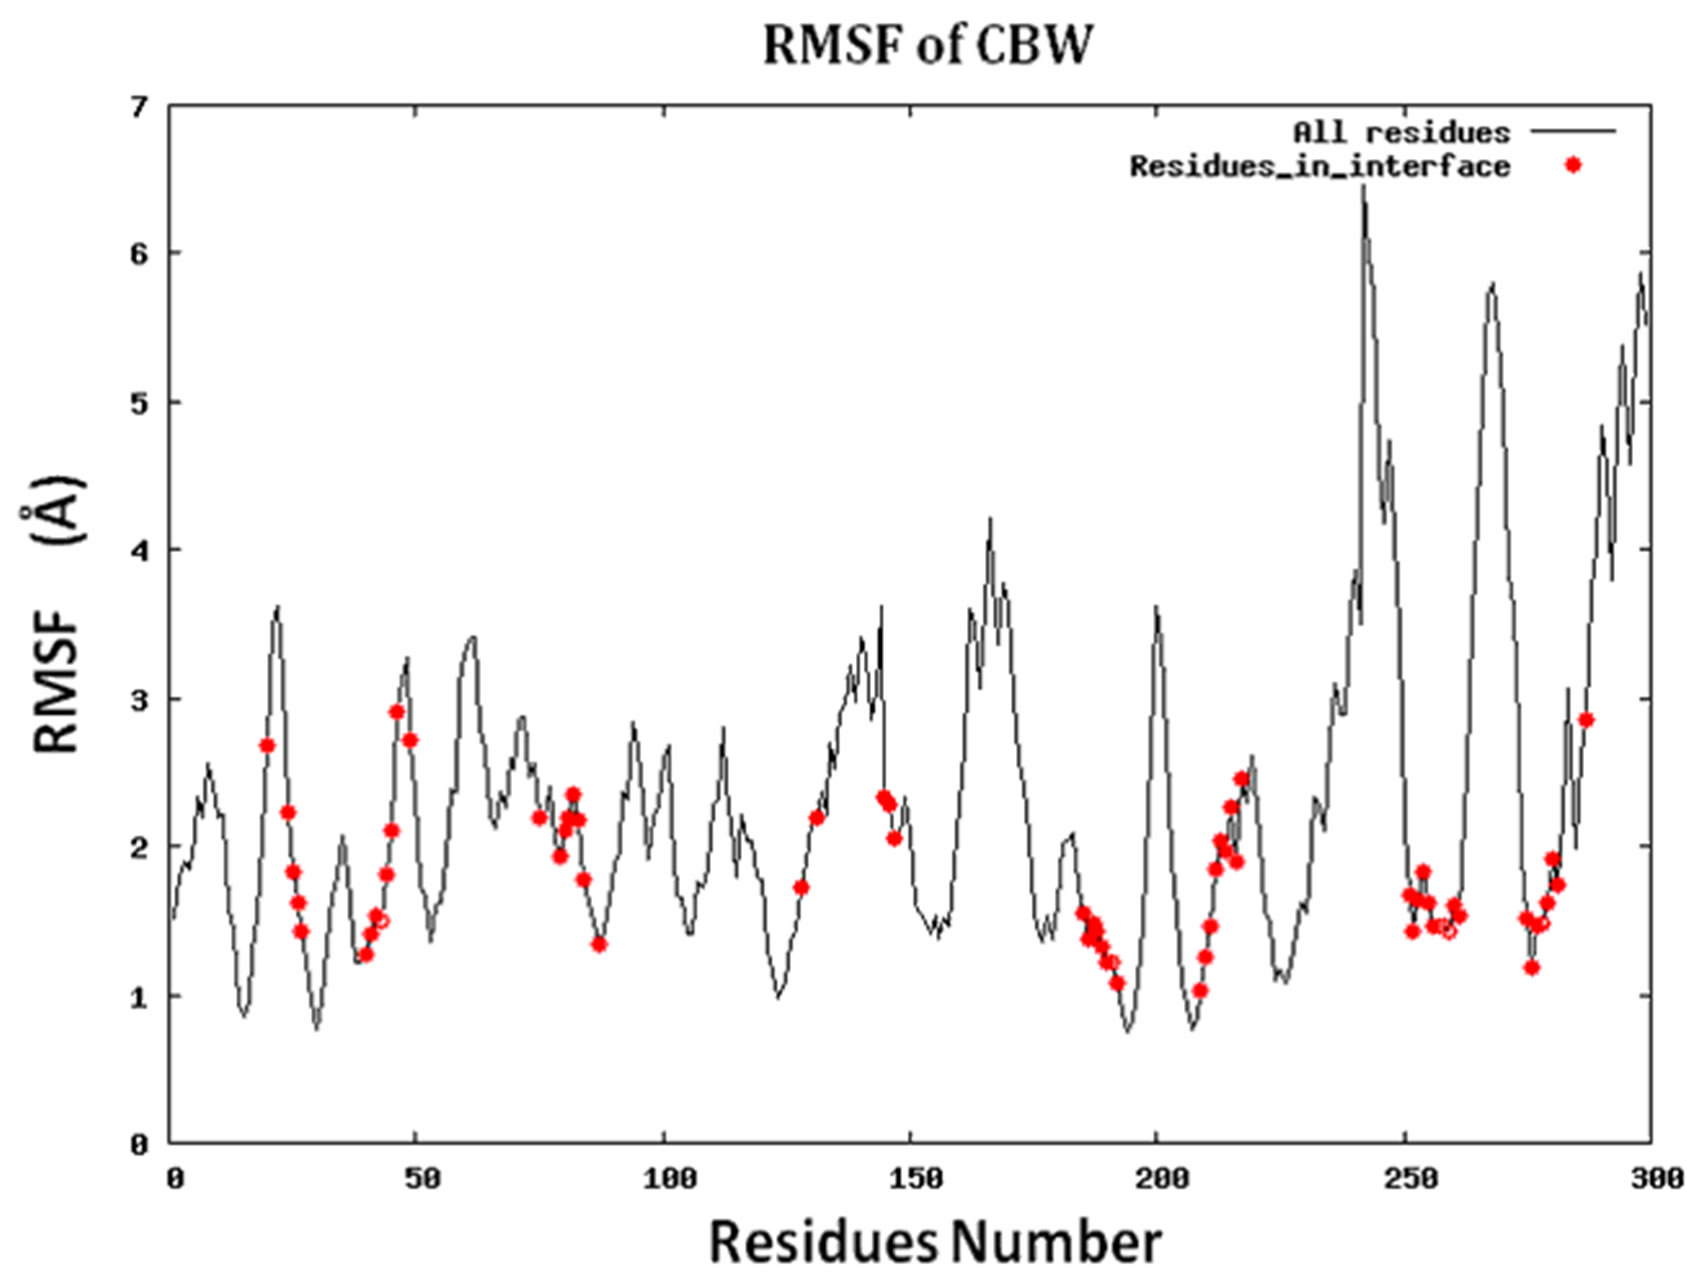
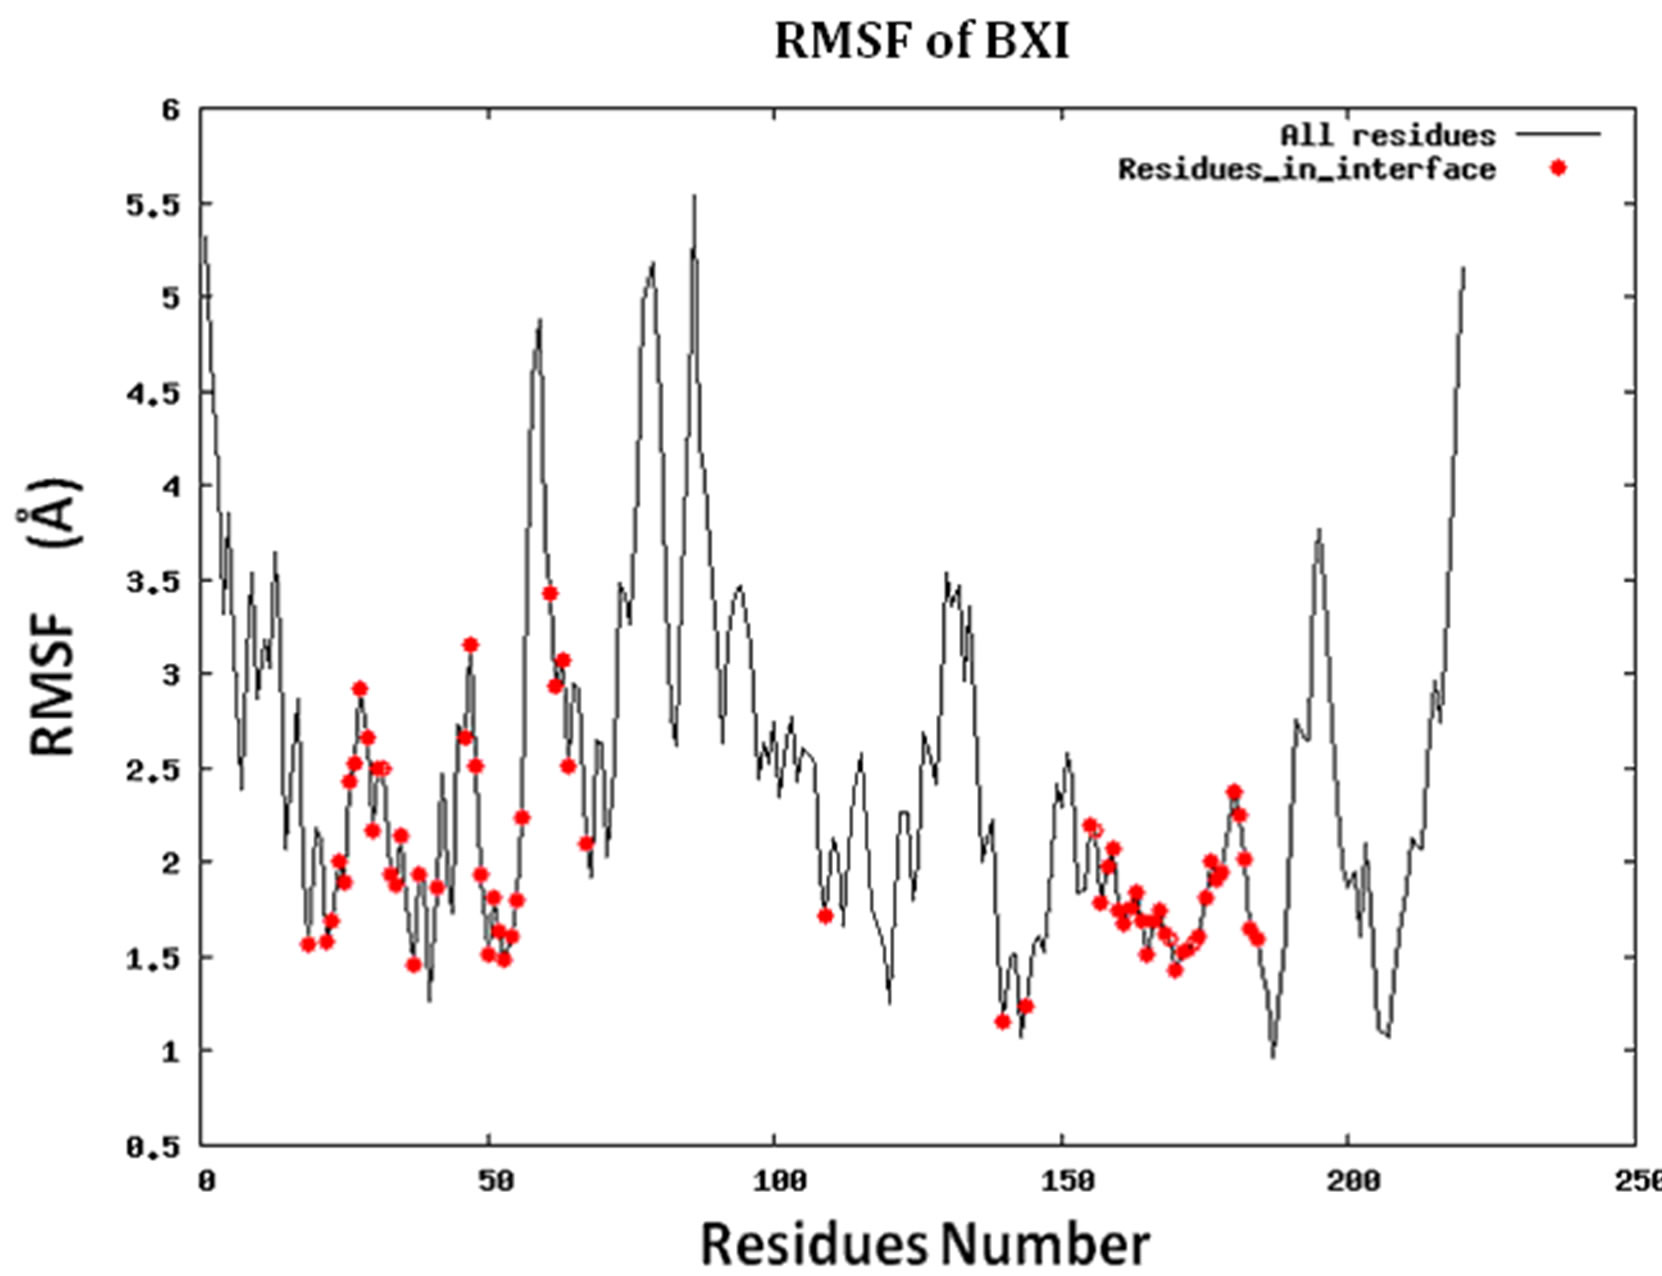
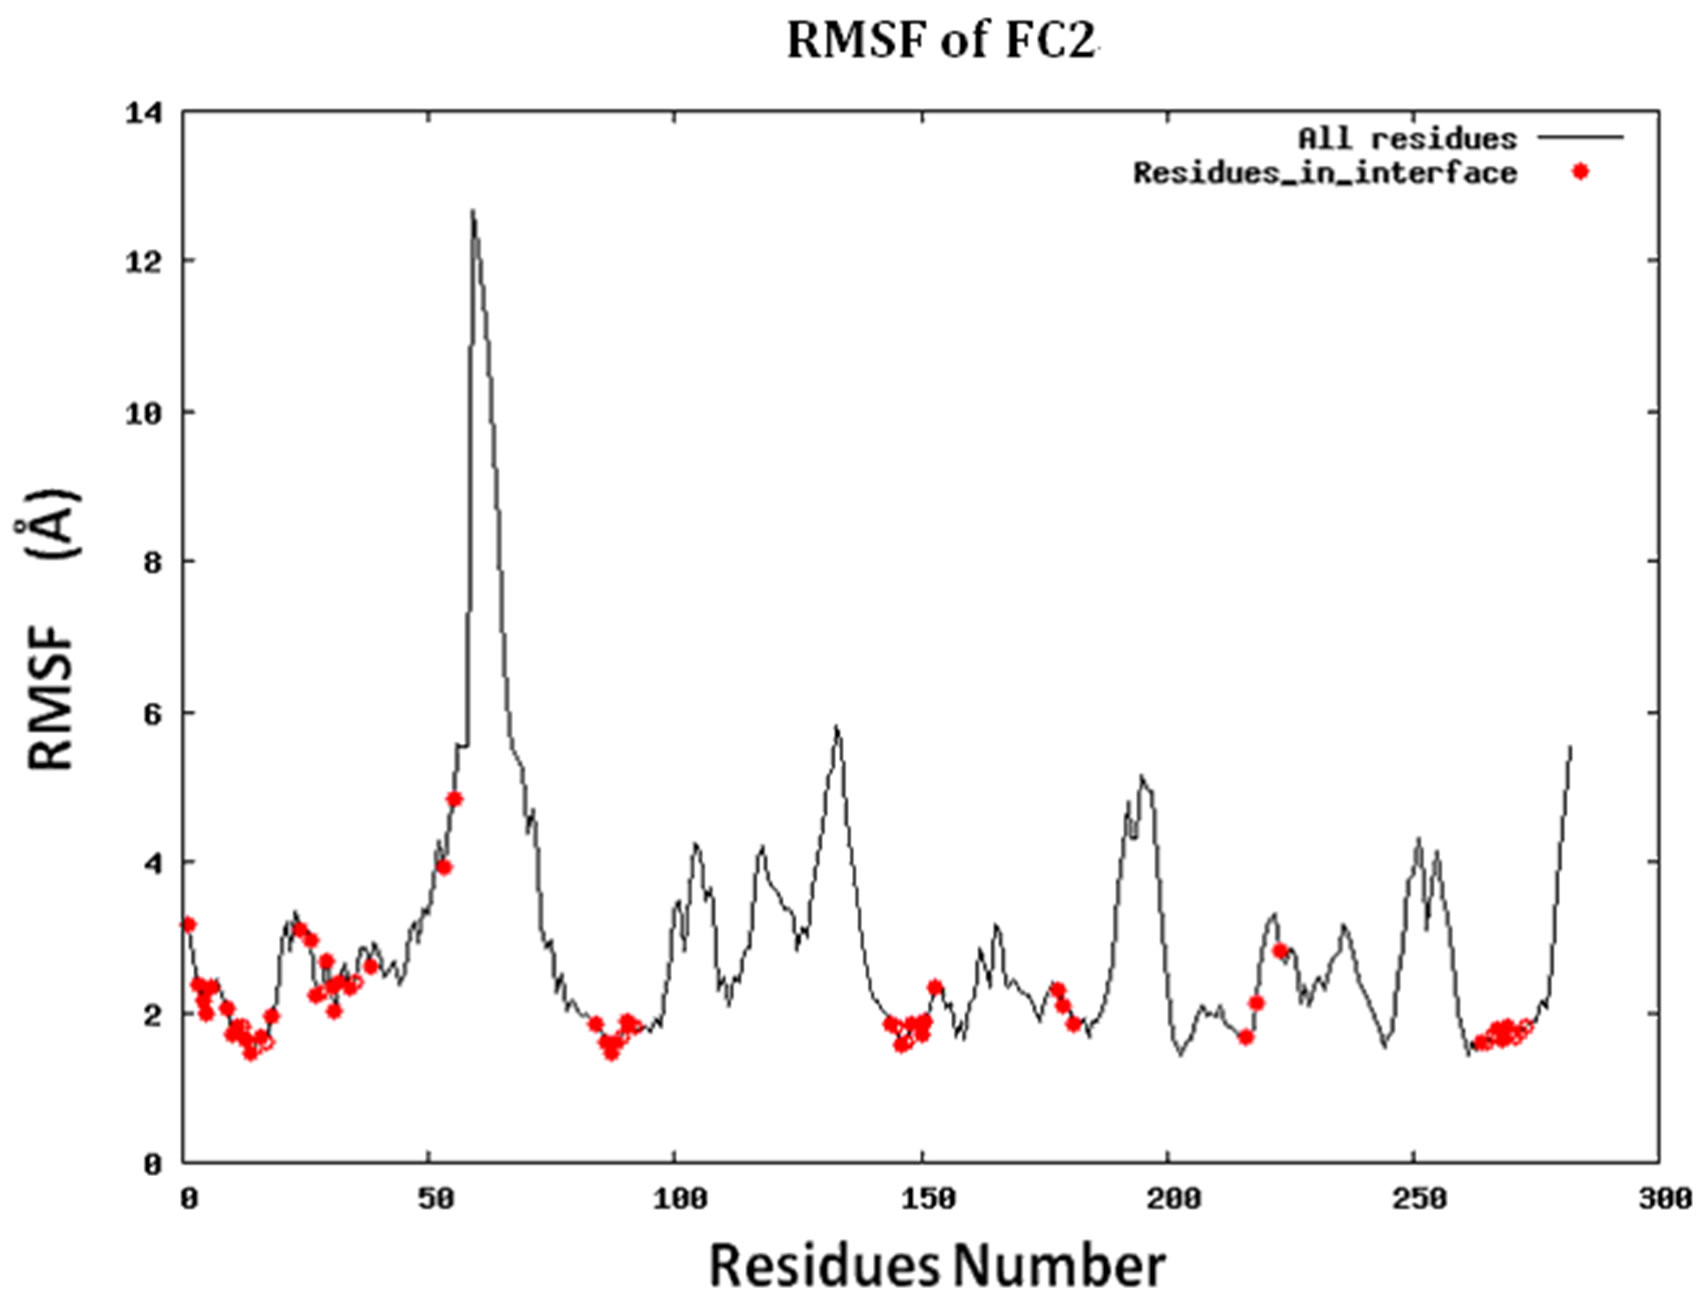
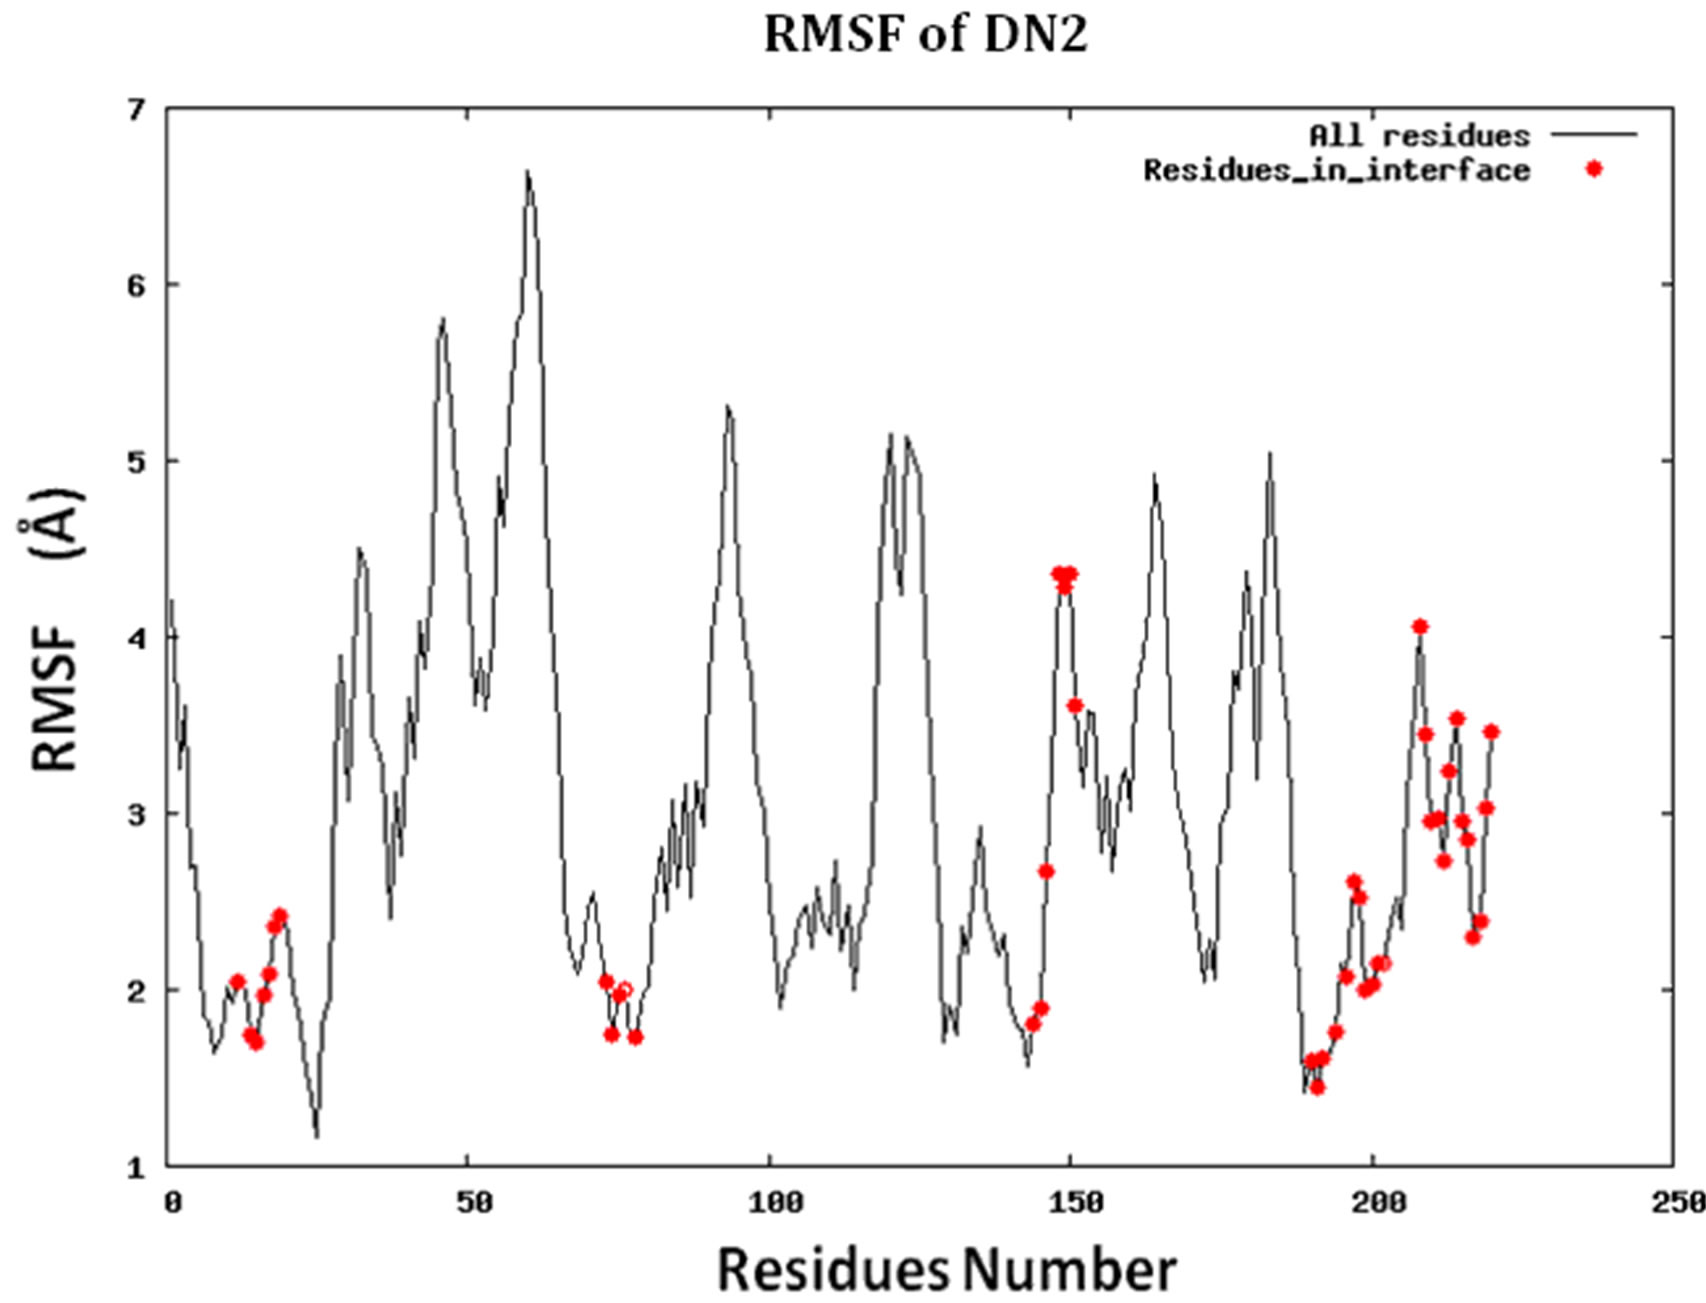

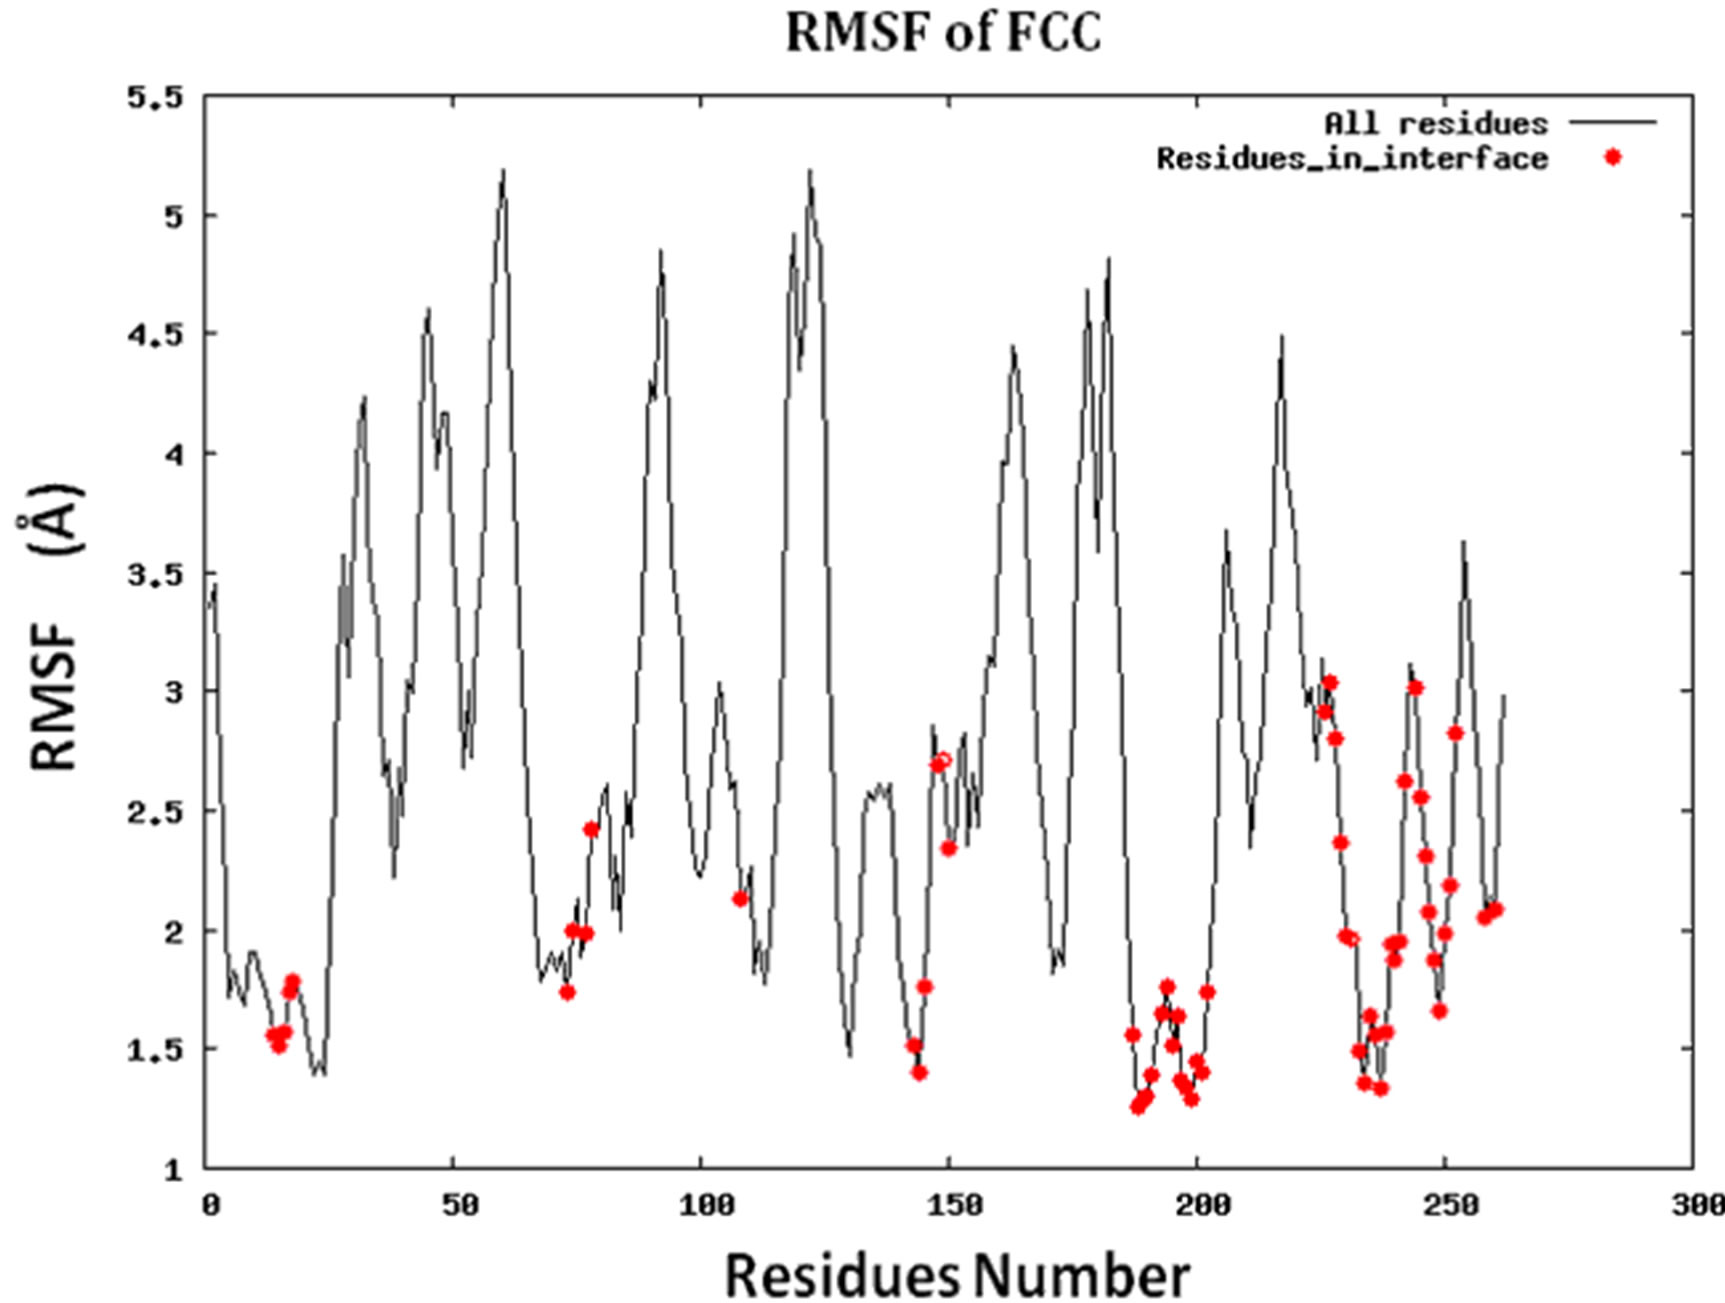
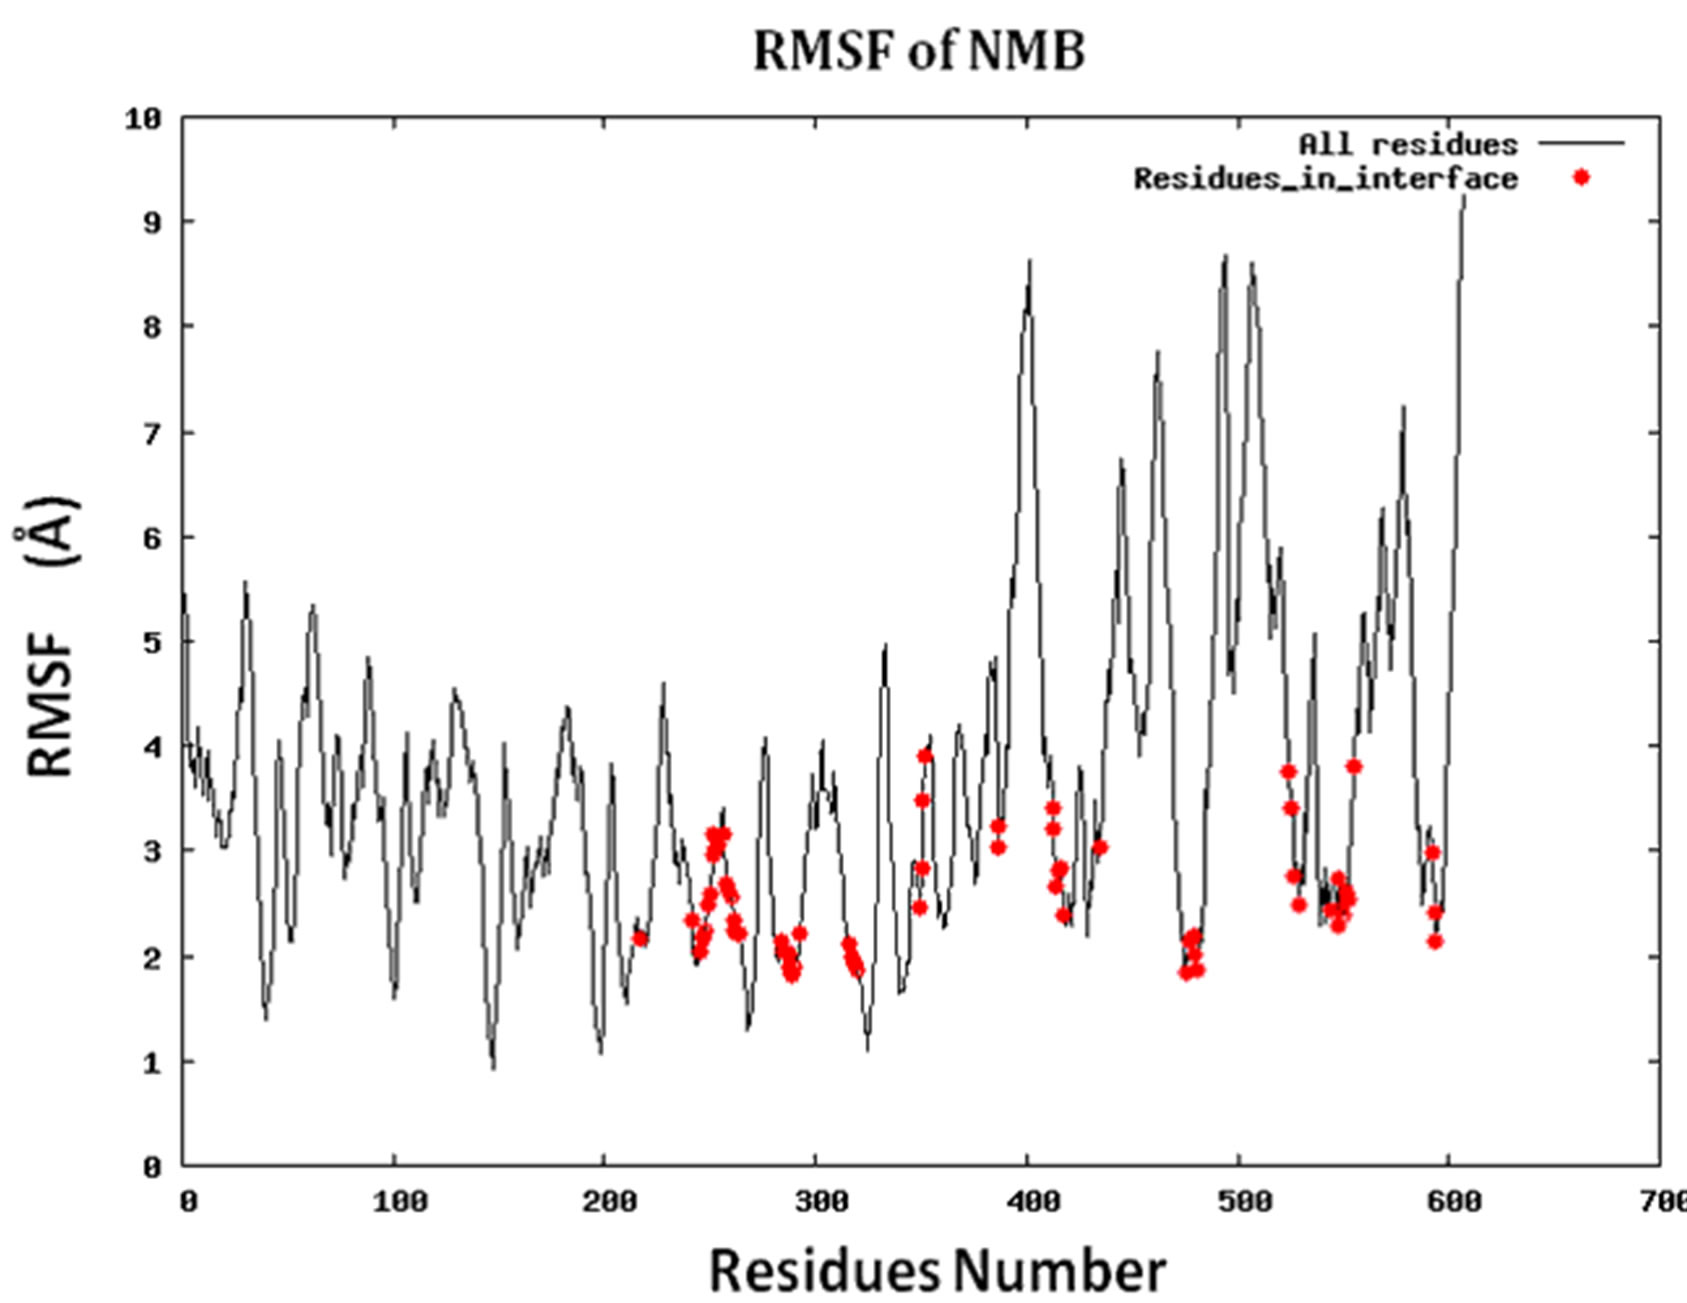
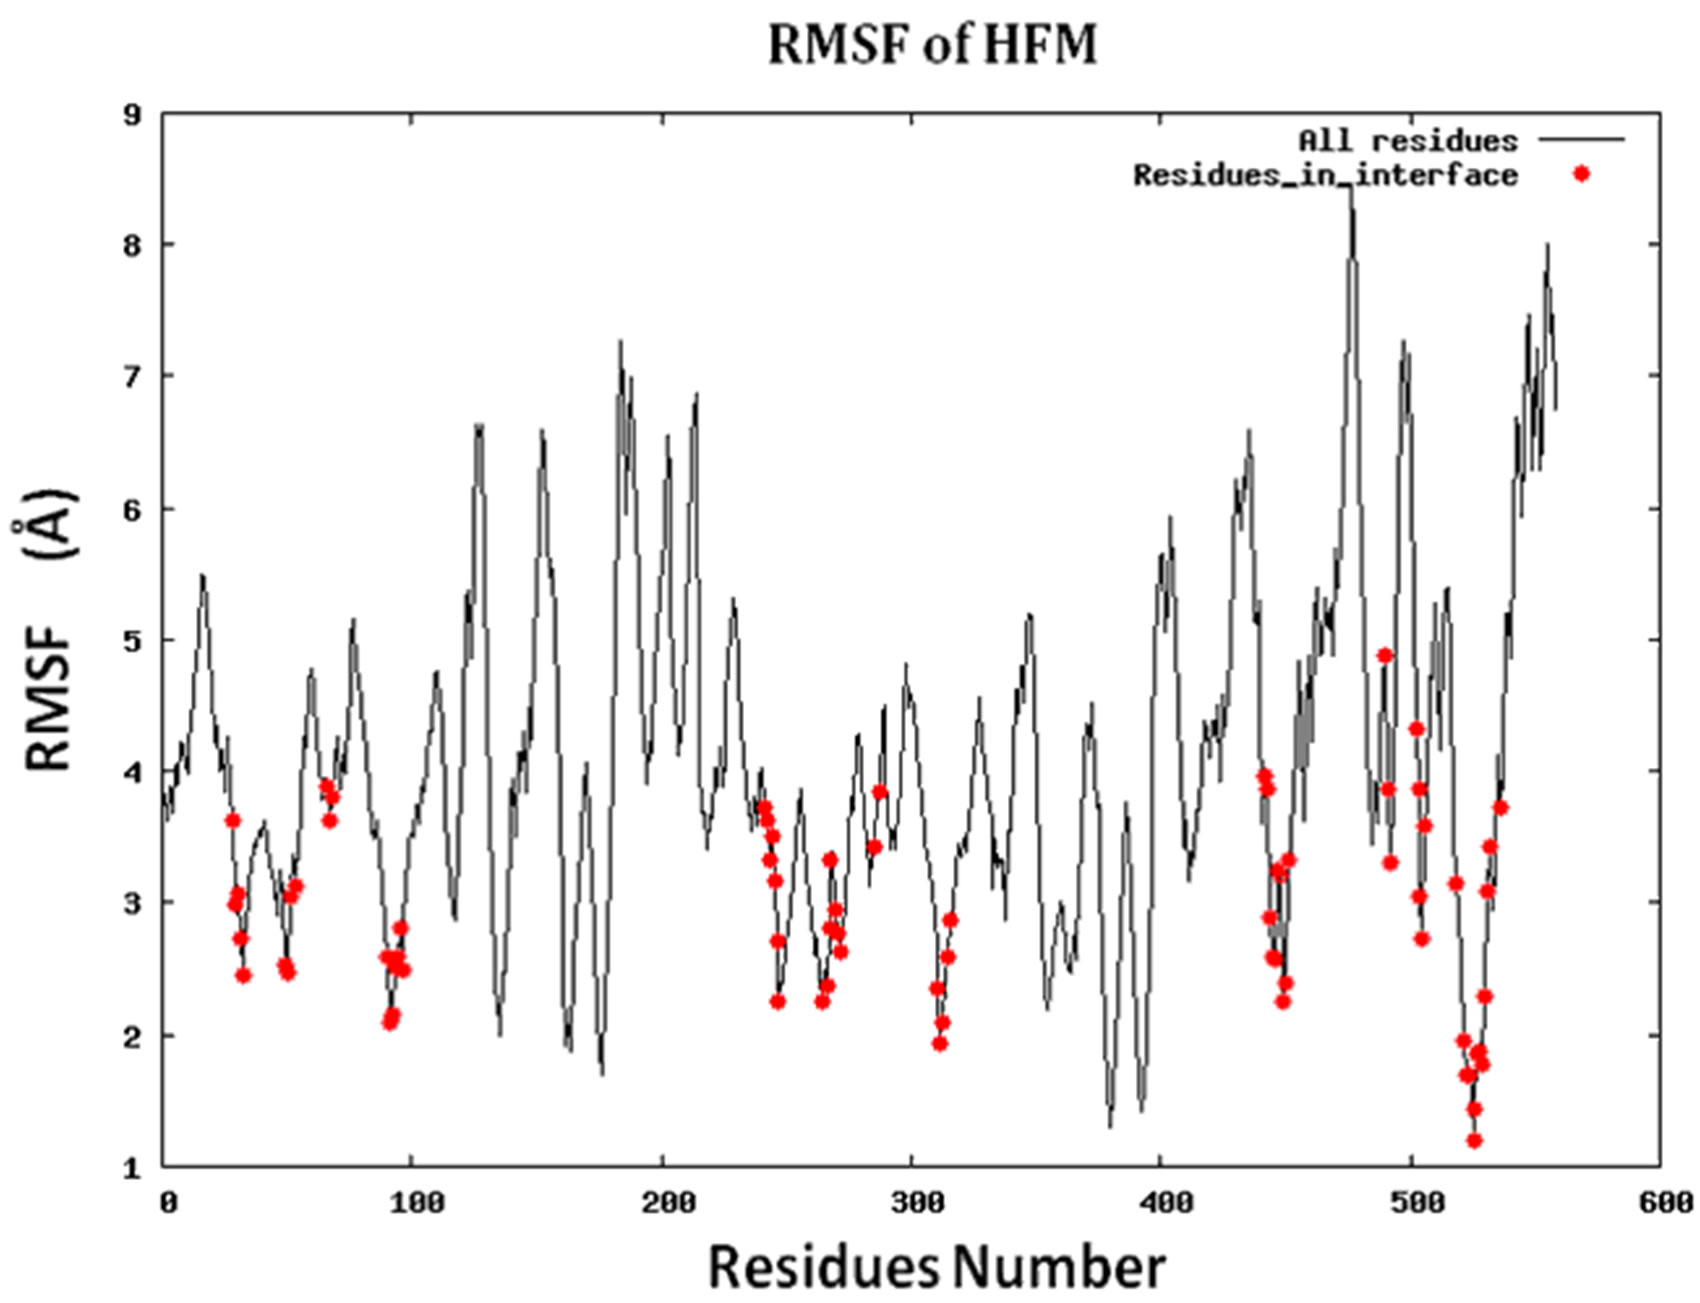
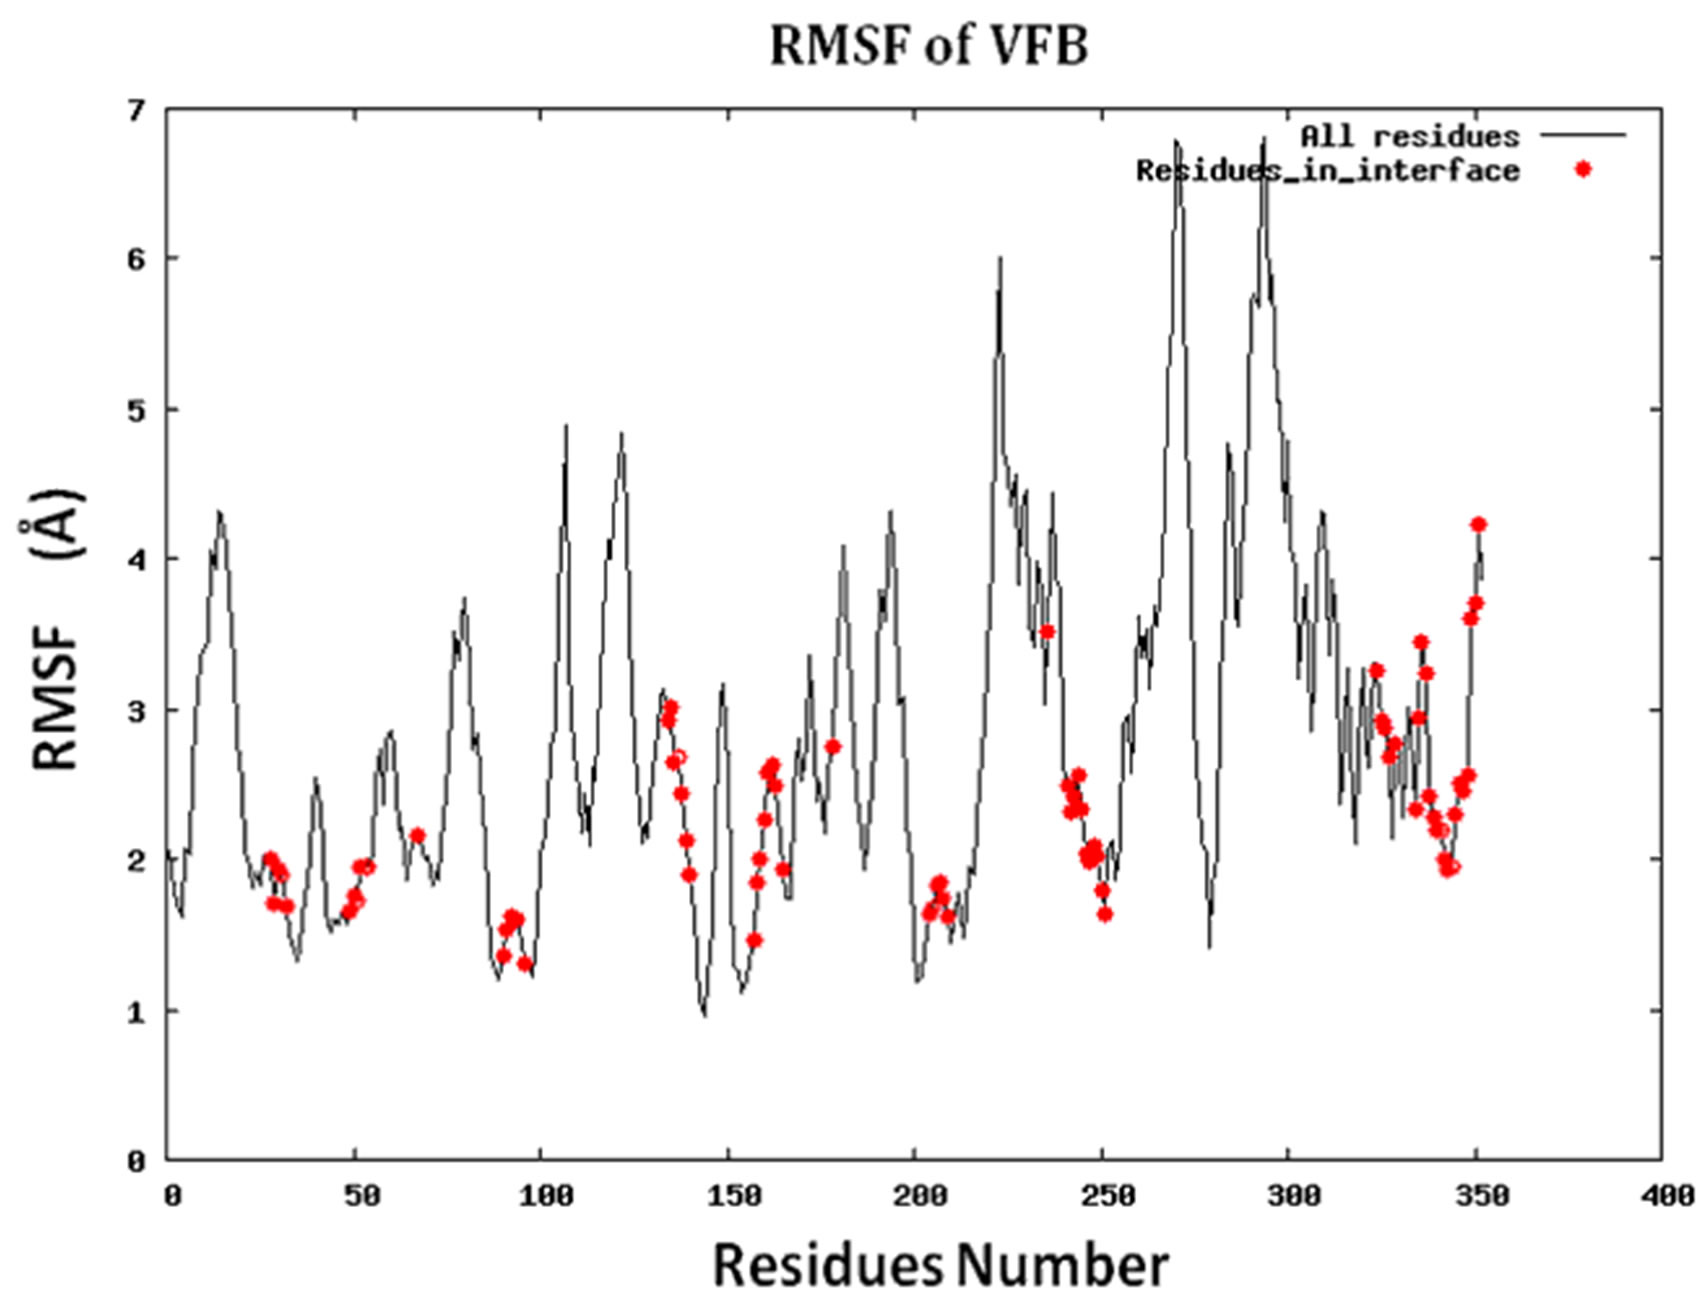
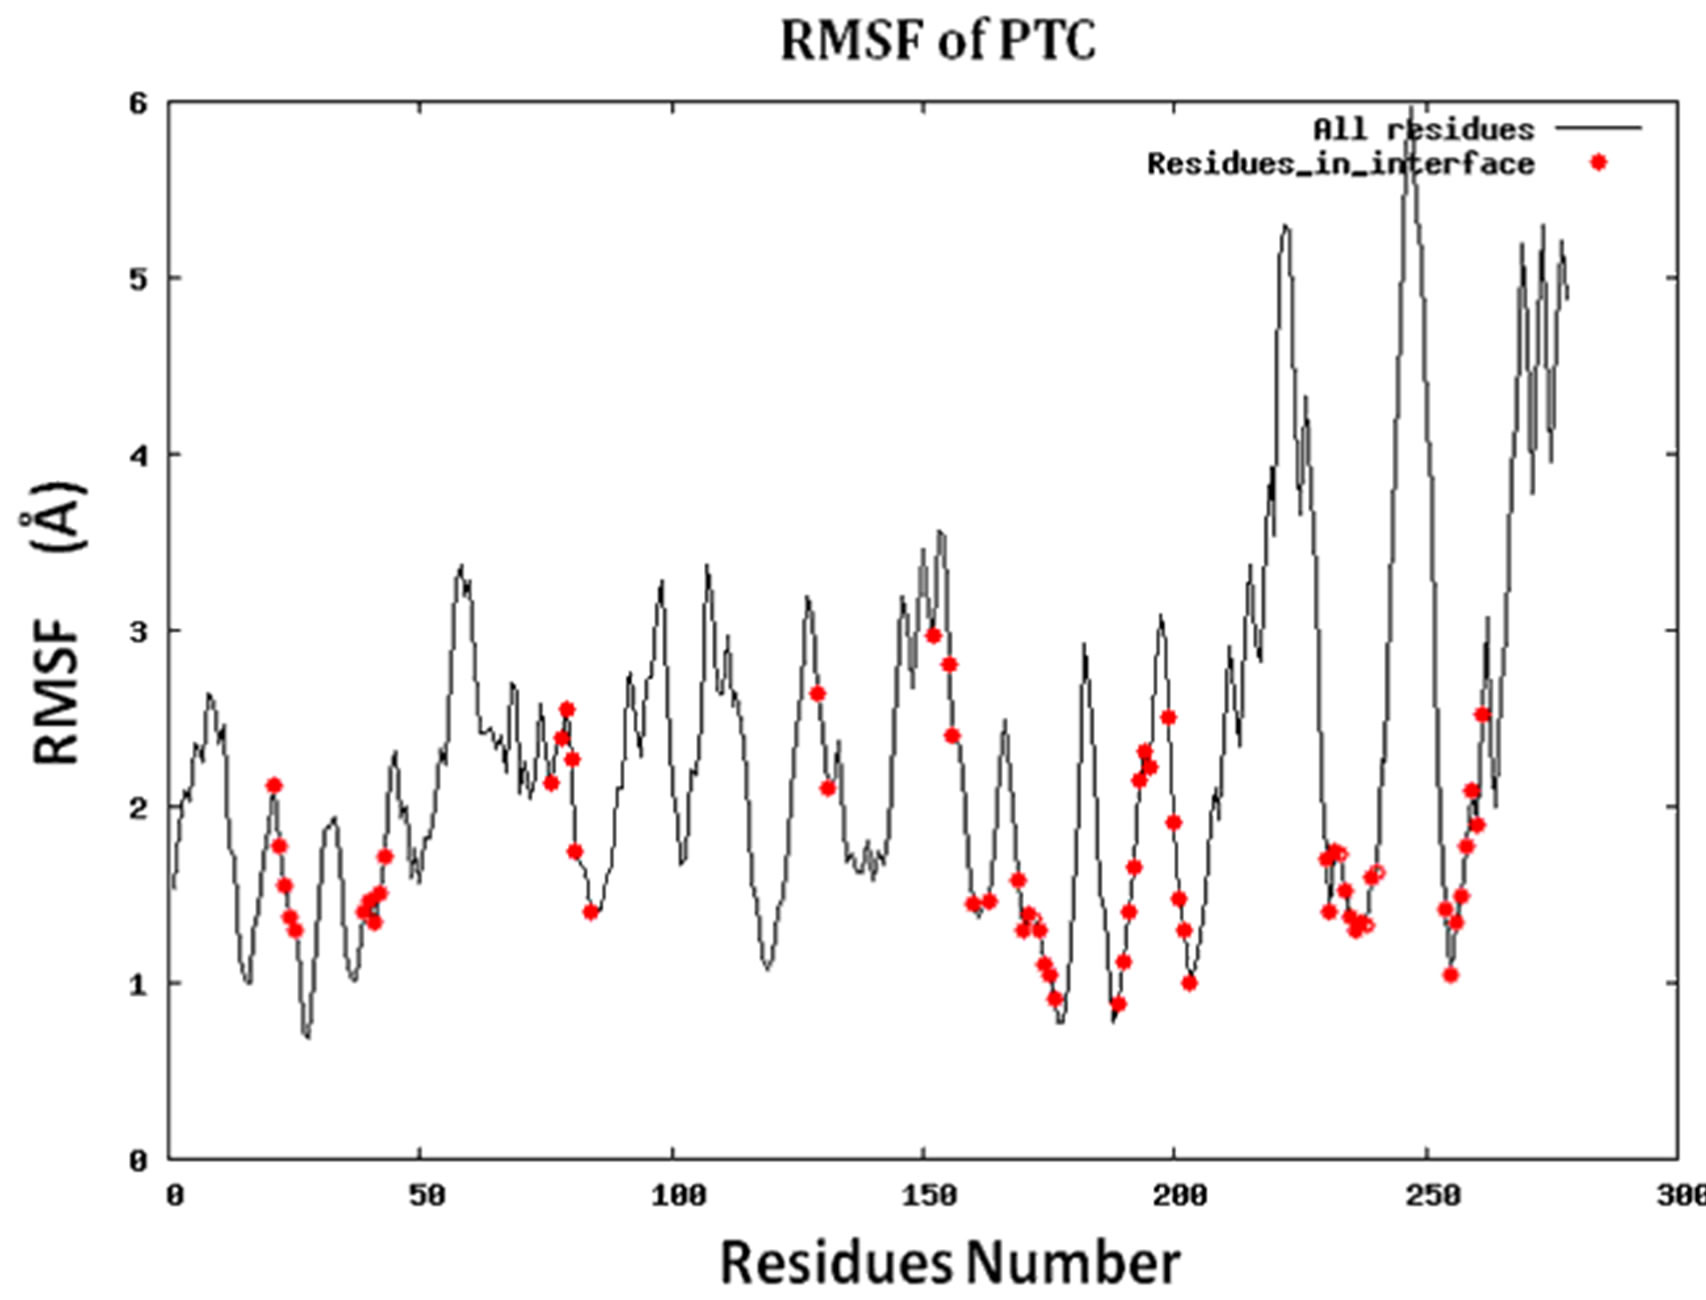
Figure S2.RMSF for the 14 proteins.
NOTES
*Corresponding authors.