Journal of Sustainable Bioenergy Systems
Vol.4 No.1(2014), Article ID:44241,14 pages DOI:10.4236/jsbs.2014.41003
Performance Assessment of an Allothermal Auger Gasification System for On-Farm Grain Drying
Samy Sadaka*, Mahmoud Sharara, Gagandeep Ubhi
Department of Biological and Agricultural Engineering, University of Arkansas Division of Agriculture, Little Rock, USA
Email: *ssadaka@uaex.edu
Copyright © 2014 by authors and Scientific Research Publishing Inc.
This work is licensed under the Creative Commons Attribution International License (CC BY).
http://creativecommons.org/licenses/by/4.0/


Received 10 December 2013; revised 9 January 2014; accepted 3 February 2014
ABSTRACT
Biomass gasification is a well-developed technology with the potential to convert agricultural residues to value-added products. The availability of on-farm gasifiers that can handle low-density agricultural wastes such as soybean residue, an underutilized feedstock, is limited. Therefore, the goal of this research was to install and assess an allothermal, externally heated, auger gasifier capable of converting agricultural wastes to combustible gas for on-farm grain drying. The system was used to convert soybean residues under different reactor temperature, i.e., 700˚C, 750˚C, 800˚C, and 850˚C. The results showed that increasing the reactor temperature from 700˚C to 850˚C increased the producer gas molar fractions of H2, CO, and CH4, from 1.1% to 1.5%, from 15.0% to 23.8%, and from 5.1% to 7.7%, respectively. The higher heating value of the producer gas reached 6.3 MJ/m3 at reactor temperature of 850˚C. Specific gas yield increased from 0.32 to 0.58 m3/kgbiomass while char and particulate yield decreased from 41.7% to 33.6% by increasing the reactor temperature from 700˚C to 850˚C. Maximum carbon sequestration achieved, in the form of biochar-carbon, was 32% of the raw feedstock carbon. Gasification of collectable soybean residues from 1 acre would be sufficient to dry 1132 kg of soybean seeds (the average yield from one acre) from moisture content of 20% to 13% (wet, weight basis). Furthermore, about 300 kg of biochar, a value-added soil conditioner, could be produced and applied to the soybean land as a bio-fertilizer.
Keywords:Thermochemical; Gasification; Producer Gas; Soybean Residues; Biochar; Allothermal; Auger Gasifier; Grain Drying

1. Introduction
Grain drying in the United States depends entirely on non-renewable energy sources. Significant amounts of natural gas and propane are consumed annually to bring grains moisture content down to safe storage levels. In conventional air-drying, about 2.6 MJ is needed to evaporate one kilogram of moisture [1] . Accordingly, the energy required to dry 1,000,000 bushels of soybean (1 bushel = 27.27 kilogram), in typical large-scale drying bins, from initial moisture content of 22% down to 13% is about 7.3 Terajoule (tera = 1012). Continuous use of non-renewable energy sources in this process further increases the carbon footprint of agriculture. Furthermore, any instability in the supply of these fuels would profoundly affect prices of food commodities. The current shortage of propone supply, during the grain-drying season, in the Mid-West is a clear example of this dependency. Hence, there is a motivation to move towards sustainable agricultural practices by relying on renewable resources of energy to the extent that is economically feasible. One of the renewable energy sources ready available on farm is crop residue.
Yields of crop residue are directly related to the areas cultivated with that crop as well as to the crop variety planted. Among the crop residues that have seen yield increases is soybean residue. A USDA report estimated total soybean production in 2013 at 3.15 billion bushels, compared to 3.01 billion bushels in 2012 and 3.06 billion bushels in 2011. The average US soybean yield for 2013 is estimated at 41.2 bushels per acre [2] . Lang [3] estimated that seeds represent about 29% of the total dry weight while collectable stems represent about 17% of the total dry weight. Accordingly, the total collectable soybean residues could reach about 50 million ton in 2013. This residue contains about 750 Terajoule of stored chemical energy. However, these vast quantities of soybean residue are underutilized, mainly due to the lack of commercialized collection equipment or utilization facilities. Consequently, the potentials of soybean residues for heat and power generation using current conversion technologies have not been closely evaluated. Two proven technologies suitable for on-farm conversion, i.e., gasification and pyrolysis, could be utilized to convert soybean residue to gaseous or liquid fuel in addition to a solid co-product (biochar).
Biomass gasification is a well-developed technology that generates a lowto medium-heating value fuel gas, namely, producer gas. The producer gas can be directly combusted to generate heat or used in an engine or a gas turbine for electricity generation [4] [5] . Alternatively, the producer gas can be further purified from tar and other contaminants then converted, via the Fischer-Tropsch process, to liquid hydrocarbons. Studies have also investigated the potential use of fermentative bacteria to convert CO and H2 in the producer gas to ethanol [6] -[8] .
Gasification is accomplished under elevated temperatures, between 600˚C to 1400˚C, using one or a combination of the following agents: air, oxygen, steam, carbon dioxide [9] . Air gasification is widely implemented since no costs are incurred with the purification or generation of the gasifying agent (unlike with oxygen, steam, or carbon dioxide). The producer gas generated from air gasification, however, is unsuitable for pipeline transportation due to its low energy content (4 - 7 MJ·m−3) as reported by Sadaka et al. [10] .
Various catalysts, i.e., dolomite, alkali, or nickel catalyst were investigated as tar reforming aids in the reacting bed or in a downstream catalytic reformer. Gil et al. [11] tested the performance of a fluidized bed gasifier while using in-bed calcined dolomite. They reported that mixing the bed material, i.e., silica sand, with dolomite by 25% - 30% wt. decreased the tar content in the producer gas to 1 g·m−3. They also reported that the gas yields increased after mixing dolomite with the bed media. Corrella et al. [12] studied the effects of mixing olivine and dolomite on the performance of a fluidized bed gasifier. They found that dolomite was more active than olivine in reducing the tar contents in the producer gas.
A variety of reactor configurations: fixed beds [13] , fluidized beds [14] , and entrained reactors [15] have been developed and evaluated in coal and biomass gasification. Additionally, new designs such as rotary kiln reactors [16] and auger reactors have been investigated to accommodate certain feedstocks, or to address specific conversion criteria. In a wood gasification study, using a fluidized-bed unit, Compoy et al. [17] reported that the producer gas heating value ranged from 5.0 to 9.3 MJ·m−3 and the cold gas efficiency ranged from 54% to 68%. Jae Ik Na et al. [18] studied the behavior of combustible landfill waste pellets in an updraft gasifier (I.D. 150 mm, 1100 mm total height) with temperatures ranging between 1100˚C and 1450˚C. They reported a maximum CO yield of 40% at maximum temperature of 1450˚C. The cold gas efficiency was found to be around 60%. They also reported that the heating value of producer gas and the specific gas yield reached their maximum of 13.4 MJ·m−3 and 1.8 m3·kg−1biomass, respectively at the same temperature level. Zhou et al. [19] studied the effect of operational parameters; residence time, temperature and oxygen-to-biomass ratio on the gasification of rice husk, sawdust and camphor wood. They used ground feedstock, 0.15 to 0.25 mm particlesize, in an entrained flow reactor (I.D. 40 mm, height 1000 mm) at temperatures between 1000˚C and 1400˚C, residence times between 0.4 and 2.0 s and oxygen-to-biomass ratios ranging from 0.0 to 1.5 kg·kg−1. They reported an increase in the gas quality and the cold gas efficiency at 1400˚C, while the optimal residence time and oxygen to biomass ratio were 1.6 s and 0.4 kg·kg−1, respectively.
On the other hand, several researchers studied pyrolysis platforms specifically in auger systems, to produce liquid biofuels. Ingram et al. [20] benchmarked the bio-oil produced from pinewood and bark (2 - 4 mm particle size) in an externally heated auger pyrolysis reactor (throughput of 1.0 kg·h−1) against bio-oil produced in other reactors. They reported comparable bio-oil quality, but low heat transfer rates in the auger system. ThangalazhyGopakumar et al. [21] used an externally heated auger reactor to pyrolyze pinewood under different temperature conditions. They reported maximum bio-oil yield at 450˚C, but the optimal bio-oil quality was achieved at 475˚C. Garcia-Perez et al. [22] also successfully pyrolyzed pinewood pellets (cylindrical particles, 12.8 mm length and 6.4 mm diameter, respectively) in an externally heated auger pyrolyzer at low rotational speed. Puy et al. [23] conducted a series of pyrolysis experiments, in an externally heated auger reactor, on wood chips (2 mm particle size) to investigate the effects of operational parameters, i.e., bed temperature, residence time, and mass flow rate on bio-oil yield. They reported most valuable yield at 500˚C, with more aromatic compounds at higher reaction temperatures. Additionally, they reported the need for at least 2 minutes of residence time in order to achieve complete conversion. Brown and Brown [24] used response surface methodology (RSM) to optimize operation parameters for an auger pyrolysis reactor (auger speed, heat carrier temperature, heat carrier flow-rate, and nitrogen flow rate) using separately heated steel shot as the heat carrier. They concluded that increasing auger speed improved the bio-oil yields when temperatures exceeded 550˚C in the bed, given the high rates of heat transfer in the bed compared to externally heated reactor vessels. Auger systems appear to have a good potential for commercialization mainly due to their familiarity as an industrial unit operation. Furthermore, use of motorized auger, although adds to the system energy inputs, forces the feedstock movement along the reactor, thus avoiding agglomeration which is common in gravitational flow fixed-bed systems.
Literature survey showed several investigations of agricultural residues pyrolysis in auger systems and very few of auger gasification. Therefore, the main goal of this research was to install and assess an allothermal auger gasifier capable of converting agricultural residues to gaseous, liquid, and solid fuels. The specific objectives were: 1) to study the effects of gasifier temperature on the quality and quantity of the biofuel, and 2) to explore the potential of utilizing the produced fuels for on-farm grain drying.
2. Materials and Methods
2.1. Soybean Residues
The soybean residues were collected during the 2011-harvesting season from the University of Arkansas farm near Fayetteville, Arkansas then stored in airtight, 30-gallon plastic containers at the Rice Research and Extension Center, University of Arkansas, Stuttgart, Arkansas. When needed, soybean residues were chopped using a knife mill (Thomas Wiley Mill, Swedesboro, NJ). A ground soybean sample was sent to Huffman laboratory, Golden, CO, USA for elemental analysis.
2.2. Mixing Dolomite with Feedstock
Dolomite, calcium magnesium carbonate (CaMg(CO3)2) was purchased from a local vendor before mixing it with chopped soybean residues (1 kg dolomite/15 kg soybean residues). Three representative samples were collected from the soybean/dolomite mixture then stored in plastic bags for further analysis. These samples were used to determine the physical, chemical, and thermochemical characteristics of the soybean/dolomite mixture.
2.3. Laboratory Analysis
Physical, chemical, and thermochemical characteristics of the soybean residues were determined in triplicates; the means and the standard divisions are listed in Table 1. Soybean moisture content, volatile solids and ash contents were determined according to the standard methods: ASTM D 2974, 2000; EPA-821-R-01-015, 1684; and ASTM D 3174-002, 2000, respectively. Fixed carbon was obtained as the difference between dry weight and the sum of volatile solids and ash. The pH values of the soybean residues were determined using an OMEGA Water Analyzer PHH-500 Series. Higher heating values were determined using an oxygen bomb calorimeter (Parr instruments, Model1241, Moline, Illinois, USA) according to ASTM Standard D5865, 2007. Detailed of these analyses were listed in a previous publication [25] . The bulk density of the soybean residue-dolomite mixture was determined through repeatedly weighing a constant-volume of this mixture.
2.4. Auger Gasifier
The auger gasifier unit (Figure 1) consisted of the following subunits: a) biomass-feeding, b) air supply, c) auger reactor, which includes the heating element and temperature controller, d) char collection, e) liquid (tar and water) collection, f) gas cleaning, yield and analysis, and g) data acquisition. The following subsections provide the details on these subunits.

Table 1. Characteristics of feedstock (soybean residues and dolomite).
1Ultimate analysis was performed on one soybean residue sample without dolomite. 2Numbers represented after the ± sign are the standard divisions.
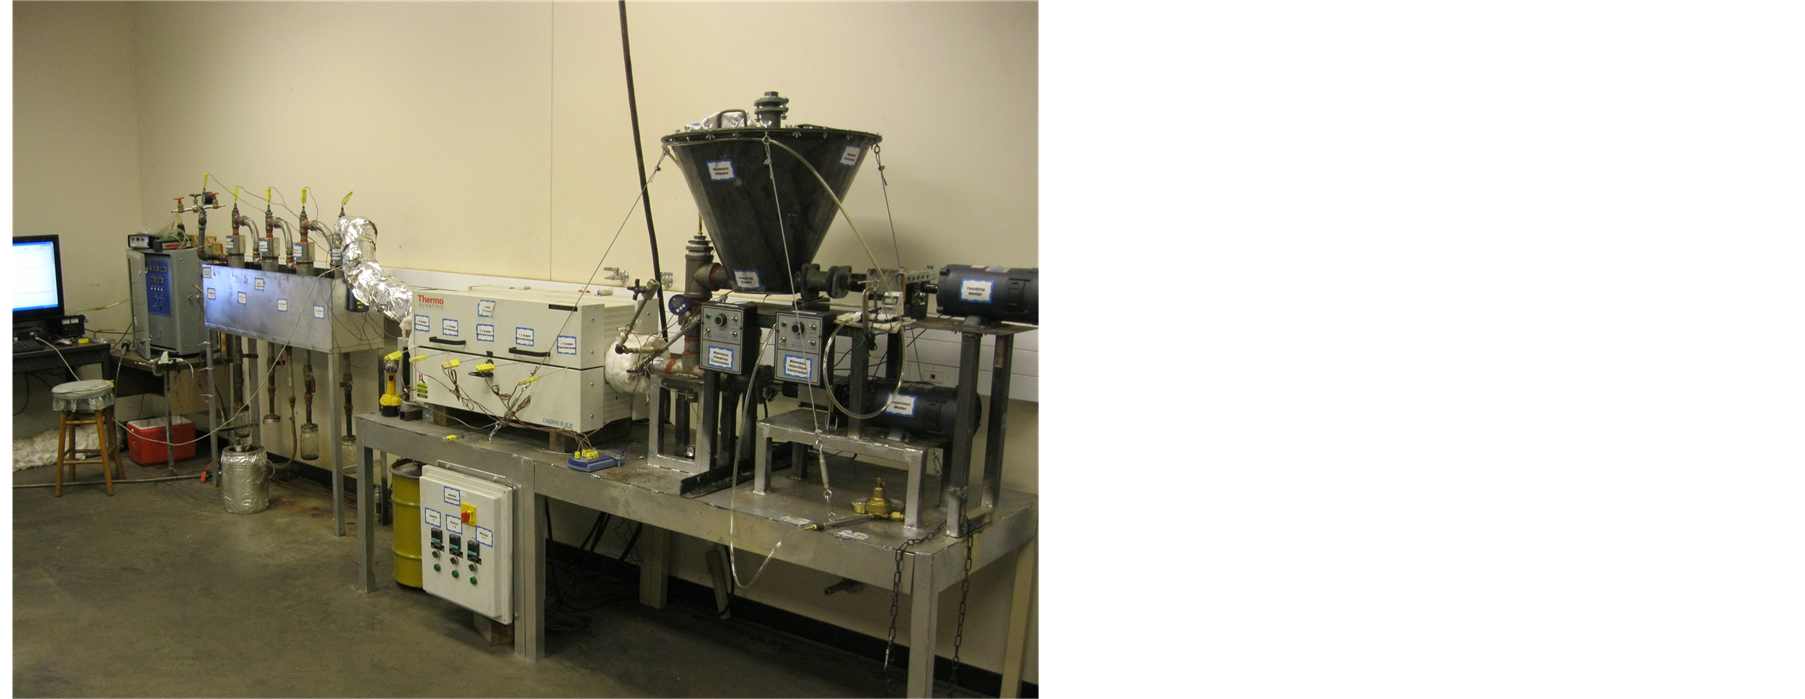
Figure 1. The allothermal auger gasification system.
2.4.1. Biomass-Feeding Unit
The biomass-feeding unit consisted of a hopper, a metering auger, a motor with a speed controller and a gearbox. The hopper had an inverted cone; the larger diameter at the top was 60 cm while the smaller diameter at the bottom was 20 cm. The hopper lid was fastened with bolts and winged nuts (24 bolts) and lined with a rubber gasket to ensure a proper seal. A smaller opening (25 cm × 20 cm) was fashioned on top of the large lid for easy access and refill. The metering auger, a full pitch auger, 5.0 cm outer diameter (OD) and 2.5 cm inner diameter (ID), was housed inside a 6.3 cm ID black steel horizontal pipe. This pipe was connected at the beginning to a vertical pipe (6.3 cm) with a T-connector, which serves as the connection between the feed and the injection auger. The metering auger was driven by a 3/4 horsepower (hp) DC motor, 90 VDC, 1750 RPM, 7.5A (LEESON, Electric Corporation, Grafton, WI) wired to a DC controller (SPEEDMASTERTM 115 VAC to 90 VDC, LEESON, Electric Corporation, Grafton, WI). The motor was connected to a gearbox (1:50 rpm). A pressure gauge (Media GaugeTM MGA-30 PSI SSI Technologies, INC, Janesville, WI) and a type K thermocouple were installed on the hopper to monitor the pressure and the temperature for safety. Prior to running experiments, the feeding system was calibrated. This calibration was accomplished by running a known amount of the biomass through the metering and the injection augers at the desired speeds. The amount of biomass collected during 30 minutes intervals were recorded and averaged to evaluate the biomass-feeding rate.
2.4.2. Air Supply Unit
A compressed air cylinder, a gas pressure regulator, a gas flow meter, and a set of manual valves were used to maintain the flow at set rates to the reactor. Air supply was monitored by an Omega gas flow meter (4 - 20 L·min−1). Two ball valves were used to provide additional control over the rate of air. Airflow rate was adjusted to maintain an equivalence ratio (ER) of 0.25. Equivalence ratio was determined as the ratio between the actual airflow rate and the stoichiometric airflow rate.
2.4.3. Auger Reactor, Heating Element, and Temperature Control
The auger gasification section consisted of an auger, auger housing, a motor, a controller, a gearbox, a split tube furnace with a temperature controller. A 120 cm-long screw (5.0 cm OD and 2.5 cm ID, full pitch) was installed on a 2.5 cm stainless steel pipe forming the auger assembly. The auger was housed inside a 6.3 cm stainless steel pipe forming the auger gasifier. The auger was powered by a 3/4 HP DC motor 90 VDC, 1750 RPM, 7.5A (LEESON, Electric Corporation, Grafton, WI) wired to a DC controller (SPEEDMASTERTM 115 VAC to 90 VDC, LEESON, Electric Corporation, Grafton, WI) and connected to a gearbox (1:50 rpm). The auger gasifier was placed inside a 5.1 kW (Lindberg/Blue M. Ashville, NC) split tube furnace. The tube furnace had three separate heating zones (20 cm each), with three separate PID controllers (Gefran 600, Gefran SPA, Italy) in order to control the temperatures in each zone separately. In this study, all zones were maintained at the same temperature during each test.
2.4.4. Char Collection Unit
The char residue was collected in a 50 L container, which was secured to the gasification assembly. The clamped container lid was fitted with a threaded flange (6.3 cm diameter), and fastened onto the cross connector at the end of the auger reactor using a 6.3 cm connecting pipe to facilitate char collection. The char leaving the reactor collected in this container by gravity. Prior to starting each experiment, an emptied and weighed char collector was connected to the system.
2.4.5. Tar and Water Vapor Collection Unit
The separation of condensable vapors from the gas stream was accomplished using a setup of four stainless steel condensers, connected in series, placed in a large ice bath (120 liter). Each condenser consisted of a 7.6 cm pipe caped on both ends with stainless steel caps fitted with pipes (2.5 cm). The producer gas entered each condenser at the top and passed all the way to the bottom of the cylinder through the 2.5 cm pipe. Then the gas exited from the side of the condenser close to the top. The condensate (tar and water) collected at the bottom of each condenser in an attached 1 L glass jar. Temperatures inside the condensers were monitored using type K thermocouples.
2.4.6. Gas Cleaning, Yield and Analysis Unit
The producer gas was passed through two gas-cleaning bottles attached in series to ensure thorough cleaning. The two bottles, packed with glass wool, were immersed in an ice path. The gas yield was measured using an OMEGA gas flow meter (4 - 50 L·min−1). The temperature of the producer gas was monitored using a Type K thermocouple to compensate the effect of temperatures in determining the gas production rate.
To further ensure a tar and particulate-free gas flow to the gas analyzer, two stainless steel condensers (3.7 cm ID and 30 cm length) filled with glass wool and immersed in an ice bath, were used. Additionally, an activated carbon filter (DIA-LNCC-1/4, United Filtration Systems; Sterling Heights, Michigan) was used in the line before collecting the gas in Tedlar® bags (10 L).
Prior to gas analysis, the Tedlar bags were placed in a freezer (1˚C) for an hour to ensure that no tar would be introduced to the analyzer. Following, the Tedlar bag was connected to a NOVA gas analyzer which detects the concentration of permanent gases; CO (0% - 100%), CO2 (0% - 100%), CH4 (0% - 100%) and H2 (0% - 100%) as well as O2 (0% - 25%).
2.4.7. Data Acquisition Unit
Two data loggers (TC-08 OMEGA) were used to automate recording the temperature measurements every 30 seconds. The thermocouples were connected to the data loggers (8 data channels each) both of which were connected to a PC running the data logging software. In addition to data retrieval and storage, the software enabled real-time visualization of temperature profiles in each measurement point. The gas composition was displayed in real-time on built-in digital displays of the gas analyzer, while composition data collection was maintained by recording each sensor voltage output (0 - 1 V) on a minutely basis using a programmable CR10X Campbell scientific data logger.
2.5. Experimental Procedure
The allothermal gasifier, detailed previously, was used to gasify soybean residues at the following temperatures: 700˚C, 750˚C, 800˚C, and 850˚C. The performance of the system was characterized using the temperature profiles, the products distribution, the gas quality and quantity, the biochar, and liquid (tar and water) production rates, and the carbon sequestration potential. Additionally, a scenario was created to explore the utilization of the heat released from on-farm burning of the producer gas for grain drying.
The feedstock was added to the feed hopper through the small lid and conveyed into the reactor by the feeding auger. Biomass feed rate was adjusted based on previous calibration. Air (6 L·min−1) was injected through the gas port at the feed drop-off point to maintain the desired equivalence ratio, and to counter any backflow of evolved gases from the reactor to the hopper.
Once the reactor temperature reached the desired level, the biomass feeding was initiated. The system ran for half an hour on a steady state condition. Subsequently, the tube furnace was turned-off. The biomass auger was stopped. After about four hours, the char collector was disconnected and weighed. The glass jars were emptied from the tar and water to determine tar-water mass. Char samples were sent to an external laboratory (Huffman Lab., Golden, Colorado, USA) for ultimate analysis [26] .
3. Results and Discussions
3.1. Temperature Profiles
Reactor temperature is a key factor that affects its performance since all gasification reactions, whether endothermic or exothermic, are temperature sensitive. Figure 2 illustrates the temperature profile at different points measured from the biomass entry point for the duration of the gasification tests; 30 minutes for the 4 temperature levels studied. The measuring tips for all temperature sensors (Type-K thermocouples) were adjusted to ensure no contact with the reactor wall, or the rotating auger. The temperatures recorded, therefore, represent the temperature of the gasifying agent/devolatilized species mixture in the reactor. Under tested conditions, temperature at the biomass entry point (0.0 m) did not exhibit changes as it was sufficiently far from the heated segment (30 cm). Additionally, the constant temperature at the entry point indicated that the forced flow of gasifying agent have prevented the backflow of high temperature species, as well as any thermal conduction along the reactor wall.
The introduction of the biomass triggered changes in the temperature profile that reflect the sequential stages of the biomass conversion process. Temperatures in first segment of the system (at 0.22 m, and 0.41 m from
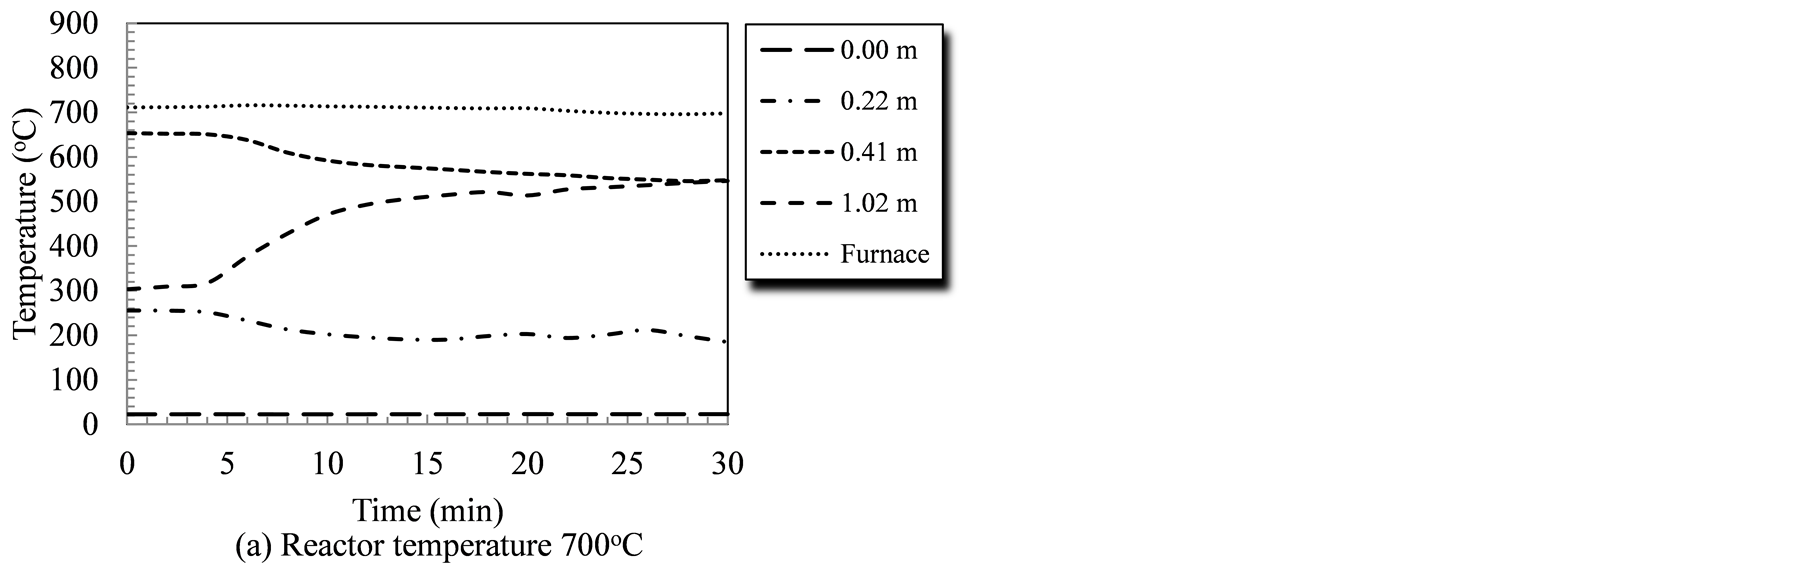
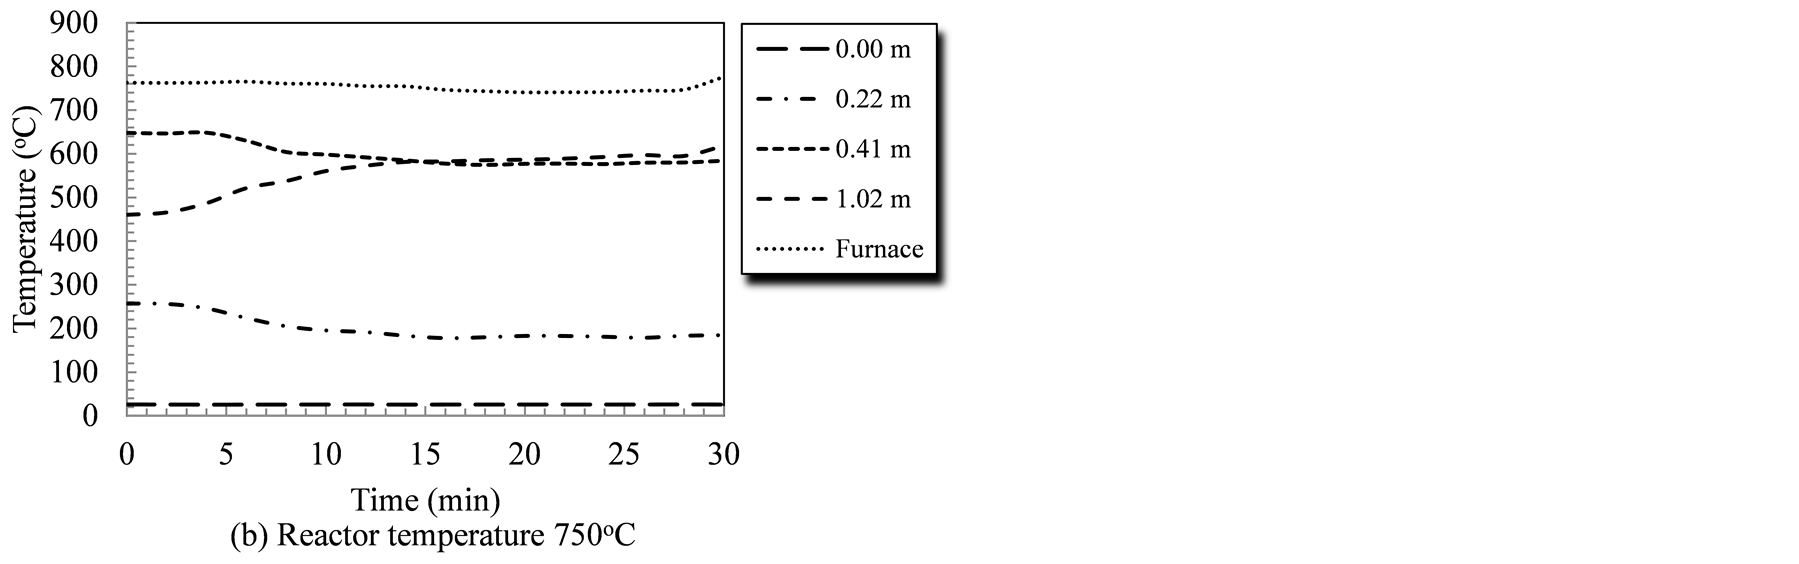

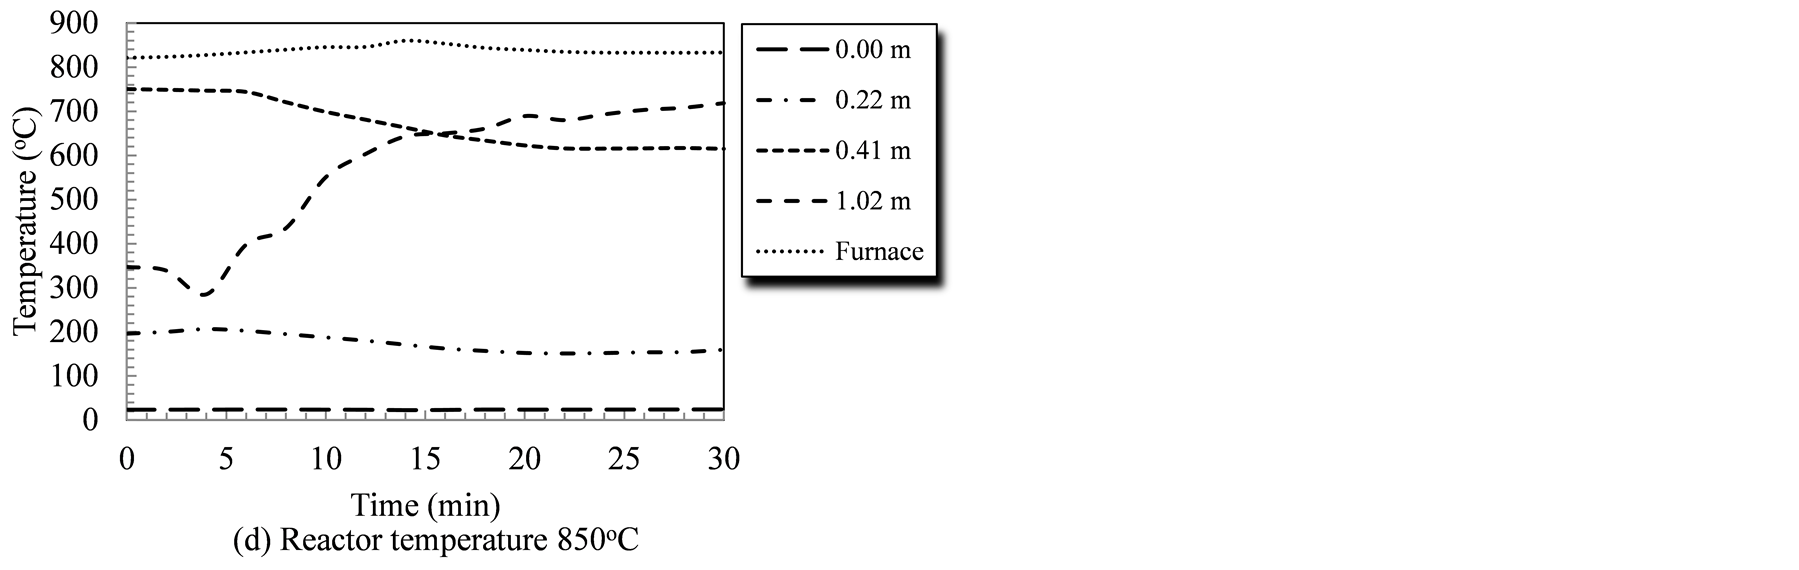
Figure 2. Temperature profiles in the auger reactor during gasification runs as affected by the reactor temperature and time.
biomass entry point) showed a decline that corresponded to the introduction of raw biomass/catalyst mixture. During the 700˚C test, the temperature at the 0.41 m-point dropped from 652˚C at the start to 548˚C during the last three minutes of the run (a 104˚C drop). Similarly, temperatures at this point (0.41 m) showed an average drop of 64˚C, 81˚C, and 135˚C corresponding to gasification tests of 750˚C, 800˚C and 850˚C, respectively. Given that the first stages of biomass thermochemical conversion are drying, and devolatilization stages; both of which are endothermic processes, this decline could be interpreted as the initiation of conversion. Conversely, temperatures downstream (1.02 m from entry point) showed a consistent increase under all gasification temperatures. The greatest increase in temperatures at that point, i.e., 1.02 m from the biomass entry was (371˚C) and it occurred during the 850˚C gasification run. Similar positive temperature trends were observed at the same point during the gasification runs at 700˚C, 750˚C, and 800˚C. The temperature rose by 234˚C, 158˚C, and 121˚C during these gasification runs, respectively. The increase in temperature, towards the reactor exit, is attributed to conduction heat transfer within the reactor body as well as the energy carried by the char and the producer gas while exiting the reactor. It was also noticeable that by extending the gasification test, the temperature readings at 0.41 m (in the heated zone) and at 1.02 m (out of the heated zone) stabilized.
3.2. Producer Gas Composition and Heating Value
Once the biomass is introduced to a gasifier and exposed to high temperature, it devolatilize to gases according to the following equation:
CNHMOL + Φ (N + 0.25 M – 0.5L) (O2 + 3.711N2) à aCO2 + bCO + dCH4 + eH2O + fH2 + gO2 + hN2 (1)
Where N, M, and L are the number of moles of carbon, hydrogen and nitrogen in the biomass; Φ is the actual air—fuel ratio to the stoichiometric air—fuel ratio; a, b, d, e, f, g, h, i, and j are the number of moles of CO2, CO, CH4, H2O, H2, O2, and N2, respectively. Char and tar are also produced as byproducts from the gasification process. The produced gases, char, and tar continue to react while moving towards the reactor exit. The most important gasification reactions include [27] :
Oxidation reaction
C + 1/2O2 = CO (−110.6 MJ∙kmol−1) (2)
Boudouard reaction
C + CO2 = 2CO (+172.6 MJ∙kmol−1) (3)
Water gas reaction
C + H2O = CO + H2 (+131.4 MJ∙kmol−1) (4)
Methanation reaction
C + 2H2 = CH4 (−74.9 MJ∙kmol−1) (5)
Combustion reaction
CO + 1/2O2 = CO2 (−251.0 MJ∙kmol−1) (6)
Figure 3 shows the effects of the reactor temperature on the composition of producer gas. As mentioned earlier, operational parameters except the temperature, i.e., the biomass feed rate, airflow rate and injection auger speed were maintained constant during the entire course of the experiments. Increasing the reactor temperature from 700˚C to 850˚C increased the volumetric molar fraction of H2, CO, and CH4 by 0.4% (from 1.1% to 1.5%), 8.8% (from 15.0% to 23.8%), and by 2.6% (from 5.1% to 7.7%), respectively. The increase in molar fractions of carbon monoxide is more pronounced than the molar fractions of hydrogen and methane. This is due to the effects of reactions 2, 3 and 4, which contribute to the CO production. The highest hydrogen concentration, 3.3%, was observed at the temperature level of 750˚C. The parabolic shape of the hydrogen molar fractions curve versus reactor temperature is an indication that the methanation reaction (5) started to take place at higher levels of temperature, i.e. 800˚C and above. The increase in the molar fractions of combustible gases; H2, CO and CH4; with the increase in reactor temperature is attributed to the increased devolatilization and reforming of volatilized species into permanent gases. On the other hand, CO2 and N2 molar fractions decreased from 19.7% to 15.9% and 58.2% to 50.1%, by the increase in the reactor temperature from 700˚C to 850˚C. Carbon dioxide molar fraction reached its lowest value of 14.0 at the reactor temperature of 800˚C. Increasing the reactor temperature to 850˚C increased CO2 molar fraction to 15.9% (a 1.9% increase). This slight increase in the carbon dioxide molar fraction could be attributed to combustion of CO as shown in reaction (5) or to the preliminary endothermic thermal decomposition process of dolomite (calcination), which takes place around 850˚C as reported by McIntosh et al. [28] :
CaMg(CO3)2 = CaCO + MgO + 2CO2 (7)
In order to assess the allothermal gasifier, the gas compositions reported earlier were compared with the gas compositions reported in earlier studies as shown in Table 2. Carbon monoxide, methane, and carbon dioxide

Figure 3. Producer gas composition as affected by the reactor temperature.
Table 2. Comparison of the producer gas from the current study (auger gasifier) and previous studies*.
*Auger Gasifier 1: Current study, Auger Gasifier 2: [25] , Updraft Gasifier: [29] , Downdraft Gasifier: [32] , Circulating Fluidized Bed 1: [30] , Circulating Fluidized Bed 2: [31] , and Bubbling Fluidized Bed: [33] .
molar fractions in the present study (15.0% - 23.8%, 5.1% - 7.7%, and 19.7% - 15.9%, respectively) were within range reported in other investigations. The hydrogen molar concentration, on the other hand, was noticeably lower than the reported values in previous studies (5.1% - 47.8%). This could be attributed to the fact that the steam reforming reaction (8), which is greatly endothermic, did not take place in the current study as compared to the listed once.
Steam reforming reaction
CH4 + H2O = CO + 3H2 (+260 MJ·kmol−1) (8)
Combustible gas compositions were used to calculate the higher heating value (HHV) of the producer gas. Each mole of hydrogen, carbon monoxide, and methane in the producer gas would add 0.268, 0.283, and 0.889 MJ, respectively to the producer gas heating value. Increasing the reactor temperature from 700˚C to 850˚C increased the producer gas heating value by 57.5% (from 4.0 to 6.3 MJ·m−3) as shown in Figure 4. The pronounced increase in HHV is due to the increase in the combustible gas molar fractions. Di Blasi [29] and LI [30] reported that the producer gas HHV was in the range of 4.7 - 5.6 MJ·m−3 while gasifying woody biomass in an updraft gasifier and a circulating fluidized bed. Conversely, Karmakar [31] reported that the HHV of the producer gas reached 12.2 MJ·m−3 during steam gasification of rice husk. The noticeable difference between the HHV reported by Karmakar and the one presented in the current study is due to the use of steam as a gasifying agent instead of air, which eliminated nitrogen from the producer gas composition.
3.3. Products Distribution
Despite, the main goal of gasification process is to maximize the quantity and quality of the producer gas, there are solids and liquids produced as byproducts of this process.
Biomass + limited air à Gas + char + tar (9)
Figure 5 shows the products; gas, solids and liquids distribution as affected by the reactor temperature. Both the char and the tar were collected and weighed after each test to determine their yields. The producer gas, on the other hand, was determined by subtracting the weight of the materials exiting from the system, liquids, and solids, from the weight of the feed rates of air and feedstock.
The graph exhibits that increasing the reactor temperature from 700˚C to 850˚C (150˚C increase) increased the gas production from 24.3% to 44.1%. This increase can be attributed to the increase in the devolatilization of biomass to gas. However, increasing the reactor temperature from 700˚C to 850˚C showed continuous increase in the gas yield, it showed a declining rate in gas production particularly at the highest levels tested. Demirbaş [34] reported that devolatilization of biomass constituents, starts at about 220˚C with hemicellulose decomposition first then cellulose, followed by lignin as the severity of the reaction increases. This might explain the increase in the producer gas production with the increase in the reactor temperature. The higher the reactor temperature, the higher the heat transfer rate from the reactor walls to the biomass. The higher heat transfer rate can be translated to faster devolatilization of the biomass to gas.
For better interpretation of the results, the gas production rates were normalized by dividing the gas production rate by the biomass feed rate to determine the specific gas production. The specific gas production rate (Figure 4) increased 82% (from 0.32 m3/kgbiomass to 0.58 m3/kgbiomass) with the increase in the reactor temperature from 700˚C to 850˚C. As compared to the specific gas production, i.e. 1.8 m3·kg−1biomass, reported in the literature [18] , the current study produced noticeably lower specific gas production. This is due to the expressively higher gasifier operating temperature range (1000˚C - 1450˚C) used during their experiments. Increasing the reactor temperature enhanced the volatilization process of biomass as well as the depolymerization process of tar. Both processes contributed to the production of more gaseous fuel per unit weight of biomass.

Figure 4. Producer gas heating value and specific gas production as affected by the reactor temperature.
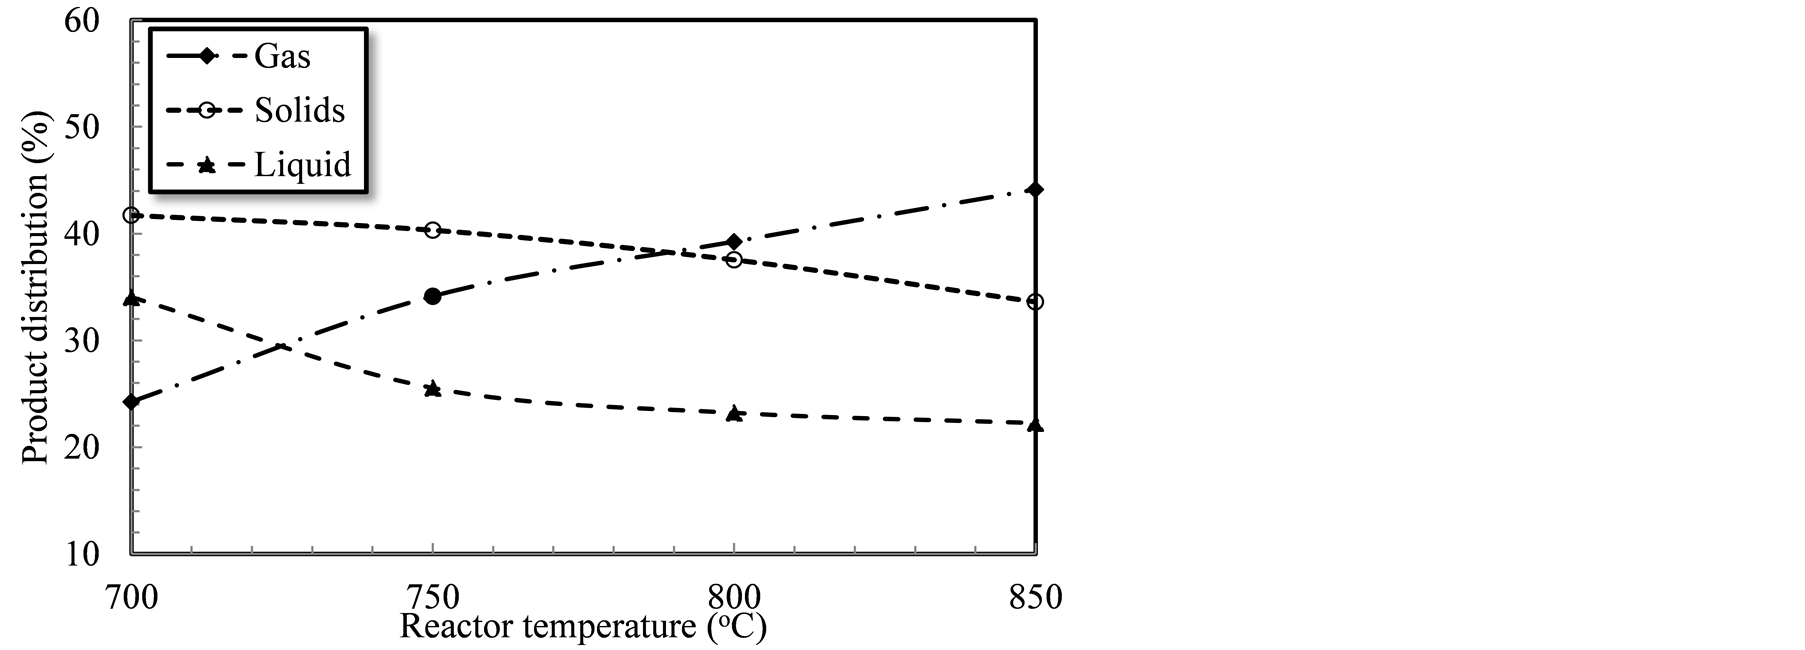
Figure 5. Gasification product distribution as affected by the reactor temperature.
It should be mentioned that the collected char in this study actually included both biochar and dolomite residues. Given that no measurements of the calcination extent were performed, no distinction will be made in the collected particulate between its constituents; biomass char, and dolomite (calcined or un-calcined). Rising the reactor temperature from 700˚C to 850˚C showed a decline in the particulate yield from 41.7% to 33.6%. The decrease in the solids production rate is due to the higher conversion of biomass to gas as the reactor temperature increased. Higher temperatures translate to increased reaction severity, and further decomposition of biomass particle.
By increasing the reactor temperature to 850˚C, the biomass temperature increased at a higher heating rate compared to 700˚C taking into account that biomass introduced to the reactor from room temperature under the same injection auger speed. Corrella et al. [12] also reported a decrease in the biochar yield with the increase in the gasifier temperature. The high biomass-heating rate allows more volatiles to escape from the biomass quickly in the form of volatiles and aerosols, which were carried out by gasifying agent and producer gas. This in turn reduced the solid production rate corresponding to higher temperature levels.
A composite sample of the produced particulate from each run was analyzed and the results are shown in Table 3. Increasing the reactor temperature from 700˚C to 850˚C decreased the particulate volatile solids content by 3.0%, fixed carbon by 8.9%, and increased the ash content by 11.9%. The value of the pH increased and reached its maximum of 12.6 at the temperature level of 850˚C. This property may allow the biochar to be used as a soil amendment that assists in acidic soils. The analysis performed on the particulates showed that the heating value of the biochar decreased by 14.4% as reactor temperature increased from 700˚C to 850˚C. This was a good indication of an increase in carbon conversion efficiency to gaseous and liquid products.
On the other hand, however, the high-energy content of the biochar revealed two main points. First, the conversion of the biomass to gas was incomplete. Second, the biochar can be mixed with the feedstock and recycled back into the gasifier to enhance the conversion efficiency. Therefore, in order to increase the biomass conversion, the auger system should be operated at lower speed or the reactor temperature should be increased.
The ultimate analysis performed on the biochar samples (Table 4) showed an increase in the carbon concentration and a decrease in the hydrogen and oxygen concentrations with increase in the reactor temperature. There was no clear trend of the effects of reactor temperature on the nitrogen and sulfur concentrations in the biochar.
The condensate; tar and water; collected in the four jars; were mixed and weighed. Increasing the reactor temperature from 700˚C to 850˚C resulted in a decrease of the liquid yield from 34.1% to 22.3%. The liquid production rate decreased due to the increase of the high molecular weight hydrocarbon conversion to gas at higher temperatures. Correspondingly, the higher temperature with the existence of dolomite may have en
Table 3. Biochar proximate analysis and higher heating value.
Table 4. Biochar ultimate analysis and chemical formulae.
hanced the decomposition of vapors and aerosols to gases, which, in turn, reduced the production rate of collected liquids. Liquids collected in the present study were significantly higher than that reported by Lysenko et al. [5] . They reported tar production rate of 25.6 g·kg−1biomass while gasifying switch grass in an air-blown fluidized bed gasifier. This observation may be due to the collection of both tar and water in the present study whereas the previous study reported tar only. In addition, the short residence time of the biomass in the heated section contributed to the production of these condensable tar and water. The short residence time concern could be handled by reducing the auger speed or increasing the length of the heated zone.
3.4. Carbon Sequestration in the Biochar
As mentioned earlier, aside from the production of gaseous fuel, soybean residues gasification produces biochar. Biochar soil application could potentially provide an ecological service by sequestering carbon in the soil thus creating a carbon sinks. Carbon sequestration from auger gasification of soybean residues showed that between 29% and 32% of the raw feedstock carbon could be returned back to the soil in the form of biochar carbon.
3.5. On-Farm Producer Gas Utilization: Case Study
Despite, the producer gas does not contain high calorific energy as compared to natural gas; it may hold the potential to be burnt on the farm for grain drying, i.e. soybean seeds. Therefore, the following scenario was created to determine the potential of converting soybean residues produced from 1 acre to dry soybeans produced from the same farm. The aforementioned results showed that the lowest observed producer gas contained 4.0 MJ·m−3. The specific gas yield was 0.32 m3·kg−1biomass. In other words, the lowest energy contained in the gas was 1.28 MJ·kg−1biomass. According to Lang [3] , the collectable soybean residues could reach 0.8 ton/acre. Hence, if only 50% of these residues were converted to producer gas using the previously mentioned technique, it would provide 512 MJ·acre−1.
The average USA soybean production in 2011 reached 1132 kg·acre−1 [35] . If the target is to reduce the moisture of soybean from 20% to 13%, the amount of excess moisture is 91.4 kg·acre−1. The energy required to evaporate water can be calculated using the following formula:
E = W × H (10)
Where: E is the total energy required, MJ, W is the amount of water to be removed, kg and H is the heat of vaporization, MJ·kg−1water.
Accordingly, the energy required to dry soybean seeds from 20% to 13% wet basis is equivalent to = 91.4 kg × 2.6 MJ·kg−1 = 237.6 MJ·acre−1. Comparing the available energy content in the producer gas and the energy required to dry soybean, showed that gasification would be sufficient to supply the energy necessary for soybean seeds drying. It should be mentioned that there is another benefit from this scenario. Soybean residues gasification would produce biochar that could be used as a soil amendment.
4. Conclusions
An allothermal auger gasifier capable of converting agricultural residues to gaseous fuels and biochar was installed and assessed. The performance of the auger gasifier system was evaluated based on the quality and quantity of the producer gas as well as the biochar characteristics. The results of the present study are summarized as follows:
• The developed allothermal gasification system could be used to gasify agricultural residues including soybean residues.
• At the reactor temperature of 850˚C, the molar fractions of CO and CH4 reached their highest values of 23.8% and 7.7%, respectively. On the other hand, H2 reached its highest molar fraction of 3.3% at the reactor temperature of 750˚C.
• The maximum specific gas production of 0.58 MJ·kg−1biomass, was achieved at the reactor temperature of 850˚C.
• The pH value of produced biochar reached alkaline levels under all tested reactor temperatures with the highest value of 12.6 at the reactor temperature of 850˚C.
• The producer gas from gasifying the soybean residues yielded from 1 acre could be to burnt to dry the freshly harvested soybean seeds from the same area from moisture content of 20% to 13%.
• Gasification of soybean residues; an underutilized feedstock, produced value added products which would serve towards sustainable agriculture by partially replacing a portion of on farm utilization of fossil fuel.
• Further modifications are needed to increase the system conversion efficiency.
5. Future Work
Modification of the auger gasification system might help increase the calorific value of the produced fuel gas. Therefore, the auger speed might be reduced to increase the solids residence time. The system could be operated on higher temperature levels above the 850˚C. The produced biochar could be mixed with the raw feedstock and recycled back to the gasifier.
Acknowledgements
The authors like to thank the US DOE and the USDA-NIFA for their funds numbers FG-08G088036 and 2010- 04269, respectively. The authors also like to thank the University of Arkansas—Division of Agriculture and the Rice Research and Extension Center for their continuous support. Additionally, they thank Andrew Wright for his help during the course of the gasification experiments.
References
- Loewer, O., Bridges, O.T. and Bucklin, R. (1994) On-Farm Drying Methods. On-Farm Drying and Storage Systems. American Society of Agricultural Engineers, 73-151.
- United States Department of Agriculture, National Agricultural Statistics Service (2013) Crop Production. http://www.usda.gov/nass/PUBS/TODAYRPT/crop1113.pdf
- Lang, B. (2002) Estimating the Nutrient Value in Corn and Soybean Stover. Fact Sheet BL-112, Iowa State University, University Extension. http://www.extension.iastate.edu/NR/rdonlyres/5D3BD06C-F585-413C-826B-8452EF7A22DB/4744/stovervalue.pdf
- Jankes, G., Trninic, M., Stamenic, M., Simonovic, T., Tanasic, N. and Labus, J. (2012) Biomass Gasification with CHP Production: A Review of the State-of-the-Art Technology and Near Future Perspectives. Thermal Science, 16, 115- 130. http://dx.doi.org/10.2298/TSCI120216066J
- Lysenko, S., Sadaka, S. and Brown. R. (2012) Comparison of Mass and Energy Balances of Air Blown and Thermally Ballasted Fluidized Bed Gasifiers. Biomass and Bioenergy, 45, 95-108. http://dx.doi.org/10.1016/j.biombioe.2012.05.018
- Spath, P. and Dayton, D. (2003) Preliminary Screening—Technical and Economic Assessment of Synthesis Gas to Fuels and Chemicals with Emphasis on the Potential for Biomass-Derived Syngas. Report No. NREL/TP-510-34929, National Renewable Energy Laboratory, Golden. http://www.osti.gov/bridge
- Datar, R., Shenkman, R., Cateni, B., Huhnke, R. and Lewis, R. (2004) Fermentation of Biomass-Generated Producer Gas to Ethanol. Biotechnology and Bioengineering, 86, 587-594. http://dx.doi.org/10.1002/bit.20071
- Klasson, K., Ackerson, M., Clause, E., and Gaddy, J. (1992) Bioconversion of Synthesis Gas into Liquid or Gaseous Fuels (Review). Enzyme and Microbial Technology, 14, 602-608. http://dx.doi.org/10.1016/0141-0229(92)90033-K
- Sharara, M., Clausen, E. and Carrier, D. (2012) An Overview of Biorefinery Technology. In: Bergeron, C., Carrier, J. and Ramaswamy, S., Eds., Biorefinery Co-Products: Phytochemicals, Primary Metabolites and Value-Added Biomass Processing, Wiley Publisher. http://dx.doi.org/10.1002/9780470976692.ch1
- Sadaka, S., Ghaly, A. and Sabbah, M. (2002) Two Phase Biomass Air-Steam Gasification Model for Fluidized Bed Reactors: Part I—Model Development. Biomass and Bioenergy, 22, 439-462. http://dx.doi.org/10.1016/S0961-9534(02)00023-5
- Gil, J., Caballero, M., Martin, J., Aznar, M. and Correla, J. (2009) Biomass Gasification with Air in a Fluidized Bed: Effects of the IN-Bed Use of Dolomite under Different Operatiion Conditions. Industrial & Engineering Chemistry Research, 38, 4226-4235. http://dx.doi.org/10.1021/ie980802r
- Corrella, J., Toledo, J. and Padilla, R. (2004) Olivin or Dolomite as In-Bed Additive in Biomass Gasification with Air in a Fluidized Bed: Which Is Better? Energy & Fuels, 18, 713-720. http://dx.doi.org/10.1021/ef0340918
- Zainal, Z., Rifau, A., Quadir, G. and Seetharamu, K. (2002) Experimental Investigation of a Downdraft Biomass Gasifier. Biomass and Bioenergy, 23, 283-289.
- Van der Drift, A., van Doorn, J. and Vermeulen, J. (2001) Ten Residual Biomass Fuels for Circulating Fluidized-Bed Gasification. Biomass and Bioenergy, 20, 45-56. http://dx.doi.org/10.1016/S0961-9534(00)00045-3
- van der Drift, A., Boerrigter, H., Coda, B., Cieplik, M. and Hemmes, K. (2004) Entrained Flow Gasification of Biomass—Ash Behavior, Feeding Issues and System Analyses. Energy Research Center of the Netherlands, Petten. http://www.ecn.nl/docs/library/report/2004/c04039.pdf
- Donatelli, A., Iovane, P. and Molino, A. (2010) High Energy Syngas Production by Waste Tyres Steam Gasification in a Rotary Kiln Pilot Plant. Experimental and Numerical Investigations. Fuel, 89, 2721-2728. http://dx.doi.org/10.1016/j.fuel.2010.03.040
- Campoy, M., Gomez-Barea, A., Vidal, F. and Ollero, P. (2009) Air Steam Gasification of Biomass in a Fluidised Bed: Process Optimization by Enriched Air. Fuel Processing Technology, 90, 677-685. http://dx.doi.org/10.1016/j.fuproc.2008.12.007
- Na, J., Park, S., Kim, Y., Jae, J. and Kim, H. (2003) Characteristics of Oxygen-Blown Gasification for Combustible Waste in a Fixed-Bed Gasifier. Applied Energy, 75, 275-285. http://dx.doi.org/10.1016/S0306-2619(03)00041-2
- Zhao, Y., Sun, S., Tian, H., Qian, J., Su, F. and Ling, F. (2009) Characteristics of Rice Husk Gasification in an Entrained Flow Reactor. Bioresource Technology, 100, 6040-6044. http://dx.doi.org/10.1016/j.biortech.2009.06.030
- Ingram, L., Mohan, D., Bricka, M., Steele, P., Strobel, D., Crocker, D., Mitchell, B., Mohammad, J., Cantrell, K. and Pittman, C. (2008) Pyrolysis of Wood and Bark in an Auger Reactor: Physical Properties and Chemical Analysis of the Produced Bio-Oils. Energy & Fuels, 22, 614-625. http://dx.doi.org/10.1021/ef700335k
- Thangalazhy-Gopakumar, S., Adhikari, S., Ravindran, H., Gupta, R., Fasina, O., Tu, M. and Fernando, S. (2010) Physiochemical Properties of Bio-Oil Produced at Various Temperatures from Pine Wood Using an Auger Reactor. Bioresource Technology, 101, 8389-8395. http://dx.doi.org/10.1016/j.biortech.2010.05.040
- Garcia-Perez, M., Adams, T., Goodrum, J., Geller, D. and Das, K. (2007) Production and Fuel Properties of Pine Chip Bio-oil/Biodiesel Blends. Energy & Fuels, 21, 2363-2372. http://dx.doi.org/10.1021/ef060533e
- Puy, N., Murillo, R., Navarro, M., López, J., Rieradevall, J., Fowler, G., Aranguren, I., García, T., Bartrolí, J. and Mastral, A. (2011) Valorisation of Forestry Waste by Pyrolysis in an Auger Reactor. Waste Management, 31, 1339-1349. http://dx.doi.org/10.1016/j.wasman.2011.01.020
- Brown, J. and Brown, R. (2011) Process Optimization of an Auger Pyrolyzer with Heat Carrier Using Response Surface Methodology. Bioresource Technology, 103, 405-414.
- Sadaka, S. (2013) Gasification of Raw and Torrefied Cotton Gin Wastes in an Auger System. Applied Engineering in Agriculture, 29, 405-414.
- ASTM Standard D5373 (2008) Standard Test Methods for Instrumental Determination of Carbon, Hydrogen, and Nitrogen in Laboratory Samples of Coal. ASTM International, West Conshohocken. http://dx.doi.org/10.1520/D5373-08
- Higman, C. and Van der Burgt, M. (2003) Gasification. Gulf Professional Publishing. Elsevier, New York.
- McIntosh, R., Sharp, J. and Wiburn, F. (1990) The Thermal Decomposition of Dolomite. Thermochemioca Acts, 165, 281-296. http://dx.doi.org/10.1016/0040-6031(90)80228-Q
- Blasi, C., Signorelli, G. and Portoricco, G. (1999) Countercurrent Fixed-Bed Gasification of Biomass at Laboratory Scale. Industrial & Engineering Chemistry Research, 38, 2571-2581. http://dx.doi.org/10.1021/ie980753i
- Li, X., Grace, J., Lim, C., Watkinson, A., Chen, H. and Kim, J. (2004) Biomass Gasification in a Circulating Fluidized Bed. Biomass and Bioenergy, 26, 171-193. http://dx.doi.org/10.1016/S0961-9534(03)00084-9
- Karmakar, M. and Datta, A. (2011) Generation of Hydrogen Rich Gas through Fluidized Bed Gasification of Biomass. Bioresource Technology, 102, 1907-1913. http://dx.doi.org/10.1016/j.biortech.2010.08.015
- Sheth, P. and Babu, B. (2009) Experimental Studies on Producer Gas Generation from Wood Waste in a Downdraft Biomass Gasifier. Bioresource Technology, 100, 3127-3133. http://dx.doi.org/10.1016/j.biortech.2009.01.024
- Narvaez, I., Orio, A., Aznar, M. and Corella, J. (1996) Biomass Gasification with Air in an Atmospheric Bubbling Fluidized Bed. Effect of Six Operational Variables on the Quality of the Produced Raw Gas. Industrial & Engineering Chemistry Research, 35, 2110-2120. http://dx.doi.org/10.1021/ie9507540
- Demirbaş, A. (2010) A Mechanisms of Liquefaction and Pyrolysis Reactions of Biomass. Energy Conversion and Management, 41, 633-646. http://dx.doi.org/10.1016/S0196-8904(99)00130-2
NOTES

*Corresponding author.