American Journal of Analytical Chemistry
Vol.06 No.09(2015), Article ID:58963,10 pages
10.4236/ajac.2015.69071
Spectroscopic Investigation of the Complex Formation of Niobium Using 2,6-Dithiolphenol and Aminophenols
Kerim A. Kuliyev, Nailya A. Verdizadeh
Department of Chemistry, Azerbaijan State Pedagogical University, Baku, Azerbaijan
Email: kerim.kuliev.69@mail.ru
Copyright © 2015 by authors and Scientific Research Publishing Inc.
This work is licensed under the Creative Commons Attribution International License (CC BY).
http://creativecommons.org/licenses/by/4.0/


Received 11 June 2015; accepted 18 August 2015; published 21 August 2015
ABSTRACT
A new, simple, precise, selective and sensitive method for the extraction and spectrophotometric determination of niobium has been described. Mixed-ligand complexes of Niobium (V) with 2,6-dithiolphenol (DTP) and aminophenols (AP) have been studied by spectrophotometry. Extraction of mixed-ligand complexes is maximal at pH 3.6 - 5.0. The optimal conditions for the formation and extraction of mixed-ligand compounds have been found. The molar ratio of the reacting species was 1:2:2 (Nb:DTP:AP). The Beer’s law was applicable in the range of 0.05 - 4.0 μg/ml. The method is free from common interferences. A procedure has been developed for extraction-spec- trophotometric determination of Niobium in steel.
Keywords:
Niobium, Solvent Extraction, Spectrophotometry, Mixed-Ligand Complexes

1. Introduction
Niobium and its compounds have a broad spectrum of applications. They are used for the fabrication of special materials for microelectronics and optics, superconductors, refractory materials, catalysts, and alloys [1] .
Spectrophotometric method remains one of the most popular among widely used methods in analytical practice. The simplicity of the experiment, which does not require expensive equipment, flexibility and sufficient accuracy of determination, makes the method cost-effective.
A great variety of photometric reagents is known for the determination of niobium. However, the studies aiming to find and investigate new photometric reagents with different functional groups are still going on. A method of flotation separation with subsequent sensitive spectrophotometric determination of niobium is developed. In the presence of oxalate, niobium and 3,5-dinitrocatechol form an anionic complex able to associate with Rhodamine B [2] .
The application of ternary and multicomponent complexes in spectrophotometric and spectrofluorimetric determination of trace elements is reviewed. Newer types of colour systems employing mixed ligand, surfactant sensitized, ion-association, flotation, derivative and FIA systems are described. Separate sections are devoted to advances in both spectrophotometric and spectrofluorimetric determination of individual elements. Future trends in spectrophotometric and spectrofluorimetric analysis are discussed [3] .
The chelator 2-[2-(5-bromoquinolinylazo)]-5-diethylaminophenol (5-Br-QADEAP) was synthesized. A method was developed for the simultaneous determination of vanadium, niobium and tantalum as metal―5-Br- QADEAP chelates using rapid column high performance liquid chromatography along with an on-line enrichment technique. Vanadium, niobium and tantalum were precolumn derivatized with 5-Br-QADEAP to form colored chelates [4] .
For determination of niobium recommended several methods based on the use of complexes of Nb(V) c TS and polyphenols (4-nitropyrocatehol, 2,3-dihydroxynaphthalene and pyrocatechol [5] .
The formation and solvent extraction of new ion-association complexes between anionic chelates of niobium (V) with nitroderivatives of catechol {NDC: 3,5-dinitrocatechol (3,5-DNC) and 4-nitrocatechol (4-NC)} and tetrazolium cations {2,3,5-triphenyl-2H-tetrazolium (TT+) and 3,3’-[3,3’-dimetoxy(1,1’-biphenyl)-4,4’-diyl]-bis [2,5-diphenyl-2Htetrazolium] (Blue Tetrazolium, BT2+)} were studied [6] .
The complex formation and liquid-liquid extraction in the niobium (V)-4-nitrocatechol (4-NC)―Thiazolyl Blue Tetrazolium (MTT)―water-organic solvent system was studied [7] .
Niobium was determined by flowing injection spectrophotometry at 393 nm after extraction of ethylene- bis(triphenylphosphonium) thiocyanatoniobate (V) into chloroform. The effects of diverse ions are reported. The system has been applied to the determination of niobium in steels by the method of standard additions [8] .
The colour reaction of niobium (V) with the four kinds of hydroxamic acids in the presence of thiocyanate was examined. The results showed that N-cinnamoyl-N-2,3-xylylhyd-roxylamine (CXHA) was the most suitable reagent for the spectrophotometric determination of small amounts of niobium [9] .
Color reactions of niobium with some heterocyclic azo reagents group PAN-PAR: 2-(2-pyridylazo)-5-ami- nophenol, 2-(3,5-dibromo-2-pyridylazo)-5-amino-phenol and 2-(3,5-dibromo-2-pyridylazo)-5-dietilaminophenol. The quantitative characteristics of the reactions were determined, and conditions were found for the determination of small and large amounts of niobium and tantalum in the presence of each other using the 3,5-dibromo- PADAP reagent [10] .
Investigated complex formation of niobium with 2,3,4-dihydroxyphenyl-azo 5-sulphonaphtaline in the presence of cetyltrimethylammonium bromide [11] .
It has a high sensitivity method for determination of niobium with sulfonitrofenole M. Among other reagents recommended for the determination of niobium, -sulfonitrazo E [12] azoderivatives 8-hydroxyquinoline [13] phenylfluorone, o-nitrofenilfluoron [14] -[16] . Very sensitive technique based on the formation of mixed complexes of niobium with o-nitrofenilfluoron and DAM [17] . Still higher sensitivity achieved using salitsilfluorona surfactant and SAS [18] [19] . Other organic reagents for determination of niobium include 8-hydroxyquinoline- 5-sulfonic acid [20] , 5,7-dichloro-8-hydroxyquinoline [21] 5-chloro-7-iodo-8-hydroxyquinoline [22] lyumogallion [23] and thioglycolic acid [24] .
An extractive spectrophotometric method is developed for the trace determination of niobium in acidic medium. A yellow (1:3) complex of niobium (V) is formed with 3-hydroxy-2-(4’-methoxyphenyl)-4-oxo-4H-1- benzopyran (HMPB) in perchloric acid medium [25] .
Hydroxyphenolate complexes of niobium are insoluble in chloroform, while mixed-ligand complexes with hydrophobic amines and aminophenols easily dissolve in various organic solvents [26] .
In this respect, a very promising reagent is 2,6-dithiolphenol (DTP), which contains one hydroxyl and two sulfohydryl groups and is a sulfur-containing analogue of mononuclear poly-phenols with two oxygen atoms replaced with sulfur atoms. The real work is devoted to studying of reaction of a complex formation of Niobium (V) with 2,6-dithiolphenol and aminophenols (АP). As aminophenols 2(N, N-dimethylaminomethyl)-4-me- thylphenol(АP1), 2(N, N-dimethy-laminomethyl)-4-chlorphenol (АP2), 2(N, N-dimethylaminomethyl)-4-brom- phenol(АP3) were used.
2. Experimental
2.1. Reagents and Apparatus
A stock Nb(V) solution (1 µg/ml) was prepared by dissolving 0.1430 g Nb2O5 with 4 g K2S2O7 in a quartz or platinum crucible. The melt is dissolved in a hot 5% solution of tartaric acid, cooled and diluted with a solution of tartaric acid to 100 ml in a volumetric flask. Working solutions were prepared by appropriate dilution of standard solution 2% solution of tartaric acid. The concentration of the niobium solution was adjusted gravimetrically [26] .
Solutions of DTP and AP in chloroform (0.01 M) were used. To create the optimal acidity, 1M solutions of NaOH and HCl were used. The extractant was purified chloroform.
The absorbance of the extracts was measured using a KFK-2 photocolorimeter (Zaqorskiy Optiko-Mexani- cheskiy Zavod) and an SF-26 spectrophotometer (“LOMO” (Leningradskoe Optiko-Mexanicheskoe Obedinenie); the equilibrium value of the pH of aqueous phase was measured using a I-120. 2 potentiometer (Medtechnica. Kharkov city. SP Med-technica. SAP) with a glass electrode. Muffle furnace was used for dissolution of the samples.
2.2. General Procedure
2.2.1. General Procedure for the Determination of Niobium (V)
Portions of stock solutions of Niobium (V) varying from 0.1 to 1.0 mL with a 0.1-mL step, a 2.5 mL portion of a 0.01 M solution of DTP, and a 2.0 mL portion of a 0.01M solution of AP were placed in to calibrated test tubes with ground-glass stoppers (the volume of the organic phase was 5 mL). The required value of pH was adjusted by adding 1 M HCl. The volume of the aqueous phase was increased to 20 mL using distilled water. In 15 minnute after the complete separation of the phases, the organic phase was separated from the aqueous phase and the absorbance of the extracts was measured on KFK-2 at room temperature and 440 nm (l = 0.5 cm) (Extract blank experiments colorless).
2.2.2. Determination of Niobium (V) in Steel
A weighed sample of 0.2 g was dissolved in 20 ml of H2SO4 (1:1) was oxidized with a few drops of concentrated nitric acid and evaporated twice lo vapor SO3. The precipitated salt was dissolved in 20 ml of 15% tartaric acid under heating, the solution was cooled, adjusted with water to 100 ml in a volumetric flask, stirred and filtered. An aliquot of 5 ml was put into a separatory funnel, was added 1 ml of 10% hydroxylamine solution, 1 ml of 3% ascorbic acid, and pH was adjusted to ca. 4 with NaOH and was determined niobium using the proposed procedures.
3. Results and Discussion
The present study is concerned with the investigation of Nb (V) interaction with 2,6-Dithiolphenol (DTP), rsulting in the formation o colored complexes insoluble in nonpolar sol-vents. Experiments on electromigration in a U-shaped tube and on sorption on EDE-10P (EDE―ethylenediamine, epichlorohydrin; 10―serial number of the brand: P―means that the matrix has a macroporous structure) anion exchangers have demonstrated the anionic nature of single-ligand complexes, in the electromigration study of the complexes, it was found that the blue-green dithiophenolate complexes of Niobium (V) moved to the cathode. When the sign of the charge of the single-ligand complexes was determined by ion chromatography, the EDE-10P anion exchanger completely absorbed the colored component of the solution. When hidrophob amins (Am) were introduced into the system, the extraction of these compounds into the organic phase as a mixed-ligand complex (MLC) was observed.
3.1. The Choice of the Extractant
The following organic solvents were tested in our experiments: chloroform, 1,2-dichloroethane, carbon tetrachloride, benzene, chlorobenzene, toluene, xylene, isobutanol, isopentanol, and diethyl ether. The extractivity of the complexes was estimated by the distribution coefficient and recovery. Chloroform, dichloroethane and chlorobenzene appeared to be the best extractants. All the further investigations were carried out with chloroform. The concentration of Niobium in the organic phase was determined with bromo-pyrogallol red [28] by photometric measurements after back extraction, while in the aqueous phase it was determined by the difference. The basicity of AP hardly influences the recovery of niobium. After a single extraction with chloroform, 98.2% - 98.8% of niobium was extracted as an ion associate.
3.2. Influence of the pH of the Aqueous Phase
The optimum pH for complex formation and extraction is 3.6 - 5.0. Hence further analytical investigations were carried out in media of pH 4. Extraction of Nb (V) enhanced with the increase in the acidity of the initial solution; the further increase in acidity lead to the gradual decrease of recovery, which was obviously associated with a decrease in the concentration of the ionized form of DTP. Probably, it is present in the solution in the non-dissociated state. At pH ≥ 7, the complexes were hardly extracted, obviously because of the decrease in the degree of Am protonation. The effect of pH on the intensity of the color reaction is shown in the Figure 1.
3.3. Influence of Reagent Concentration and Incubation Time
For the formation and extraction of MLC, a 10-15-fold excess of complexing reagents is required; for example, the optimal conditions for formation and extraction of these compounds are provided by 1.0 × 10⁻³ M DTP and 8.0 × 10⁻³ M AP. However it was found that the presence of excess of the reagent solution does not alter the absorbance of the color reaction (Figure 2).
Unlike single-ligand complexes, mixed-ligand complexes of Nb (V) with DTP and AP were stable in aqueous and organic solvents and did not decompose for two days, or over a month after extraction. The required duration of the phase contact was 10 min (Figure 3).
3.4. Electronic Absorption Spectra
The absorption spectrum of the complex indicates that the maximum lies in the range 435 - 440 nm where the reagent blank has minimal absorbance (Figure 4). The Komar-Tolmachev method [29] also allows calculating the true molar absorptivity of the complex: ε = (2.6 − 2.9) ×104 L∙mol−1∙cm−1.
3.5. Stoichiometry of the Complexes and the Mechanism of Complexation
The molar ratios between the components of the ternary complex were found by several methods: Starik-Bar- banel relative yield method [29] , straight line method [29] , equilibrium shift method [29] and crossed lines method [29] . The results suggest the complex composition of 1:2:2 (Nb:DTP:AP). The formation of MLC can be presented in the following way. When niobium ion interacts with two molecules of DTP, they form doubly- charged anionic complexes, which are extracted with two molecules of protonated Am (Figure 5). Formed ion-association complex between anionic chelates of niobium (V) with DTP and aminophenols.

Figure 1. Absorbance of mixed-ligand complexes as a function of the pH of the aqueous phase. CNb = 2.15 × 10⁻⁵ M. cDTP = 1.0 × 10⁻³ M, cAP = 8.0 × 10⁻⁴ M, KFK-2, 440 nm, l = 0.5 cm.

Figure 2. Influence of reagent concentration on the absorbance CNb = 2.15 × 10⁻⁵ M, KFK-2, 440 nm, l = 0.5 cm.

Figure 3. Influence of incubation time. CNb = 2.15 × 10⁻⁵ M. cDTP = 1.0 × 10⁻³ M, cAP1 = 8.0 × 10⁻⁴ M, KFK-2, 440 nm, l = 0.5 cm.

Figure 4. Absorption of mixed-lig and complexes. CNb = 2.15 × 10⁻⁵ M. cDTP = 1.0 × 10⁻³ M, cAP = 8.0 × 10⁻⁴ M, KFK-2, pH = 4, 440 nm, l = 0.5 cm.
It was found using the Nazarenko method that Nb(V) in the complexes was present in the form of . The number of protons replaced by niobium in one DTP molecule appeared to be 1 [30] [31] .
For evaluation of the stability of the complex we used the method of crossed lines [28] . The experiments were performed with constant Nb(V) and AP concentrations and two different DTP concentrations. The calculated value of the two-phase stability constant was log β = 8.2 − 8.4 (Figure 5).
The disappearance of the pronounced absorption bands in the 3200 - 3600 cm−1 with a maximum at 3460 sm−1 observed in the spectrum of DTP, says that the -OH group is involved in the formation of the complex. The observed decrease in the intensity, absorption bands in the area 2580 sm−1 shows that one of the -SH groups involved in the formation of coordination bond in the ionized state. Detection of the absorption bands at 2310 cm−1 indicates the presence of a protonated aminophenole [32] [33] .
Structure extractable complexes can be represented as in Figure 6.
Niobium (V) forms a yellow anionic chelate, [Nb(H2R)2]2− with dithiophenole (H3R) in acidic medium (pH 2 - 7). The colour of the anionic chelate intensifies when the compound is extracted to cloroform as an ion-asso- ciate, [Nb(H2R)2]] with a aminophenol (APH+) counter cation.
The suggested equations of complex formation and extraction, based on the mentioned molar ratios and data for the niobium state in рН 3 - 4.


Figure 5. Determination of the two phase stability constant by the crossed curves method. CNb = 2.15 × 10⁻⁵ M,  = 8 × 10⁻⁴ mol∙L−1, pH = 4. 1) CDTP = 2.4 × 10⁻⁴ mol∙L−1, Ccomp = 1.24 × 10⁻⁵ mol∙L−1; 2) CDTP = 4.48 × 10⁻⁴ mol∙L−1, Ccomp = 2.56 × 10⁻⁵ mol∙L−1.
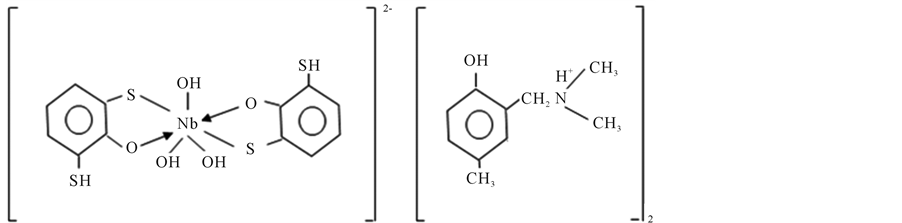
Figure 6. Structure of complex.
The stability constant is determined by crossed lines method. The sizes of equilibrium constant Ke calculated on a formula  were presented in Table 2.
Calculation of extent of polymerization of complexes was carried out on the equation [34] . The made calculations showed that MLC in an organic phase won’t be polymerized and are in a monomeric form (γ = 1.02 - 1.05).
3.6. Influence of Interfering Ions
To evaluate the complex applicability for photometric determination of niobium, we examined the influence of foreign ions and reagents. The results showed that great excesses of alkali, alkali earth, and rare earth elements, as well as ,
,  ,
,  and CH3COO− do not interfere determination of niobium with DTP and AP. Interference of most cations masked by the addition of complexone III. Tartrate masks the milligram quantities of Ta, Ti, W and Mo. Zr fluorides should mask, and copper-thiourea. The results are summarized in Table 1.

Table 1. Influence of interfering ions on the determination of niobium (V) as MLC with DTP and AP1 (30.0 µg Nb added).
3.7. Effect of Niobium (V) Concentration
The adherence to Beer’s law was studied by measuring the absorbance value of the series of solutions containing different concentrations of the metal ion. A linear calibration graph drawn between absorbance and the metal ion concentration indicates that Nb(V) may be determined in the range 0.05 - 4.0 μg/ml. The pertaining calibration graph is shown in the Figure 7.
In conclusion the analytical parameters pertaining to the proposed method are given in Table 2.

Figure 7. Analytical determination of Nb(V); CDTP = 1.0 × 10⁻³; CAP= 8 × 10⁻⁴ M; pH = 3; λ = 440 nm, l = 0.5 cm.
Table 2. Optical characteristics, precision and accuracy of the spectrophotometric determination of Nb(V) with DTP and Am.
The proposed method compares favourably with the existing ones (Table 3) and offers the advantages of better simplicity, rapidity, sensitivity and selectivity [28] .
3.8. Analytical Applications
The proposed method under the already established optimum conditions was applied for the determination of Nb(V) in steels of different brands. The results presented in Table 4 indicate the successful applicability of the proposed method to real sample analysis.
Table 3. Comparative characteristics of the procedures for determining niobium.
Table 4. Determination of Niobium in steel (n = 5, P = 0.95).
4. Conclusions
1) Mixed-ligand complexes of Niobium (V) with 2,6-dithiolphenol and aminophenols have been studied by spectrophotometry. Extraction of mixed ligand complexes is maximal at pH 3.6 - 5.0.
2) Nb(V) forms well chloroform-extractable ternary in association complexes with DTP and AP. The anionic part of the complexes ensures intensive yellow coloration, and the bulkiness of the cationic part, in its turn, guarantees their poor solubility in water.
3) In the optimum extraction conditions, niobium (V) forms a 1:2:2 complex with DTP and AP (suggested formula [Nb(OH)3(DTP)2] (APH)2).
4) A procedure has been developed for extraction-spectrophotometric determination of Niobium in steels of different brands.
Cite this paper
Kerim A.Kuliyev,Nailya A.Verdizadeh, (2015) Spectroscopic Investigation of the Complex Formation of Niobium Using 2,6-Dithiolphenol and Aminophenols. American Journal of Analytical Chemistry,06,746-756. doi: 10.4236/ajac.2015.69071
References
- 1. Gibalo, I.M. and Vinogradov, A.P., Ed. (1967) Analiticheskaya khimiya niobiya i tantala. Nauka, Moscow.
- 2. Lobinski, R. and Marczenko, Z. (1989) Sensitive Flotation-Spectrophotometric Determination of Niobium with Use of Oxalate, 3,5-Dinitrocatechol and Rhodamine B. Analytica Chimica Acta, 226, 281.
http://dx.doi.org/10.1016/S0003-2670(89)80010-8 - 3. Rao, T.P., Reddy, M.L.P. and Pillai, A.R. (1998) Application of Ternary and Multicomponent Complexes to Spectrophotometric and Spectrofluorimetric Analysis of Inorganics. Talanta, 46, 765-813.
http://dx.doi.org/10.1016/S0039-9140(97)00262-2 - 4. Li, G., Wei, Q., Hu, Q., Huang, Z. and Yang, G. (2007) Simultaneous Determination of Vanadium, Niobium and Tantalum by High-Performance Liquid Chromatography Equipped with On-Line Enrichment Using 2-[2-(5-Bromoquino- linylazo)]-5-diethylaminophenol as Precolumn Derivatization Reagent. Microchimica Acta, 158, 95-102.
http://dx.doi.org/10.1007/s00604-006-0667-x - 5. Gavazov, K.B., Dimitrov, A.N. and Lekova, V.D. (2007) The Use of Tetrazolium Salts in Inorganic Analysis. Russian Chemical Reviews, 76, 169-179.
http://dx.doi.org/10.1070/RC2007v076n02ABEH003655 - 6. Lekova, V., Racheva, P., Stojnova, K., Dimitrov, A. and Gavazov, K. (2010) Ternary Complexes of Niobium (V) with Nitroderivatives of Catechol and Tetrazolium Salts. Extraction-Spectro-Photometric Investigations. Сhemija, 21, 106-111.
- 7. Racheva, P., Lekova, V., Teodora, S., Dimitrov, A. and Gavazov, K. (2010) Complex Formation and Liquid-Liquid Extraction in the Niobium (V)-4-Nitrocatechol-thiazolylblue Tetrazolium System Plovdiv University. Paisii Hilendarski—Bulgaria Scientific Papers, 37, 33-41.
- 8. Thorburn Bums, D. and Pornsinlapatip, P. (2000) Flow Injection Extraction Spectrophotometric Determination of Niobium as the Ethylene Bis (Triphenyl Phosphonium) Thiocyanato-Niobate(V). Analytical Letters, 33, 1433-1440.
http://dx.doi.org/10.1080/00032710008543133 - 9. Inoue, S., Mishima, O., Zhang, Q.B., Minami, H. and Uto, M. (2001) Spectrophotometric Determination of Niobium (V) with N-Cinnamoyl-N-2,3-xylylhydroxylamine and Thiocyanate. Analytical Letters, 34, 2465-2475.
http://dx.doi.org/10.1081/AL-100107528 - 10. Dedkov Yu, M., Radugina, O.G. and Korsakova, N.V. (2003) Color Reactions of Niobium and Tantalum with Bromine-Substituted Reagents of the Par-Pan Group. Journal of Analytical Chemistry, 58, 836-840.
http://dx.doi.org/10.1023/A:1025681000238 - 11. Nagiev, K.D. (2004) Spectrophotometric Determination of Niobium and Tantalum with Joint Presence. Zhurnal Analiticheskoi Khimii, 59, 1033.
- 12. Elinson, S.V., Dedkov, Y.M. and Tsvetkova, V.T. (1976) Photometric and Differential Spectrophotometric Determination of Niobium with Sulphonitrazo III. The Journal of Analytical Chemistry, 31, 1372-1376.
- 13. Cámara-Rica, C., Gallego-Andreu, R. and Sanz-Medel, A. (1983) Spectrophotometric Study and Analytical Applications of the Ternary Complex Nb-Snazox-H2O2. Microchemical Journal, 28, 203-214.
http://dx.doi.org/10.1016/0026-265X(83)90053-X - 14. Nazarenko, V.A. and Yagnyatinskii, G.Y. (1972) The Study of the Conditions of Extraction-Photometric Determination of Niobium in the Form Trihydroxyfluoronat. Zavod Laboratory, 38, 1427-1430.
- 15. Nazarenko, V.A., Yagnyatinskii, G.Y. and Antonovich, V.P. (1974) Extraction-Photometric Determination of Niobium in Rosksdy Means of Trihydroxyfluoronat. The Journal of Analytical Chemistry, 29, 1977-1980.
- 16. Nukatsuka, I., Miura, T., Ohzeki, K. and Ishida, R. (1991) Collection of Niobium-Phenylfluorone Complex on a Membrane Filter for the Determination of Traces of Niobium by Solid-Phase Spectrophotometry. Analytica Chimica Acta, 248, 529-533.
http://dx.doi.org/10.1016/S0003-2670(00)84671-1 - 17. Ganago, L.I. and Bukhteeva, L.N. (1979) Study of Mixed-Ligand Complexes of Niobium with O-Nitrophenylfluorone and Diantipyrylmetane. The Journal of Analytical Chemistry, 34, 2186-2191.
- 18. Chernysheva, M.A., Golik, N.N., Malyutina, T.M., Antonovich, V.P. and Vinarova, L.I. (1987) Reactions between Niobium and Salisylfluorone in Presence of Surfactants and Masking Ligands. The Journal of Analytical Chemistry, 42, 1963-1968.
- 19. Wang, Z.Q., Li, J.J. and Shen, H.X. (1988) Criteria for Selecting Analytical Wavelengths for Multicomponent Mixtures by the CPA Matrix Method and Simultaneous Spectrophotometric Determination of Niobium and Tantalum. Analytica Chimica Acta, 212, 145-153.
http://dx.doi.org/10.1016/S0003-2670(00)84136-7 - 20. Alonso, J.I.G., Garcia, M.E.D. and Medel, A.S. (1984) The Surfactant-Sensitized Analytical Reaction of Niobium with 8-Hydroxyquinoline-5-sulphonic acid. Talanta, 31, 361-366.
http://dx.doi.org/10.1016/0039-9140(84)80097-1 - 21. Sanz-Medel, A. and Díaz García, M.E. (1981) Extractive Spectrophotometric Determination of Niobium in Pyrochlore-Bearing Rocks with 5,7-Dichloroquinolin-8-ol. Analyst, 106, 1268-1274. http://dx.doi.org/10.1039/an9810601268
- 22. Sharma, Y. (1982) A Sensitive Spectrophotometric Determination of Niobium(V) with the Reagent 5-Chloro-8-hydroxy-7-iodoquinoline. Microchimica Acta, 78, 297-303.
http://dx.doi.org/10.1007/BF01206932 - 23. Egorova, L.A., Gudzenko, L.V. and Timchenko, A.K. (1993) Spektrophotometric Determination of the Activating Additives in Lithium Fluoride Monocrystals. Zavodskaya Laboratoriya (Factory Laboratory), 59, 13-15.
- 24. Dutta, R.K. and Banerjee, S. (1974) Spectrophotometric Determination of Niobium and Its Application to Niobium-Stabilized Stainless Steel. Talanta, 21, 1091-1094.
http://dx.doi.org/10.1016/0039-9140(74)80139-6 - 25. Agnihotri, N. and Agnihotri, R. (2012) Extractive Spectrophotometric Determination of Niobium (V) Using 3-Hydroxy- 2-(4’-Methoxyphenyl)-4-Oxo-4H-l-Benzopyran as a Complexing Agent. The Open Analytical Chemistry Journal, 6, 39-44.
http://dx.doi.org/10.2174/1874065001206010039 - 26. Zalov, A.Z., Verdizade, N.A. and Jamalova, R.I. (2011) Extraction-Photometric Determination of Niobium (V) with 2-Hydroxy-5-bromthiophenol and Hydrophob Amines. Azerbaijan Chemical Journal, 97-102.
- 27. Korostelev, P.P. (1964) Preparation of Solutions for Chemical Analysis Works. Publishing House of Academy of Sciences of the USSR, Moscow.
- 28. Marczenko, Z. and Baltsejak, M.K. (2007) Metodi Spectrophotometrii v UF I vidimoy oblastyax (Spectrophotometrically in the UV and Visible Regions in Inorganic Analysis). BINOM. Laboratoriya Znaniy, Moscow, 711.
- 29. Bulatov, M.I. and Kalinkin, I.P. (1976) Practicheskoe rukovodstvo po photo-colorimetricheskim i spectrophotometricheskim metodam analysa, Leningrad.
- 30. Nazarenko, V.A. (1969) Tr. Komis. po analit. khimii Akad. Nauk SSSR (Proc. Commission Analytical Chemistry of the USSR’s Academy of Sciences). Nauka, Moscow, 22.
- 31. Nazarenko, V.A. and Biryuk, E.A. (1967) A Study of the Chemistry of Reactions of Multivalent Element Ions with Organic Reagents. Zhurnal Analiticheskoi Khimii, 22, 57-64.
- 32. Nakamoto, K. (1991) IK-Spectr KR neorqaniceskikh I koordinatsionnikh soedinenii (Infrared and Raman Spectra of Inorganic and Coordination Compounds). Mir, Moscow, 536.
- 33. Bellami, L. (1991) Infrakrasnie spectri slojnikh molecule (The Infra-Red Spectra of Complex Molecules). Mir, Moscow, 592.
- 34. Akhmedly, M.K., Kly’gin, A.E., Ivanova, L.I. and Bashirov, E.A. (1974) On the Chemistry of Interaction of Gallium Ions with a Number of Sulphophtaleins. Zhurnal Neorganicheskoi Khimii, 19, 2007-2012.