American Journal of Analytical Chemistry
Vol.06 No.08(2015), Article ID:58015,17 pages
10.4236/ajac.2015.68064
Product Analysis of Supercritical Fischer-Tropsch Synthesis: Utilizing a Unique On-Line and Off-Line Gas Chromatographs Setup in a Bench-Scale Reactor Unit
Amro Kasht, Rehan Hussain, Minhaj Ghouri, Jan Blank, Nimir O. Elbashir*
Chemical Engineering Program & Petroleum Engineering Program, Texas A & M University at Qatar, Doha, Qatar
Email: *nelbashir@tamu.edu
Copyright © 2015 by authors and Scientific Research Publishing Inc.
This work is licensed under the Creative Commons Attribution International License (CC BY).
http://creativecommons.org/licenses/by/4.0/


Received 26 March 2015; accepted 13 July 2015; published 16 July 2015
ABSTRACT
The utilization of supercritical fluids (SCF) in the Fischer-Tropsch Synthesis (FTS) further complicates the hydrocarbon products identification and analysis process due to the dilution of hydrocarbon peaks by the predominant solvent peak. Therefore, in this project, a custom-made Gas Chromatography (GC) analysis system was designed and implemented to identify and quantify SCF-FTS products. The FTS products were identified using two different methods. The first was through retention time matching by injecting standard solutions, and the second was through the use of the GC/MS system. The quantification of CO and CH4 was achieved by using external standards, where the CO conversion was calculated by relating the peak area of CO to the peak area of an internal standard (argon) while the CH4 selectivity was calculated by relating the peak area of CH4 to that of CO. After setting and calibrating the GC system, two reaction conditions (gas phase: 240˚C, 20 bar syngas with 2:1 H2:CO molar feed ratio and for the supercritical fluids FTS (SCF-FTS): 240˚C, 65 bar with 20 bar syngas partial pressure and 2:1 H2:CO molar feed ratio) were used to compare the different FTS reaction media. The comparison between the gas phase FTS and the SCF-FTS showed the following: carbon monoxide conversion was improved by 14% in the SCF-FTS, while the hydrocarbon product profile SCF-FTS showed 78% reduction in light hydrocarbons (C1 - C4) products, 35% increase in middle distillates (C11 - C22) products compared to gas phase FTS. These improvements have resulted in higher chain growth probability for the SCF-FTS (α = 0.85) compared to the gas phase FTS (α = 0.76). These results are generally in agreement with previously reported enhancement in the SCF-FTS [1] .
Keywords:
Supercritical Fluids, Fischer-Trospch Synthesis, Gas Chromatography, Mass Spectrometry

1. Introduction
Escalating concerns about the unstable oil prices and oil supply insecurity coupled with stricter environmental regulations have catalyzed the interest in the production of synthetic fuels from alternative resources such as natural gas, coal and biomass via the X-to-Liquid (XTL) process or other process. The Fischer-Tropsch synthesis (FTS) is considered as the heart of the XTL process [2] as it is responsible of converting syngas, a mixture of carbon monoxide (CO) and hydrogen (H2), into various hydrocarbons that could be refined into environmentally ultra-clean liquid fuels and value added chemicals [3] [4] . The FTS is a surface catalyzed process (heterogeneous catalytic reaction) in which syngas reacts on an active catalyst site; usually cobalt (Co) or iron (Fe) producing longer chain gaseous, liquid and solid (wax) hydrocarbons composed mainly of n-paraffins, α-olefins, isomers, alkenes and oxygenates [5] -[8] .
A forethought towards the desired product selectivity is an extremely important criterion in the design of FTS processes from an economic feasibility point of view. Fixed bed and slurry bubble reactors are the two main reactor types used in industrial Low-Temperature-Fischer-Tropsch (LTFT) [9] . The main drawbacks of fixed bed reactors are the non-uniform temperature distribution along the catalyst bed (axial temperature gradient) and the local hot spots formation that can cause thermal runaway, catalyst deactivation or sintering and rise in CH4 formation [10] [11] . Slurry reactors were designed to overcome the temperature control issue facing fixed bed reactors, as they operate almost isothermally due to the enhanced heat capacity of the liquid medium (slurry). However, the introduction of the liquid reaction medium induces mass transfer limitations [11] . Therefore, slurry reactors suffer from low conversion rate per pass since the diffusion of syngas in the catalyst pores is slow due to the presence of heavy slurry that fills the catalyst pores [12] [13] . Additionally, catalyst attrition and cumbersome extraction of catalyst from the slurry are also major drawbacks [14] . Consequently, selecting a reactor technology for the FTS is a trade-off since each reactor type and medium has their strengths and weaknesses [15] . Therefore, it makes sense that the idealistic FTS reactor should combine the advantages of commercial FTS reactors while simultaneously eliminates their disadvantages. Such a combination was found possible to some extent through the application of supercritical fluids (SCF) as a FTS reaction media [11] [16] . SCF reaction media was reported to have unique characteristics offering single-phase operation and combined the desired properties of the gas phase (high diffusion) and the liquid phase (high solubility and high heat transfer) [1] . The liquid-like densities and heat transfer properties ensure efficient product desorption and heat removal while gas-like diffusivities ensure high reaction rates and high product removal rate [17] .
The analysis and identification of FTS products is quite a cumbersome process since it begins with simple molecules (H2 and CO) and ends up with hundreds of molecules that can be normal paraffins, isomers, olefins and oxygenates. The introduction of supercritical solvents to the FTS feed stream further complicates the FTS product analysis process due to the dilution of products with the solvent. This dilution results in a large solvent peak that may absorb nearby product peaks and simultaneously result in relatively small hydrocarbons peaks. The groundbreaking study that investigated the application of SCF in the FTS was carried out by Yokota and Fujimoto in 1989 [18] . In their study, they used several on-line Gas Chromatographs (GCs). The first GC had an activated charcoal column and a Thermal Conductivity Detector (TCD) for analyzing CO, CH4 and CO2. The second GC utilized a Propak-Q column with a Flame Ionization Detector (FID) to analyze light hydrocarbons. The third GC used two columns (Silicone SE-30 and Dexil-300) with a FID to analyze the hydrocarbons dissolved in the solvent [19] . Dictor and Bell [20] used a single GC with a packed column for the analysis of permanent gases and C1 - C5 hydrocarbons. In addition, a capillary column was used for the analysis of C1 - C30+ hydrocarbons. Snavely and Subramaniam [21] also used a single GC similar to that of Dictor and Bell. However, they incorporated a number of modifications from the work of Hackett and Gibbon [22] and Nijs and Jacobs [23] such as the use of a hot trap for the removal of heavy hydrocarbons (wax) before the on-line GC and injecting argon as internal standard for conversion calculations. Furthermore, they have utilized improved capillary and packed columns resulting in better product resolution. Elbashir et al. [24] used two GCs for activity and selectivity calculations. The first GC utilized a capillary column and a FID detector for the analysis of C2 - C40 hydrocarbons while the second GC utilized a packed column and a TCD for analyzing permanent gases (CO, CO2, H2, CH4, C2H6, C2H4 and N2). In this project, a custom-made analysis system capable of characterizing gaseous and liquid FTS reactor effluent products was applied. This custom-made GC setup has been designed with the support of Shimadzu. The analysis system provided reliable activity and product distribution data that enabled the validation and study of Supercritical-Fluid-Fischer-Trospch-Synthesis (SCF-FTS). Gaseous FTS products (C1 - C6) and permanent gases were analyzed on-line using two GCs in series with TCD and FID while liquid hydrocarbons (C7 - C32) were analyzed off-line using a Gas Chromatography/Mass Spectroscopy (GC/MS) system.
2. Methodology
2.1. Catalyst and Reactor Bed
The FTS reported in this work was carried out under both conventional gas phase and non-conventional supercritical and near supercritical phase utilizing the newly commissioned bench-scale novel high-pressure fixed bed reactor unit. The reactions were performed over a cobalt catalyst supported on alumina (15 wt% Co/Al2O3) that was prepared using the impregnation technique, and then calcined and reduced under hydrogen flow at elevated temperatures. For the gas phase FTS, the reaction was carried out at 240˚C, 20 bar syngas with 2:1 H2:CO molar feed ratio. As for the SCF-FTS, the reaction was carried out at 240˚C, 65 bar with 20 bar syngas partial pressure and 2:1 H2:CO molar feed ratio. These conditions were selected to provide the basis for comparing the two reaction media. Each experimental set was allowed to reach steady state conditions in terms of activity (CO conversion) and selectivity (hydrocarbon product distribution), as measured by the on-line GC setup. After reaching steady state, liquid samples were collected for off-line analysis.
The cobalt catalyst supported on alumina (15 wt% Co/Al2O3) used for the FTS reactions was prepared using the impregnation technique. Firstly, the alumina support (surface area 255 m2/g, median pore 70 micron and 5000 Å, total pore volume 1.14 cm3/g, packing density 0.395 kg/L) was crushed, sieved (75 - 150) μm, washed with deionized water and then calcined under airflow at 700˚C. Secondly, an aqueous 2 molar cobalt solution was prepared by dissolving cobalt nitrate precursor (Co(NO3)2∙6H2O) in deionized water while stirring at room temperature. Then, the cobalt solution was gradually added to the treated support under constant stirring to avoid lumps formation. Afterwards, the formed catalyst paste was dried, crushed and sieved (150 - 250) µm. Thirdly, the obtained catalyst powder was calcined in a rotary oven under airflow and temperature ramp up to 350˚C. Then, the calcined catalyst was diluted with quartz sand by vigorously mixing the catalyst and quartz to assure homogenous catalyst distribution. Finally, different catalyst loadings were added into the reactor tube on top of a layer of glass wool and quartz.
The high-pressure bench-scale reactor unit used in this project consists primarily of five sections (Figure 1). The first section involves the feed delivery setup for gas stream (e.g. syngs, CO, H2 and argon) and liquid stream (e.g. solvent hexane). The second section is the reaction zone where the FTS reaction takes place. The third section utilizes two separation columns (hot trap and cold trap) to separate permanent gases, liquid hydrocarbons and wax. The fourth section is composed of the reactants and products on-line GC analysis system. The fifth section, which is the utility section, is composed of three sub-sections: 1) pneumatic air, 2) chilled water system and 3) ventilation setup.
At the feed delivery section syngas (33.4% CO and 66.6 H2), carbon monoxide (99.97% CO), hydrogen (99.999% H2) and argon (99.999% Ar) were introduced into the system at controlled flow rates (0 - 500 nmL/min) using four mass flow controllers (MFCs). For the supercritical phase testing, liquid solvent, n-hexane (98.5% n-hexane) was introduced at controlled volumetric flow rates using a High Pressure Liquid Chromatography (HPLC) pump. A feed purification system composed of a cylindrical vessel filled with three layers of adsorbers/catalysts (BASF Selexsorb COS, BASF PuriStar R3-15 and BASF E-315) and an inline gas filter were employed at the solvent stream and at each gas stream for the removal of COS, H2S, CS2, CO2, acetylene, O2, arsine, sulfur compounds, moisture and particulates. The liquid solvent is then passed through a vaporizer before it is mixed with the feed gases in the static mixer that ensure proper mixing of the feed gases and the SCF.
The reaction mixture then enters the custom made tubular fixed bed reactor (Autoclave Engineers, 16" overall length, 12" heated length, 2/3" internal diameter, 1.0" outer diameter, 73 cm3 net volume in heated zone). The reactor tube was vertically embedded in a hollow ceramic insulated electric furnace with three heating zones that allow reactor temperature control within ±2.0˚C. The pressure control valve located between the reactor and the

Figure 1. Process Flow Diagram (PFD) of the high-pressure reactor unit. (1) Syngas cylinder, (2) Hydrogen cylinder, (3) Carbon monoxide cylinder, (4) Argon cylinder, (5) Solvent storage tank, (6 a-e) Feed purification system, (7 a-d) Inline filter, (8 a-d) Mass flow controllers, (9) Solvent pump, (10) Vaporizer, (11) Static mixer, (12) Fixed bed reactor, (13) Pressure control valve, (14) Hot trap, (15) Wax collection vessel, (16) GC injection valve, (17) Cold trap, (18) Level control valve, (19) Product collection tank, (20) On-line GC analysis system, (21) Flow meter.
hot trap controlled the reactor pressure.
Two flash separation columns were placed downstream of the high-pressure reactor. The first one is the hot trap surrounded by a heating tape and insulated by glass wool and aluminum foil. The hot trap is operated at 150˚C and 0.9 barg to facilitate the condensation of heavy hydrocarbons (wax) prior to the on-line GC system. The formed wax is collected in a special pressure vessel for future analysis. All the lines connecting the reactor with the hot trap, the wax collection vessel and the on-line GC were heated to 150˚C to prevent any wax condensation.
The remaining hot trap gas stream goes towards the cold trap used to separate liquid hydrocarbons and permanent gases. The cold trap is internally cooled using cooling coils with chilled water flow at 4.0˚C. Hydrocarbons and water condensed by the cold trap were collected in a tank and liquid samples were periodically collected for off-line GC analysis.
In a typical experimental run, the system was first flushed with n-hexane and then purged with nitrogen. Secondly, the catalyst was activated in-situ under hydrogen flow (100 - 350 nmL/min) at a temperature range between 180˚C to 350˚C. Thirdly, the system was purged and flushed again. Fourthly, the solvent was introduced (2.43 - 2.74 nmL/min) and the reactor pressure (20 - 80 bar) and temperature (230˚C - 240˚C) were slowly ramped to their desired set points. After the temperature and pressure had been stabilized syngas was allowed (50 - 150 nmL/min) at the desired flow rate. Each experimental set was allowed to reach steady state conditions in terms of conversion and product distribution, as indicated by the on-line GC. After reaching steady state, wax and liquid samples were collected for further off-line analysis.
2.2. Gas Chromatography Setup
A fraction of the gases leaving from the top of the hot trap is directed towards the on-line GC system through an air actuated 8 way selecting valve that is used to inject samples at specified intervals. Operation of the sampling valves was controlled by a custom-made Shimadzu GC Postrun software that acquires samples at preset times and record TCD and FID data. This system has been designed to ensure that the same sample to be injected simultaneously to two combined GCs with three detectors. This unique on-line analytical system consists of dual gas chromatographs with three detectors, TCD-1, FID and TCD-2 (Figure 2). TCD-1 detector analyzes permanent gases (O2, N2, CH4, CO, CO2, C2 and H2S) by utilizing two GC columns. Both columns use helium as a carrier

Figure 2. Process Flow Diagram (PFD) of the custom made Shimadzu on-line GC analysis system. (1) Restek Molesieve 13X packed column, (2) Restek Molesieve 5A packed column, (3) Restek Rtx-1 capillary column, (4) Restek Porapak Q packed column, (5) TCD-1, (6) FID, (7) TCD-2.
gas at 5.0 mL/min and 4.0 bar. The FID detector analyzes (C3 - C13) hydrocarbons by utilizing a single fused silica capillary column to separate the hydrocarbons. The capillary column also uses helium as a carrier gas at 5.0 mL/min and 4.0 bar, while air (350 mL/min, 4.0 bar) and H2 (35 mL/min, 4.0 bar) were used to light the detector flame and N2 as makeup gas at 25 mL/min and 4.0 bar. Hydrocarbon products heavier than C15 were not detected by the on-line FID. One more detector TCD-2 is used with a single packed column to detect H2, where in this column N2 was used as a carrier gas at 25 mL/min and 4.0 bar.
Liquid products from the cold trap are periodically collected for off-line analysis using GC/MS system equipped with FID and Mass Spectroscopy (MS) that uses a capillary column to separate (C5 - C30) hydrocarbons. The column uses helium as carrier gas at 5.0 nmL/min and 4.0 bar, air at 350 nmL/min and 4.0 bar, and H2 at 35 nmL/min and 4.0 bar to light the FID flame and N2 as makeup gas at 25 nmL/min and 4.0 bar.
2.3. Activity, Selectivity and Product Distribution Calculations
The CO inlet flow rate to the FTS reactor was measured and controlled by the MFC; however, CO participates in the FTS reaction, and thus its outlet flow rate cannot be known directly. In order to be able to calculate the outlet CO flow rate, it was necessary to use an inert (argon) as an internal standard. The method adopted herein is similar to that previously used by Nijs and Jacobs [23] . Argon does not participate in the FTS reaction, and thus its inlet and outlet flow rates are equal under steady-state conditions. Hence, it can be used to calibrate the outlet CO flow rate by relating the CO peak area/Ar peak area ratio (found using on-line GC TCD channel 2) to CO flow rate. The trend line (straight-line equation) of the peak area ratio (PACO/PAAr) against the CO flow rate can then be used to calculate the CO outlet flow rate as follows:
 (1)
(1)
where QCO,out is the outlet flow rate of CO, “a” is the slope and “b” is the intercept. For example, syngas with H2:CO of 2:1 (CO is 1/3 of syngas flow) was allowed into the system at different flow rates (10 - 200) nmL/min. Argon was allowed at constant flow rate (10 or 15) nmL/min. The resulting gas mixture was then directed toward the on-line GC/TCD, where CO and Ar peak areas were determined. CO and Ar peak ratio (PACO/PAAr) was then calculated and plotted against CO flow rate. Figure 3 shows the calibration line for argon flow rate of 15 nmL/min. The resulting straight line equation (y = 0.0548x − 0.0264), where y = PACO/PAAr and x = QCO,Out can be rearranged to find the outlet CO flow rate as follows:
 (2)
(2)
The material balance calculation was based on carbon, where the amount of carbon (as CO) entering the reactor is equal to the amount of carbon (as unreacted CO and produced hydrocarbons) leaving it. Therefore, the CO consumption rate and conversion throughout the experimental run were calculated based on the difference between moles of CO entering the reactor and moles of unreacted CO leaving the reactor as shown in Equation (3)
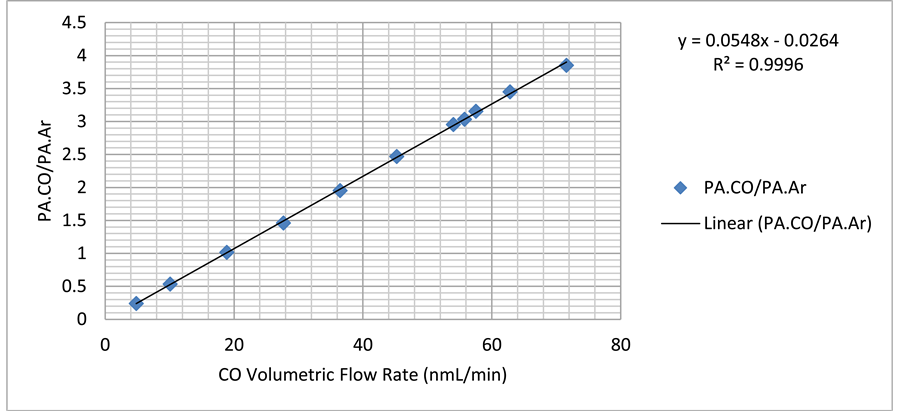
Figure 3. CO/Ar calibration curve at 15 nmL/min Ar flow rate, used to calculate outlet CO flow rate.
and Equation (4). Note that syngas H2:CO ratio of 2:1 was normally used unless CO, H2 were introduced separately.
 (3)
(3)
 (4)
(4)
where xCO is the consumption rate of CO and XCO is the conversion percent of CO.
In order to calculate the CH4 outlet flow rate, a calibration gas with 10.09 CO mol∙% and 4.00 CH4 mol∙% ( molar ratio = 0.397) was used to find the responding peak area for each component and relate CO flow rate to CH4 flow rate. The peak areas for CO and CH4 for the aforementioned concentrations were identified by the on-line GC-TCD and the CH4/CO peak area ratio
  is measured as 0.331. After that, the molar ratio and peak area ratio were used to calculate CH4 outlet flow (CH4 formation rate) as follows:
 (5)
(5)
CH4 selectivity was then calculated as follows:
 (6)
(6)
where  is the selectivity towards methane.
The hydrocarbon product distribution was determined utilizing the on-line and off-line FID GC setups. The hydrocarbon formation rate (g/gcat∙h) was calculated as the sum of formation rate of all species (isomers, normal paraffins, olefins, alcohols) with “n” carbon number. Then, the normalized weight percentages (Wn) of each carbon number was calculated from the ratio of the hydrocarbon formation rate of carbon number “n” to the total weight of hydrocarbons formed as detected by the FID.
It was difficult to determine the exact amount of C6 hydrocarbons produced when running the FTS reaction under near and supercritical conditions since large quantities of n-hexane were present in the feed. This resulted in a very large n-hexane peak absorbing nearby peaks within the C6 range. Thus, calculating the formation rate of C6 hydrocarbons was impractical. Hence, the hydrocarbons within the C6 product range were eliminated from the product distribution and were not included in the Anderson-Schulz-Flory (ASF) calculations. Additionally, for consistency purposes, C6 hydrocarbons were also eliminated in the gas phase FTS when comparing the performance under the two reaction mediums.
To start the hydrocarbon product distribution calculations, a reference or starting point was needed. For the on-line GC, this was the CH4 formation rate (g/gcat∙h), previously determined using the GC TCD. The TCD CH4 formation rate with the CH4 peak area given by the FID was used as a reference ratio and held constant for each sample. The ratio was then used to calculate the formation rate of hydrocarbons with different carbon numbers. This method is similar to that previously used by Snavely and Subramaniam [21] . As for the off-line GC FID analysis, a similar approach was used, however the CH4 formation rate was replaced with n-C7 formation rate (g/gcat∙h), determined using the on-line FID, and the on-line n-C7 formation rate with the off-line n-C7 peak area was used as a reference ratio in this case.
As discussed below in section 3.1, each hydrocarbon present in the FID spectrum was identified and assigned with its distinct carbon number and type (isomer, normal, olefin, alcohol). After that, the peak area for each carbon number with the same type was summed, and then the total peak area for each carbon number was summed. The weighted molecular weight for each carbon number (n) was then estimated as follows:
 (7)
(7)
The total hydrocarbon formation rate for each carbon number (n), was then calculated as follows:
 (8)
(8)
where FHC is the hydrocarbon formation rate.  is the methane formation rate estimated by the on- line TCD,
  is the peak are of methane given by the on-line FID.
The weight fraction of hydrocarbons containing “n” carbon atoms (Wn) was then calculated as follows:
 (9)
(9)
where FHC,n is the hydrocarbon formation rate for “n” carbon number.
The natural logarithm of the weight fraction of carbon number “n” over the carbon number [ln(Wn/n)] was calculated in order to plot the ASF distribution, where [ln(Wn/n)] was plotted against “n”. The slope of the trend line can then be used to find the chain growth probability as follows:
 (10)
(10)
where ln(α) is the slope of the trend line and the chain growth probability is equal to the exponential of the slope (α = eslope).
3. Results and Discussion
3.1. Hydrocarbons Product Identification
The exact and detailed identification of FTS products can be hindered by the large number of compounds involved [21] . One method for identifying FTS products is to use standard solutions that contain FTS products (n-paraffins, α-olefins, β-olefins, branched and oxygenates of C1 - C34) to obtain a satisfactory GC calibration. This is a far too complex and cumbersome process; thus a GC/MS analyzer was used for compound identification in the range of C5 - C34.
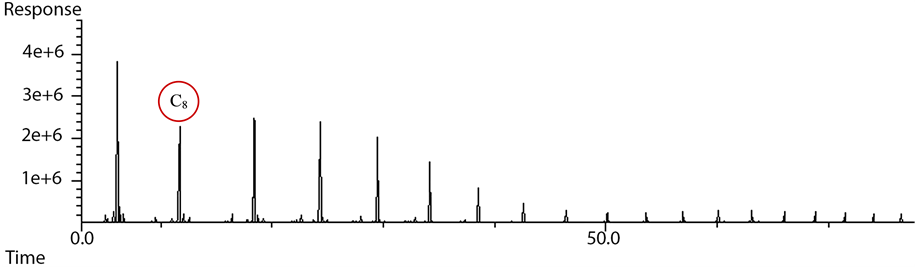
The FTS products under both conventional gas phase and supercritical phase were found to be qualitatively similar (but not quantitatively, as will be discussed later). The main difference between the GC product distributions under the two reaction mediums is the dilution of the FTS products in the SCF-FTS, as illustrated and compared in Figure 4 and Figure 5. This dilution complicates the identification process since hydrocarbons have a smaller relative peak area and are more difficult to detect when the solvent/syngas ratio is increased. Thus, gas phase FTS samples were primarily used for the product identification and then the product identification was validated for the SCF-FTS samples and found to be in good agreement.
For the identification of C1 - C4 hydrocarbons and permanent gases (CO, CO2, H2, Ar) a number of standard gas mixtures with known molar percentages were used. The standard gas mixtures included common FTS products within the (C1 - C4) range. These hydrocarbons include methane, ethylene, ethane, propylene, propane, 1-butene, n-butane, iso-butane, butylene, butane, as well as H2 and CO2. In addition, different solutions containing known concentrations of (C1 - C6) normal alcohols (methanol, ethanol, propanol, butanol, pentanol and hexanol) were injected into the on-line GC for identifying the alcohol peaks. After that, a calibration table was prepared by entering the retention time for each identified species into the GC data collection software. The identification of permanent gases is shown in Figure 6 and sample peak identification for C4 hydrocarbon group with species fingerprints is shown in Figure 7. As illustrated in Figure 6, for the TCD 1 signal (channel 2), helium was used as the carrier gas. Thus, any gas slower than C2 was back-flushed. The peak order obtained from the detector as shown in Figure 6 started with H2 (small peak), Argon and O2 (they do not separate), N2, CH4, CO, ethylene, ethane and CO2.
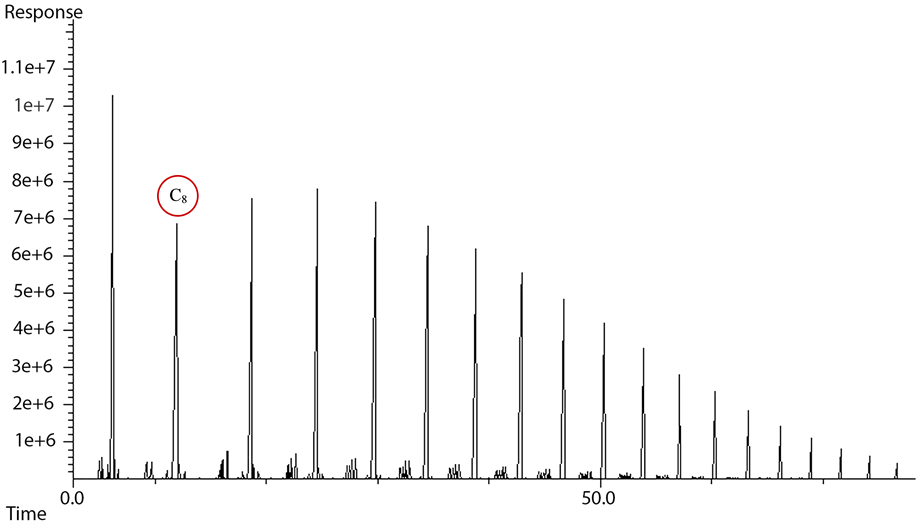
Figure 4. Overall FTS product spectrum obtained using off-line FID analysis, for cobalt-based, gas phase FTS at 240˚C and 20 bar with H2:CO of 2:1 feed ratio.
 C8
C8 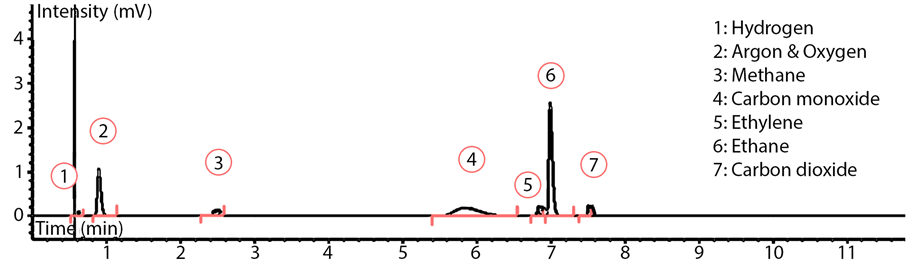
Figure 6. Peak identification of permanent gases on the TCD.
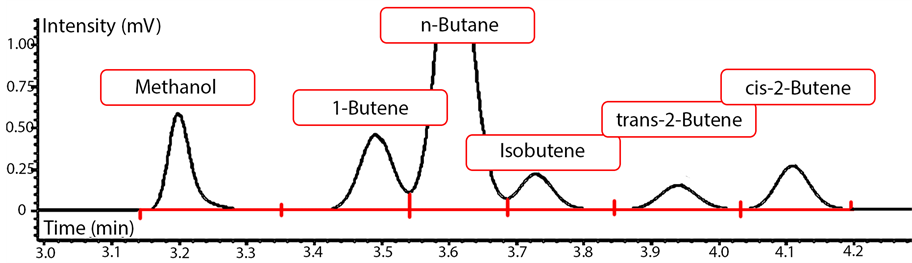
Figure 7. Peak identification for C4 FTS product range.
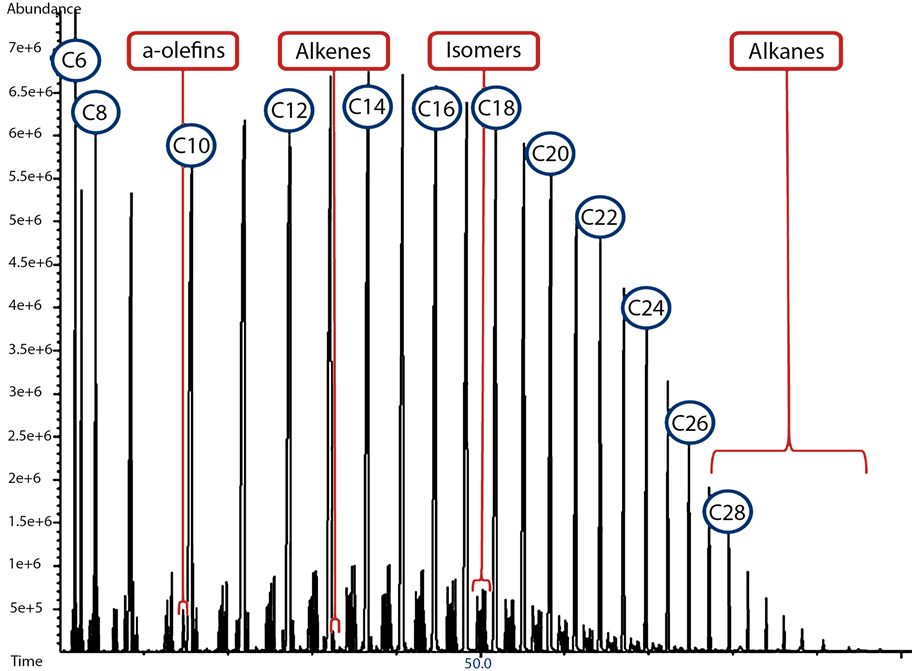
Figure 8. Overall FTS product spectrum obtained using off-line MS analysis, for cobalt-based, gas phase FTS at 240˚C and 20 bar with H2:CO of 2:1 feed ratio.
The identification of C5-C34 hydrocarbon compounds were carried out off-line by injecting liquid FTS product samples into the GC/MS (Figure 8). The off-line GC/MS analysis of liquid products provided the full product distribution upon accurate identification of all hydrocarbons between C5 and C34. Most hydrocarbons (isomers, olefins and oxygenates) between C5 and C25 were easily identified with high accuracy by the GC/MS. However, higher molecular weight branched isomers and high molecular weight olefins were more problematic to identify. At that point the remaining peaks were identified via superposition since FTS products were observed to follow a similar pattern for each hydrocarbon group. Huff et al. [25] used a similar GC/MS and superposition technique for identifying FTS products. However, they limited their GC/MS product identification and verification to major hydrocarbons and oxygenates within C1 - C12 hydrocarbons. After that, they used superposition for identifying the remaining peaks.
For the product distribution and selectivity studies, FTS products were divided into five groups (alcohols, isomers, α-olefins, normal paraffins and alkenes). As previously mentioned, the FTS products followed a similar pattern for each hydrocarbon group (CX), where it begins with (CX) isomers (increasing in number as X increases). The peaks follow the aforementioned CX of α-olefins (from 1 - 3), the normal (CX) alkane (normally the peak with the highest area, which is common for cobalt-based catalyst). After the normal alkane peak comes, the cis and then the trans (CX) alkenes peaks, as demonstrated in Figure 9 and Figure 10. On the other hand, the location of (CX-3) alcohol peaks changed as the carbon number increased. For lighter alcohols (C3 - C7), the alcohol

Figure 9. FTS product range on the MS, as identified by the off-line GC/MS, for cobalt-based, gas phase FTS at 240˚C and 20 bar with H2:CO of 2:1 feed ratio.
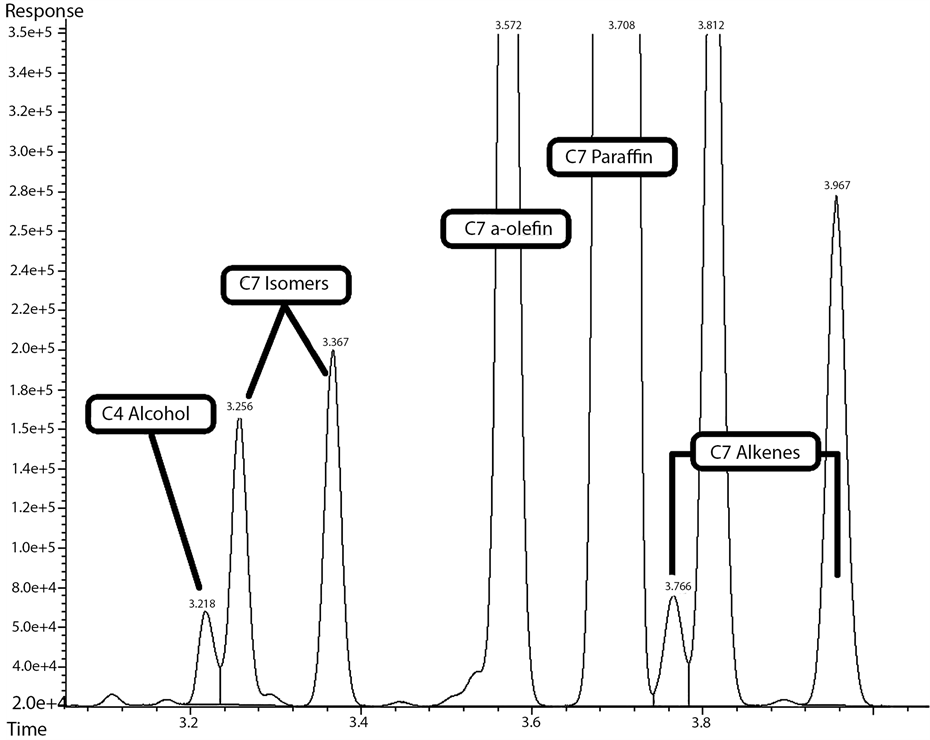
Figure 10. C7 FTS product range on the FID, as identified by the off-line GC/MS, for cobalt-based, gas phase FTS at 240˚C and 20 bar with H2:CO of 2:1 feed ratio.
peak was located before the CX isomers, for (C8 - C13) alcohols, the alcohol peaks were located between CX isomers and for (C14 - C20) alcohols, the alcohol peaks were found after the isomers and before the α-olefins peaks. It is also noticeable that, α-olefins were not detectable by the Agilent GC/MS beyond (C17), alcohols beyond 1-eicosanol (C20 normal alcohol) were not detectable, while cis and trans alkenes were not detectable beyond (C22). All observations mentioned earlier agree well with the profile of FTS hydrocarbon product distribution obtained from cobalt-based catalysts tested under similar conditions [21] [24] . A sample of compounds (C7 range) identified using the GC/MS is shown in Table 1. The sample retention time on both FID and MS were identified while the molecule identity was determined utilizing the MS (database), as shown in Figure 11. Subsequently, the retention time for each compound was inserted manually into the GC software (Enhanced Data Analysis), for automatic report generation with defined components.
During the off-line GC/MS FTS product identification minor aromatic, cyclic and acidic compounds were identified in the organic phase. This is expected since these compounds have higher affinity and would be more dissolved in the aqueous phase. Since these compounds were not prevalent in the FTS product and the error resulting by ignoring them would be minimal, they were not included in the FTS product distribution. For instance, the combined total weight percent of aromatics, acids and esters in the organic FTS phase was estimated by Hackett et al. [26] to be less than 4 wt%. While, acids and esters constituted about 8 wt% of the aqueous FTS samples as estimated by Anderson and White [27] .
3.2. Gas Phase and Supercritical Phase Fischer-Tropsch Synthesis Study
In this section, a comparison study between the conventional gas phase FTS and the SCF-FTS was conducted to

Table 1. C7 FTS product range as identified by the off-line GC/MS, for cobalt-based, gas phase FTS at 240˚C and 20 bar with H2:CO of 2:1 feed ratio.
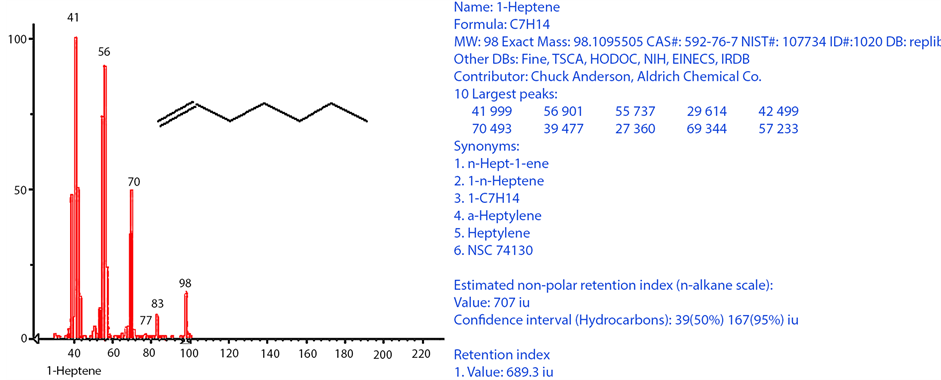
Figure 11. Example of MS peak identification for C7 peak # 4 (1-heptene) using the off-line GC/MS, for cobalt-based, gas phase FTS at 240˚C and 20 bar with H2/CO feed ratio of 2.
validate the FTS product identification and analysis process. This was carried by investigating the enhancements in terms of activity, selectivity and chain growth probability (α-value). The reactor was operated at 20 bar and 240˚C for the gas phase FTS. On the other hand, for the SCF-FTS the supercritical solvent (n-hexane) was introduced at 240˚C and the total reactor pressure was maintained at 65 bar. In both cases, the syngas partial pressure was kept at 20 bar with syngas with H2:CO of 2:1 feed ratio.
The on-line and off-line GC FTS product analysis confirmed a yield of a complex mixture of C1 to C34 hydrocarbons and C1 to C17 oxygenates, in addition to H2O, CO2 and unreacted syngas. The predominant FTS products were linear alkanes (n-paraffins), while branched (isomers), oxygenates (alcohols), α-olefins, and alkenes (cis and trans) hydrocarbons were produced to a lesser extent, as previously shown in Figures 8-10; this product distribution is typical for cobalt-based catalysts.
Starting with Figure 12, which compares the CO conversion percent under the two reaction media, it was noticed that CO conversion increased by approximately 14% upon the introduction of supercritical hexane. In literature [18] [28] [29] , the experimental data concerning CO conversion under the different reaction media is contradictory. On one hand, Fujimoto et al. [18] found that the conversion under supercritical condition was to some extent lower than that in the gas phase. They attributed this to the difference in syngas diffusion rate in the different reaction media where the diffusion rate in supercritical fluids is slower than that in the gas phase. On the other hand, Huang and Roberts [30] showed that conversion in supercritical hexane is higher (70%) than that in the gas phase (60%).
The overall hydrocarbon product distributions from C1 - C32 under the previously mentioned conditions were compared as shown in Figure 13. The overall product distribution figure elucidates the shift towards the production of heavier hydrocarbons under the SCF reaction medium. For instance, middle distillates (C11 - C22) constituted about 67% of the normalized product weight under the SCF-FTS compared to 44% in the gas phase FTS. In addition, a substantial drop in methane selectivity was observed when shifting the FTS reaction medium from gas phase to SCF. A number of studies [18] [28] [31] [32] also reported a suppression of methane formation when applying SCF as a reaction media for the FTS.
Higher α-value indicates higher selectivity towards heavier hydrocarbon production and vice versa. Figure 14 shows the ASF plots of the FTS under either reaction media (supercritical hexane and gas phase). From the ASF plots, it was first noticed that lower selectivities towards methane and light hydrocarbons were achieved under supercritical conditions, while the selectivity towards middle distillates and heavy hydrocarbons was increased (this is in agreement with the previous discussion). The improved product selectivities upon the introduction of
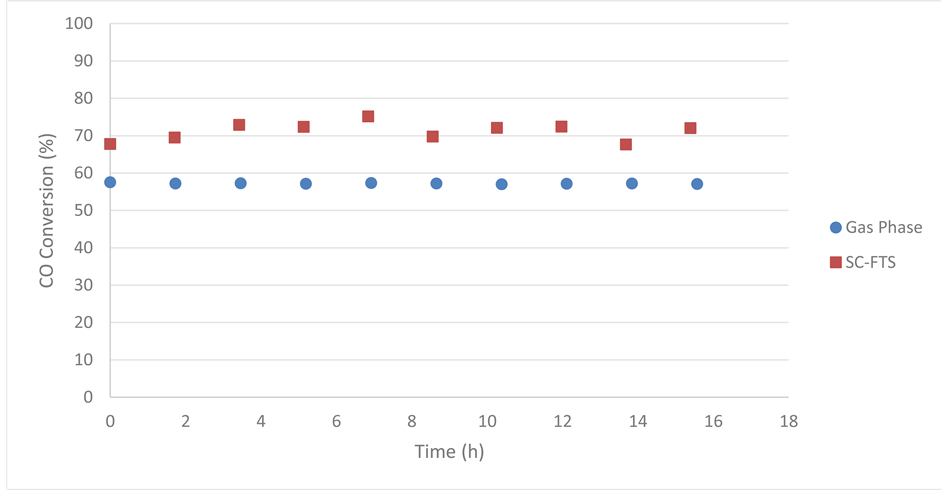
Figure 12. Reaction medium effect on CO conversion, over 15 wt% Co/Al2O3, under the following conditions: temperature 240˚C, pressure 65 bar for SC-FTS and 20 bar for gas phase FTS, and H2:CO of 2:1 feed ratio.

Figure 13. Reaction medium effect on product distribution, over 15 wt% Co/Al2O3, under the following conditions: temperature 240˚C, pressure 65 bar for SC-FTS and 20 bar for gas phase FTS, and H2:CO of 2:1 feed ratio.
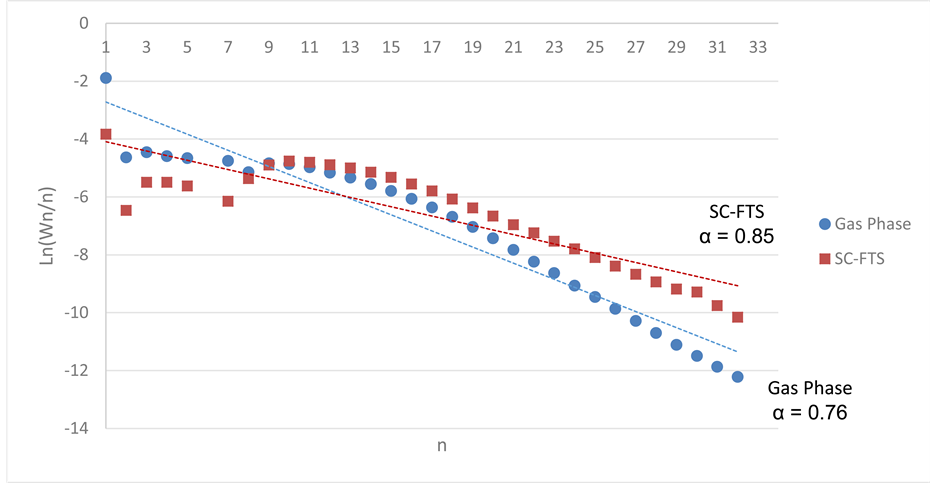
Figure 14. Anderson?Schulz?Flory (ASF) plots showing the reaction medium effect on the hydrocarbon product distribution and chain growth probability (α-value), over 15 wt% Co/Al2O3, under the following conditions: temperature 240˚C, pressure 65 bar for SC-FTS and 20 bar for gas phase FTS, and H2:CO of 2:1 feed ratio.
supercritical hexane resulted in a significant increase in chain growth probability from 0.76 to 0.85. Similar incensement were observed in previous literature [17] [24] [33] [34] under supercritical conditions.
The aforementioned enhancements in CO conversion, reduced selectivity towards light hydrocarbons and increased selectivity towards heavy hydrocarbons is explained in literature and is discussed briefly in this paper. The increased conversion is attributed to the increased reactants accessibility to the active sites after the in-situ wax extraction from the catalyst pores by the SCF [1] [16] [17] [28] [31] [35] -[37] . The reduction in methane and light end fuel cuts is attributed to the liquid-like heat transfer properties in the SCF reaction medium that results in better heat removal from the catalyst bed. Thus, it minimizes hot spots formation and reduces the rate of cracking reactions [16] [28] [31] [32] [38] . As for the observed enhancement in chain growth probability and the selectivity towards heavy hydrocarbons, this is explained by the liquid-like solubility of SCF that result in higher diffusivities and desorption rates of heavy hydrocarbons (wax extraction) from the catalyst pores. Thus, freeing more actives sites for primary products to incorporate in the chain growth process [1] [16] [17] [28] [31] [35] [37] . Moreover, SCF are capable of extracting olefins prior to undergoing hydrogenation reactions (termination of the chain growth), which increase the chance of their readsorption and incorporation in the chain growth, thus yielding heavier FTS products [1] [16] [17] [31] [33] -[35] .
3.3. Alcohol Analysis Verification
During the off-line FTS product peak identification using the (GC/FID/MS) system, considerable amounts of several alcohols were identified in the organic FTS product samples. This is uncommon for cobalt-based low- temperature FTS; thus, further investigation was required.
A typical liquid sample of the gas phase FTS (240˚C, 20 bar, 65 nmL/min syngas flow with 2:1 H2:CO molar feed ratio) was collected from the bottom of the cold trap. Then the organic phase from that sample was injected into the GC/MS for analysis. The alcohols identified within the sample’s organic phase are given in Table 2.
To further investigate these results, the aqueous phase from the same sample was injected into the GC/MS, where the resulting MS spectrum is shown in Figure 15, labelled with the identities of the peaks, as determined by the MS. The GC/MS analysis of the aqueous phase clearly shows that C1 - C6 alcohols were present in the FTS product.
As a double check and to confirm the MS results, a reference sample was prepared by mixing a small amount (~5 μL) of a mixture of C1 - C6 alcohols diluted with 1.5 mL of n-hexane (Sigma Aldrich, ≥95% purity, with the rest composed of small amounts of C6 iso and cyclic hydrocarbons). The reference sample was then injected into the GC/MS, and the obtained MS spectrum is shown in Figure 16. By comparing Figure 15 and Figure 16, it can be concluded that the reference sample confirms that the GC/MS correctly identified the alcohol peaks.
The FTS produces a wide range of products including n-paraffins, olefins oxygenates and aromatics. Pei et al. [39] recently studied the promotional effect of silica over activated carbon supported cobalt catalyst for the production of higher chain alcohols. They reported that sufficient amounts of SiO2 addition favored the formation of higher molecular mass alcohols (C6 - C18) by suppressing cobalt reduction and therefore producing Co(II) species and thus facilitating CO insertion. The same group previously also demonstrated that activated carbon supported cobalt catalysts are able to produce linear C1 - C18 alcohols from syngas via the FTS reaction due to the synergy between active Co2C sites formed in-situ during the reaction and active cobalt sites [40] . Also, another experimental work [41] reported CO conversion of 30% and high alcohol selectivity of 20% when cobalt
Table 2. Peak list for the alcohols identified in the gas phase FTS (240˚C, 20 bar, 65 nmL/min syngas flow with H2:CO of 2:1 molar feed ratio) organic phase liquid sample, injected into GC/FID/MS system.
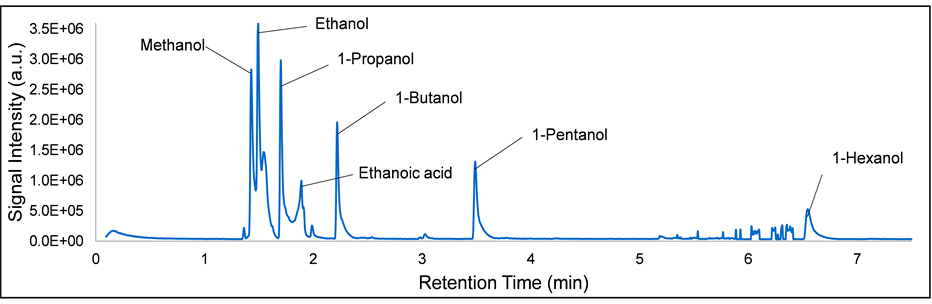
Figure 15. GC/MS spectrum for the aqueous FTS (240˚C, 20 bar, 65 nmL/min syngas flow with 2:1 H2:CO molar feed ratio) sample, with compound identities labeled.

Figure 16. GC/MS spectrum of the prepared reference sample, consisting of C1 - C6 alcohols dissolved in n-hexane, with compound identities labelled.
molybdenum based catalyst is used under the operating conditions of 307˚C, 75 bar and syngas ratio H2/CO = 2.
From the above discussion, it can be seen that while iron based catalyst are known to be selective towards alcohol production, cobalt based catalyst can also produce alcohols if the catalyst and reactions conditions were adjusted. Nevertheless, this finding requires further detailed investigation, which is currently being performed by the research team.
4. Conclusion
The dilution of FTS product with the solvent complicated the identification and analysis of the reactor effluent since the solvent peak was extremely dominant over the product spectrum. Therefore, a sophisticated custom- made on-line and off-line GC setup was developed. The GC analysis system and method implemented successfully enabled the identification and characterization of FTS hydrocarbons within (C1 - C32) range as well as permanent gases (CO, H2, CO2, Ar). After setting the analysis system, a set of reaction conditions were applied to verify the functionality of the GC analysis setup. Through the utilization of the custom-made analysis system, reliable activity and product distribution were obtained, which enabled the formulation of conversion, product distribution and ASF curves under both gas phase and supercritical phase. These curves were able to compare the cobalt catalyst performance under the distinct reaction media. The experimental findings provided us with accurate measurements of the hydrocarbon product distribution both the conventional gas-phase and in the supercritical phase, which are in good agreement with the product profiles reported in literature. This unique analytical setup has as well provided us the opportunity to identify and confirm the presence of significant alcohol amounts in the product profile of a cobalt-based catalyst, which are not common products for this type of catalyst. This phenomenon is currently under thorough investigation in our lab to understand the mechanistic of reaction that could lead to such products.
Acknowledgements
The authors would like to thank the Qatar National Research Fund (QNRF) (a member of Qatar Foundation) for financial support of this project under the National Priorities Research Program (NPRP) (grant # 4-144-2-590). The statements made herein are solely the responsibility of the authors.
Cite this paper
AmroKasht,RehanHussain,MinhajGhouri,JanBlank,Nimir O.Elbashir, (2015) Product Analysis of Supercritical Fischer-Tropsch Synthesis: Utilizing a Unique On-Line and Off-Line Gas Chromatographs Setup in a Bench-Scale Reactor Unit. American Journal of Analytical Chemistry,06,659-676. doi: 10.4236/ajac.2015.68064
References
- 1. Elbashir, N.O., Bukur, D.B., Durham, E. and Roberts, C.B. (2009) Advancement of Fischer-Tropsch Synthesis via Utilization of Supercritical Fluid Reaction Media. AIChE Journal, 56, 997-1015.
http://dx.doi.org/10.1002/aic.12032 - 2. Fischer, F. and Tropsch, H. (1926) The Synthesis of Petroleum at Atmospheric Pressures from Gasification Products of Coal. Brennstoff-Chemie, 7, 97-104.
- 3. Marvast, M.A., Sohrabi, M., Zarrinpashne, S. and Baghmisheh, G. (2005) Fischer-Tropsch Synthesis: Modeling and Performance Study for Fe-HZSM5 Bifunctional Catalyst. Chemical Engineering Technology, 28, 78-86.
http://dx.doi.org/10.1002/ceat.200407013 - 4. Sheehan, J., Camobreco, V., Duffield, J., Graboski, M. and Shapouri, H. (1998) Life Cycle Inventory of Biodiesel and Petroleum Diesel for Use in an Urban Bus. U.S. Department of Energy, U.S. Department of Agriculture, Colorado.
http://dx.doi.org/10.2172/658310 - 5. Elbashir, N.O. and Eljack, F.T. (2010) A Method to Design an Advanced Gas-to-Liquid Technology Reactor for Fischer-Tropsch Synthesis. Proceedings of the 2nd Annual Gas Processing Symposium, Doha, 369-377.
http://dx.doi.org/10.1016/S1876-0147(10)02039-2 - 6. Steynberg, A. and Dry, M. (2004) Fischer-Tropsch Technology: Studies in Surface Science and Catalysis, Vol. 152. Elsevier, New York.
- 7. Hussain, R., Blank, J.H., Todic, B., Elbashir, N.O. and Bukur, D.B. (2014) Development of Gas-to-Liquid Technologies from Micro- to Mac-ro-Scale. In: Excellence and Impact of Research, Texas A&M University at Qatar, Doha, 55-78.
- 8. Moutsoglou, A. and Sunkara, P.P. (2011) Fischer-Tropsch Synthesis in a Fixed Bed Reactor. Energy & Fuels, 25, 2242-2257.
http://dx.doi.org/10.1021/ef200160x - 9. Jager, B. (2003) Development of Fischer Tropsch Reactors. The AIChE Spring Meeting, New Orleans, 1 April 2003, 1-9.
- 10. Lee, T.S. and Chung, J.N. (2012) Mathematical Modeling and Numerical Simulation of a Fischer-Tropsch Packed Bed Reactor and its Thermal Management for Liquid Hydrocarbon Fuel Production using Biomass Syngas. Energy & Fuels, 26, 1363-1379.
http://dx.doi.org/10.1021/ef201667a - 11. Elmalik E., Tora, E., El-Halwagi, M.M. and Elbashir, N.O. (2011) Solvent Selection for Commercial Supercritical Fischer-Tropsch Synthesis Process. Fuel Processing Technology, 92, 1525-1530.
- 12. Maretto, C. and Krishna, R. (2001) Design and Optimisation of a Multi-Stage Bubble Column Slurry Reactor for Fischer-Tropsch Synthesis. Catalysis Today, 66, 241-248.
http://dx.doi.org/10.1016/S0920-5861(00)00626-X - 13. Stern, D., Bell, A.T. and Heinemann, H. (1983) Effects of Mass Transfer on the Performance of Slurry Reactors Used for Fischer-Tropsch Synthesis. Chemical Engineering Science, 38, 597-605.
http://dx.doi.org/10.1016/0009-2509(83)80119-5 - 14. Hooshyar, N., Vervloet, D., Kapteijn, F., Hamersma, P.J., Mudde, R.F. and v. Ommen, J.R. (2012) Intensifying the Fischer-Tropsch Synthesis by Reactor Structuring—A Model Study. Chemical Engineering Journal, 207-208, 865-870.
http://dx.doi.org/10.1016/j.cej.2012.07.105 - 15. Bartholomew, C.H. and Farrauto, R.J. (2006) Fundamentals of Industrial Catalytic Processes. 2nd Edition, Wiley, Hoboken.
- 16. Yokota, K., Hanakata, Y. and Fujimoto, K. (1990) Supercritical Phase Fischer-Tropsch Synthesis. Chemical Engineering Science, 45, 2743-2750.
http://dx.doi.org/10.1016/0009-2509(90)80166-C - 17. Bochniak, D.J. and Subramaniam, B. (1998) Fischer-Tropsch Synthesis in Near-Critical n-Hexane: Pressure Tuning Effects. AIChE, 44, 1889-1896.
http://dx.doi.org/10.1002/aic.690440818 - 18. Yokota, K. and Fujimoto, K. (1989) Supercritical Phase Fischer-Tropsch Synthesis Reaction. Fuel, 68, 255-256.
http://dx.doi.org/10.1016/0016-2361(89)90335-9 - 19. Yokota, K. and Fujimoto, K. (1991) Supercritical-Phase Fischer-Tropsch Synthesis Reaction. 2. The Effective Diffusion of Re-actant and Products in the Supercritical-Phase Reaction. Industrial & Engineering Chemistry Research, 30, 95-100.
http://dx.doi.org/10.1021/ie00049a014 - 20. Dictor, R.A. and Bell, A.T. (1984) On-Line Analysis of Fischer-Tropsch Synthesis Products. Industrial & Engineering Chemical Fundamentals, 23, 252-256.
http://dx.doi.org/10.1021/i100014a019 - 21. Snavely, K. and Subramaniam, B. (1997) On-Line Gas Chromato-graphic Analysis of Fischer-Tropsch Synthesis Products Formed in a Supercritical Reaction Medium. Industrial & Engineering Chemical Research, 36, 4413-4420.
http://dx.doi.org/10.1021/ie9702791 - 22. Hackett, J.P. and Gibbon, G.A. (1989) Capillary Gas Chromatographic Characterization of Fischer-Tropsch Liquefaction Products: On-Line Analysis. Journal of Chromatographic Science, 27, 405-412.
- 23. Nijs, H.H. and Jacobs, P.A. (1980) On-Line Single Run Analysis of Effluents from a Fischer-Tropsch Reactor. Chromatographic Science, 19, 40-45.
http://dx.doi.org/10.1093/chromsci/19.1.40 - 24. Pei, Y., Ding, Y., Zhu, H. and Dua, H. (2015) One-Step Production of C1 - C18 Alcohols via Fischer-Tropsch Reaction over Activated Carbon-Supported Cobalt Catalysts: Promotional Effect of Modification by SiO2. Chinese Journal of Catalysis, 36, 355-361.
http://dx.doi.org/10.1016/S1872-2067(14)60252-7 - 25. Pei, Y., Ding, Y., Zang, J., Song, X., Dong, W., Zhu, H., et al. (2014) Fischer-Tropsch Synthesis: Characterizing and Reaction Testing of Co2C/SiO2 and Co2C/Al2O3 Catalysts. Chinese Journal of Catalysis, 36, 252-259.
http://dx.doi.org/10.1016/S1872-2067(14)60179-0 - 26. Zhao, Y. (2007) On the Investigation of Alcohol Synthesis via the Fischer Tropsch Reaction. Doctor of Philosophy, Chemistry, Cardiff University, United Kingdom.
- 27. Fan, L. and Fujimoto, K. (1999) Fischer-Tropsch Synthesis in Supercritical Fluid: Characteristics and Application. Applied Catalysis A: General, 186, 343-354.
http://dx.doi.org/10.1016/S0926-860X(99)00153-2 - 28. Elbashir, N.O. (2010) Opportunities for Selective Control of Fischer-Tropsch Synthesis Hydrocarbons Product Distribution. 2nd Annual Gas Processing Symposium, Doha, 10-14 January 2010, 197-208.
http://dx.doi.org/10.1016/S1876-0147(10)02022-7 - 29. Irankhah, A. and Haghtalab, A. (2008) Fischer-Tropsch Synthesis Over Co-Ru/γ-Al2O3 Catalyst in Supercritical Media. Chemical Engineering Technology, 31, 525-536.
http://dx.doi.org/10.1002/ceat.200700452 - 30. Subramaniam, B. (2001) Enhancing the Stability of Porous Catalysts with Supercritical Reaction Media. Applied Catalysis A: General, 212, 199-213.
http://dx.doi.org/10.1016/S0926-860X(00)00848-6 - 31. Elbashir, N.O., Dutta, P., Manivannan, A., Seehra, M.S. and Roberts, C.B. (2005) Impact of Cobalt-Based Catalyst Characteristics on the Performance of Conventional Gas-Phase and Supercritical-Phase Fischer-Tropsch Synthesis. Applied Catalysis A: General, 285, 169-180.
http://dx.doi.org/10.1016/j.apcata.2005.02.023 - 32. Tsubaki, N., Yoshii, K. and Fujimoto, K. (2002) Anti-ASF Distribution of Fischer-Tropsch Hydrocarbons in Supercritical-Phase Reactions. Journal of Catalysis, 207, 371-375.
http://dx.doi.org/10.1006/jcat.2002.3526 - 33. Yan, S., Fan, L., Zhang, Z., Zhou, J. and Fujimoto, K. (1998) Supercritical-Phase Process for Selective Synthesis of Heavy Hydrocarbons from Syngas on Cobalt Catalysts. Applied Catalysis A: General, 171, 247-254.
http://dx.doi.org/10.1016/S0926-860X(98)00049-0 - 34. Geerlings, J.J.C., Wilson, J.H., Kramer, G.J., Kuipers, H.P.C.E., Hoek, A. and Huisman, H.M. (1999) Fischer-Tropsch Technology—From Active Site to Commercial Process. Applied Catalysis A: General, 186, 27-40.
http://dx.doi.org/10.1016/S0926-860X(99)00162-3 - 35. Huang, X. and Roberts, C.B. (2003) Selective Fischer-Tropsch Synthesis over an Al2O3 Supported Cobalt Catalyst in Supercritical Hexane. Fuel Processing Technology, 83, 81-99.
http://dx.doi.org/10.1016/S0378-3820(03)00060-2 - 36. Bukur, D.B., Lang, X. and Nowicki, L. (2005) Comparative Study of an Iron Fischer-Tropsch Catalyst Performance in Stirred Tank Slurry and Fixed-Bed Reactors. Industrial & Engineering Chemical Research, 44, 6038-6044.
http://dx.doi.org/10.1021/ie0492146 - 37. de-Deugd, R.M., Kapteijn, F. and Moulijn, J.A. (2003) Trends in Fischer-Tropsch Reactor Technology—Opportunities for Structured Reactors. Topics in Catalysis, 26, 29-39.
http://dx.doi.org/10.1023/B:TOCA.0000012985.60691.67 - 38. Anderson, R.R. and White, C.M. (1994) Analysis of Fischer-Tropsch By-Product Waters by Gas Chromatography. Separation Science, 17, 245-250.
http://dx.doi.org/10.1002/jhrc.1240170410 - 39. Hackett, J.P., Gibbon, G.A. and Feldman, J.A. (1985) Capillary Gas Chromatographic Characterization of Fischer-Tropsch Liquefaction Product Oils. Chromatographic Science, 23, 285-292.
http://dx.doi.org/10.1093/chromsci/23.7.285 - 40. Huff, G.A., Satterfield, C.N. and Wolf, M.H. (1983) Stirred Autoclave Apparatus for Study of the Fischer-Tropsch Synthesis in a Slurry Bed: 2 Analytical Procedures. Industrial and Engineering Chemistry Fundamentals, 22, 258-263.
http://dx.doi.org/10.1021/i100010a018 - 41. Elbashir, N.O. and Roberts, C.B. (2005) Enhanced Incorporation of α-Olefins in the Fischer-Tropsch Synthesis Chain-Growth Process over an Alumina-Supported Cobalt Catalyst in Near-Critical and Supercritical Hexane Media. Industrial & Engineering Chemistry Research, 44, 505-521.
http://dx.doi.org/10.1021/ie0497285
NOTES

*Corresponding author.