Open Journal of Air Pollution
Vol.1 No.2(2012), Article ID:22741,6 pages DOI:10.4236/ojap.2012.12004
Analysis of Total Suspended Particulates Pollution along Shanghai-Nanjing Expressway
College of Civil Engineering , Nanjing Forestry University, Nanjing, China
Email: zhaoyaonfu@163.com, shidiyzw@163.com
Received June 18, 2012; revised July 29, 2012; accepted August 20, 2012
Keywords: Expressway; Total Suspended Particulates (TSP); Pollution
ABSTRACT
The paper takes the Shanghai-Nanjing expressway as the research subject and takes the samples of the Total Suspended Particulates (TSP) on both sides of the highway as samples to analyze the pollution and the pattern of pollution distribution. The study shows that the concentration of TSP is very high, even six times of the national limit value.
1. Introduction
Since the reforming and opening of China over the last three decades, China’s economy has speeded up significantly and highway transportation has developed rapidly. By the end of 2010, the total mileage of China’s highway has reached 3.984 million kilometers, including 74 thousand kilometers expressway which are ranked the second longest in the world. While the infrastructure construction of transportation is meeting the needs of economic development in China at present, the influence on the environment near highway can not be ignored [1].
The highway mainly influences economic, social and ecological environment nearby. In both the contribution and operation phases, the highway project contributes to the economy and the society. Besides, it has great impacts on water environment, acoustic environment, soil environment and atmospheric environment. Especially during the operation phase, with the dramatically increased vehicle flux, the vehicle exhaust, the road dust and the tear-and-wear of tires are diffused in the air, increasingly worsening the atmosphere quality on both sides of highway.
Unlike general sources of industrial pollution, the diffusion of atmospheric pollution along highway lies in human’s respiratory zone and threat human’s health directly [2], such as burning eyes and noses, irritating throats and causing breathing problems [3]. According to statistics, about half of all mortality caused by air pollution was attributed to motorized traffic [4]. Except nitrogen oxides (NOx), carbon oxides (COx), sulfur dioxide (SO2) and other gaseous pollutants, there are also suspended particles in the atmosphere [5]. The suspended particles which are small and of strong adsorption can float in air for a long time so that they have a long-term impact on the environment along the highway. The floating particles influence animals, plants, and residents, as well as buildings nearby [6]. Moreover, they can change the atmosphere compositions through chemical reaction and bring about long-term climate impact [7-9]. Therefore, it is necessary to enhance the research on atmosphere particulate pollution in the highway area.
According to the particle size, the atmosphere particulate can be divided into Dust Fall (with aerodynamic diameter of 100 - 1000 μm), TSP (with aerodynamic diameter of less than 100 μm), Inhalable Particulate Matter (PM10, with aerodynamic diameter of less than 10 μm), Coarse Particulate (PM2.5 - 10, with aerodynamic diameter of 2.5 - 10 μm), and Fine Particulate (PM2.5, with aerodynamic diameter of less than 2.5 μm) [10]. At present, most researches concentrate on suspended particles in air of city area and there is little research about suspended particles along the highway atmosphere, not to mention TSP on both sides of highway.
With the development of urbanization process, the highway network of China, especially in the eastern area becomes increasingly intensive. Monitor and analyze TSP pollution along both sides of highway becomes very important. And studies are necessary to improve the environment impact assessment (EIA) of highway construction projects and the living quality of the people near the highway.
In this study, the concentration of TSP along the Shanghai-Nanjing expressway in the winter of 2010 was continuously monitored. The study aims to improve the ecological environment, to optimize planning of highway construction and to protect the agriculture and agriculture products.
2. The Study Area
The city of Nanjing is the provincial capital of Jiangsu province and is located 300 kilometers to the east of Shanghai. Nanjing is an area of typical subtropical monsoon climate, which has a distinct character of monsoon area. It is clear, dry and cold in the winter while it is hot with rich rainfall in the summer. It is usually dry and cool in spring and autumn.
The traffic and transportation is convenient here. A three-dimensional transport network has been established which contains railroad, highway, airlines, water and pipeline transportation. The Shanghai-Nanjing expressway is an important highway in Yangtze River delta area with a length of 18.69 kilometers in Nanjing city. The average traffic is large everyday and various kinds of vehicles pass by so that the TSP pollution is bound to bring endless hidden dangers to the villages and vegetables nearby.
3. Methods
• Sampling Instrument
The sampling instrument for TSP is the model TH- 150C of intelligent medium volume TSP samplers and the glass fiber membrane made by Wuhan Tianhong Instrument Co., LTD.
• Description of Sampling Site
According to the field situation, the sampling section was set at the west exit of the Shanghai-Nanjing expressway near Nanjing. The samplers were put on both shoulders of the expressway. The layout of sampling site is shown in Figure 1.
The sampling site is to the west of the toll station office where there is little greening. On the other side of the sampling site, there is a small village with rich vegetation.
• Sample Collection
The main monitoring item in this study is TSP. The sampling was taken once every 6 - 7 days from the 17th of October, 2010 to the 2nd of January, 2011. Each sampling time was from 7:00 am to 7:00 pm, lasting 12 hours. The flow of the sampler was set to 100 L/min, the membrane was changed every 2 hours. A total of 120 samples were
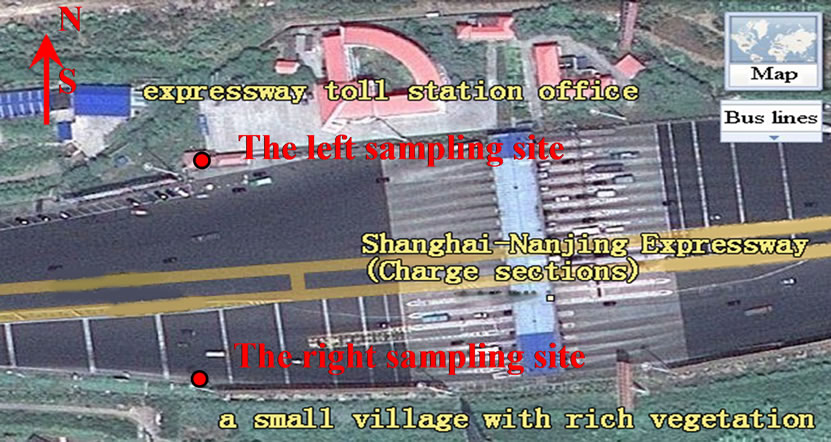
Figure 1. The sketch map of sampling sitesa.
obtained. The sampling day was chosen in the 3rd or the 4th sunny day after two or three continuous sunny days. The weather condition was recorded in different times of the day.
Before each sampling, a clean membrane was put in a thermostatic chamber with temperature of 26˚C and a relative humidity of 50% for 24 hours. Then, the membrane was weighed (accurate to 0.1mg) and recorded as w0.
• Sample Preparation
The membrane after sampling was put into the thermostatic chamber with the same temperature and humidity and weight for 24 hours and then weighed (accurate to 0.1 mg) and recorded as w1.
• Calculation
Use the formula [11] below to calculate TSP concentration:
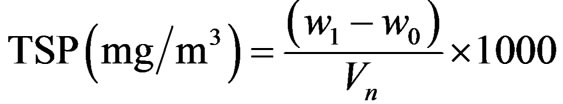 (1)
(1)
In the formula: w1 is the weight of membrane with TSP dust in the Unit of g; w0 is the weight of clean membrane in the Unit of g; v0 is the accumulate sample volume in standard condition in the unit of m3.
4. Result and Discussion
• Analysis of Concentration
TSP pollution on both sides of Shanghai-Nanjing expressway is shown in Table 1.
Table 1 shows that TSP concentration in atmosphere at the two sides of Shanghai-Nanjing expressway is different though the sampling sites are in the same cross section. The cause lies on the different surroundings on the two sides. On the south side, the vegetation is rich that trees, shrubs and grass form a three-dimensional greening system which has an obvious dust-retention effect. However, on the north side, few greening exists and high buildings just stop the diffusion of TSP. Moreover, temporary stopping of heavy trucks and a flow of people worsen the pollution.
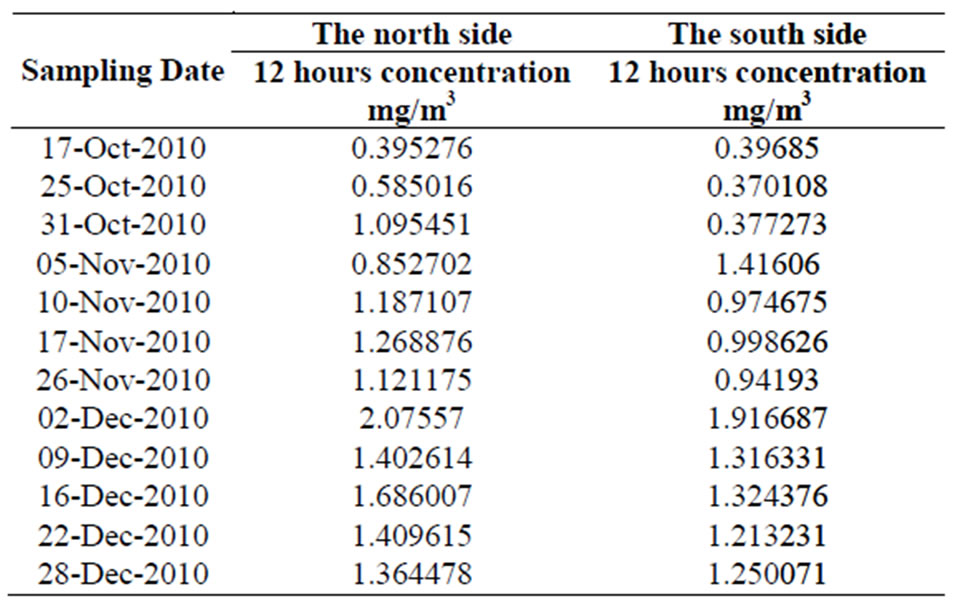
Table 1. TSP Monitoring data of sampling site in ShanghaiNanjing expressway.
The sampling site is located in suburb areas with many villages and farmlands nearby. According to the division of functional area for environment air quality in China as defined in “Ambient Air Quality Standard” (GB3095- 1996) [12], as what is shown in Table 2, the secondary should be carried out in general industry zones and rural. It is clear that the TSP concentrations in atmosphere at the sampling site are far out of the standard limits.
• Space-Time Variation regularity
1) Daily variation regularity and influence factors
Figure 2 shows the daily variation of TSP concentration at the sampling sites of Shanghai-Nanjing expressway on the 12 days from October to December of 2010 respectively. It can be seen from the figures that the daily variation patterns of TSP concentration on the two sides of the way are different. In addition, difference exists in different months.
The daily variation trends of TSP concentration at the sampling site keep a nice regularity except on October 25th, November 10th and December 9th. On most days, the TSP concentration reaches the highest value in the morning and then drops with time.
On the 25th of October, the TSP concentration of sampling sites shows a different variation trend. On the north side, the peak value occurs at 9:00 am to 11:00 am and at 13:00 pm to 15:00 pm. On the south side, the valley value occurs at 9:00 am to 11:00 am and at 13:00 pm to 15:00 pm. On the 10th of November, the TSP concentration on the south side shows two peaks. On the 9th of December, the TSP concentration of right side reached the highest value in the morning and then decreased rapidly. Afterward, the value reached another high value at 11:00 am to 13:00 pm and then dropped again. The data were lost in the afternoon of December, the 2nd, because of power failure and construction at that time.
It can be seen from Figure 2 that the daily variation of TSP concentrations was different in October, December and November. The largest daily variation of TSP concentration occurs on the south sampling site on the 5th of December and the smallest happened on the north side on the 17th of October The average daily variation of 2010 and the smallest occurs on the left on October 17th, 2010. The average daily variation on both sides in each month is in a descending order as November, December, October.
The causes of these variation trends are analyzed as follows. Firstly, there is no industry or refinery on both sides of sampling section. So the traffic flux and natural
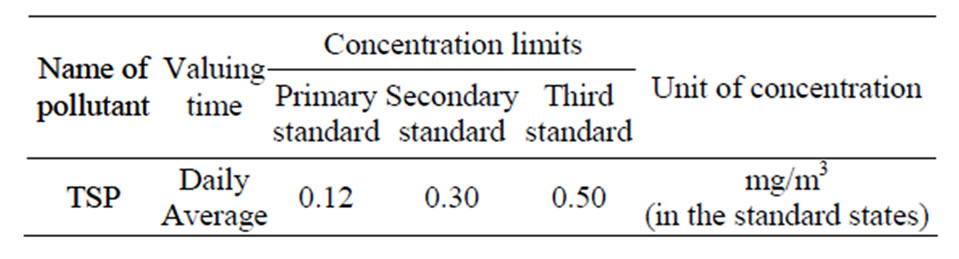
Table 2. Concentration limits of pollutant.
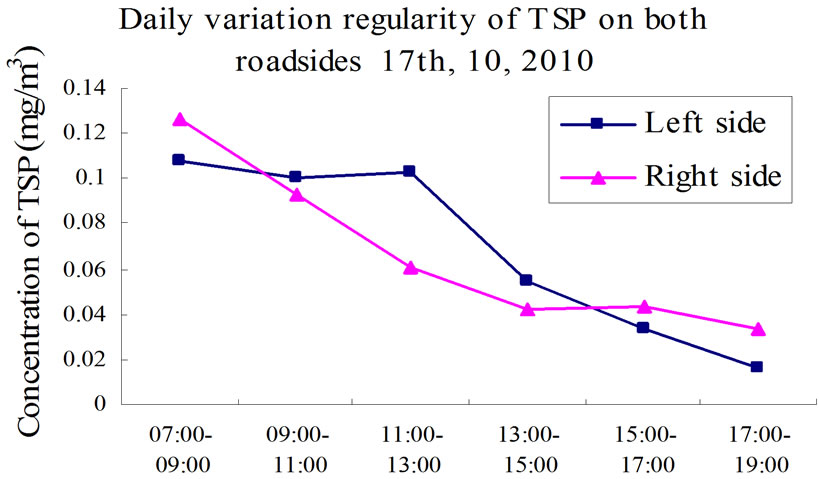
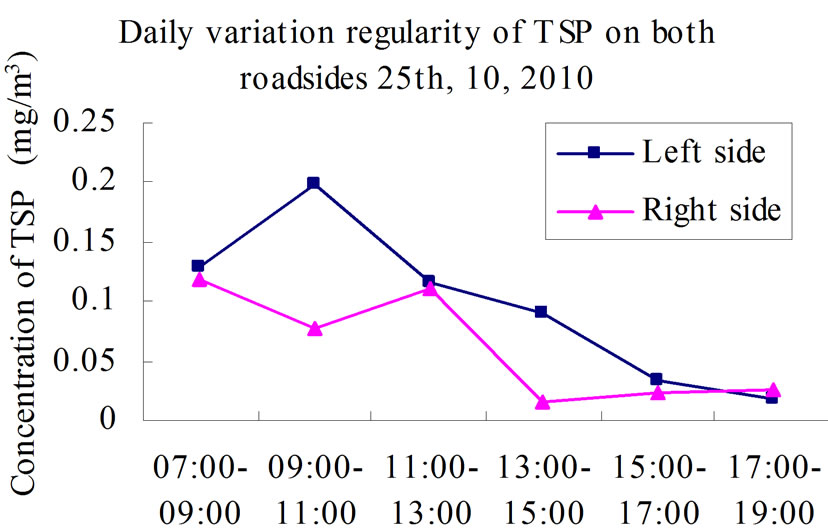
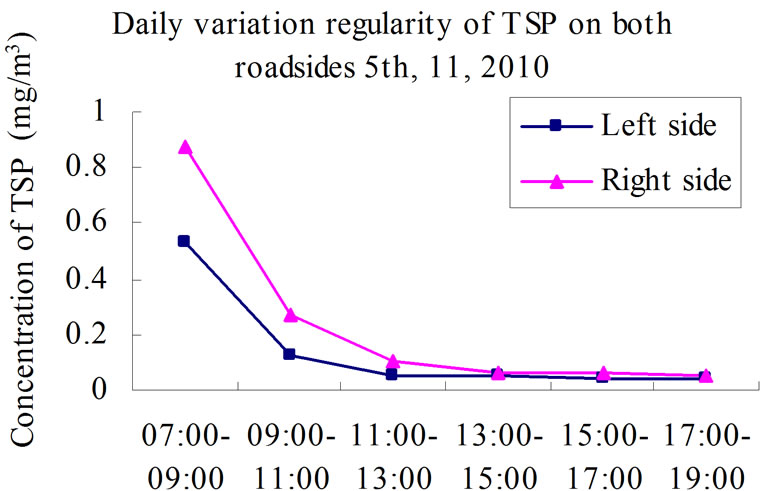
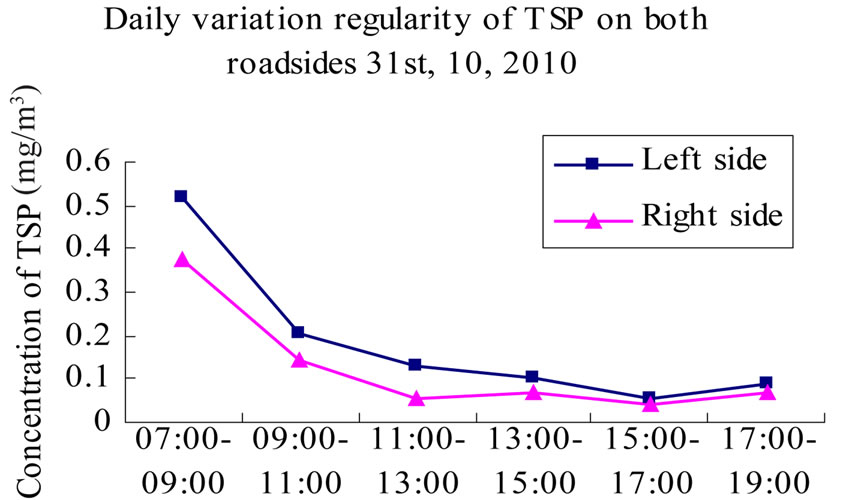
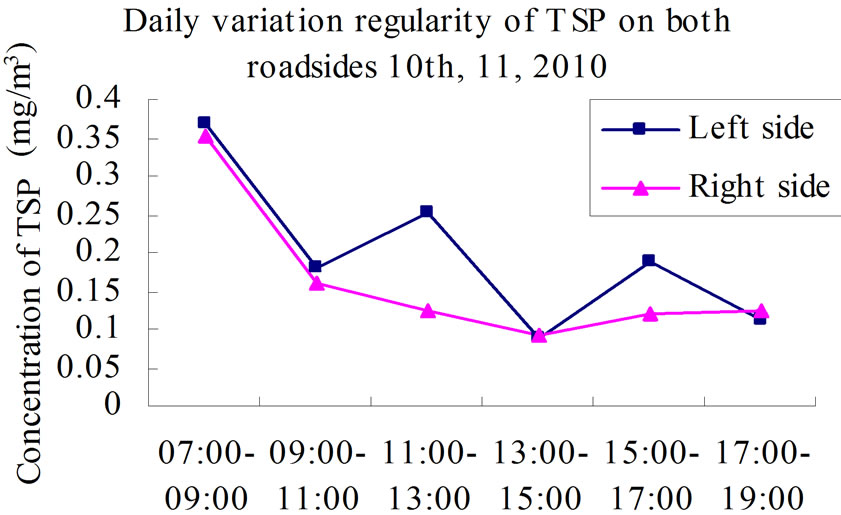
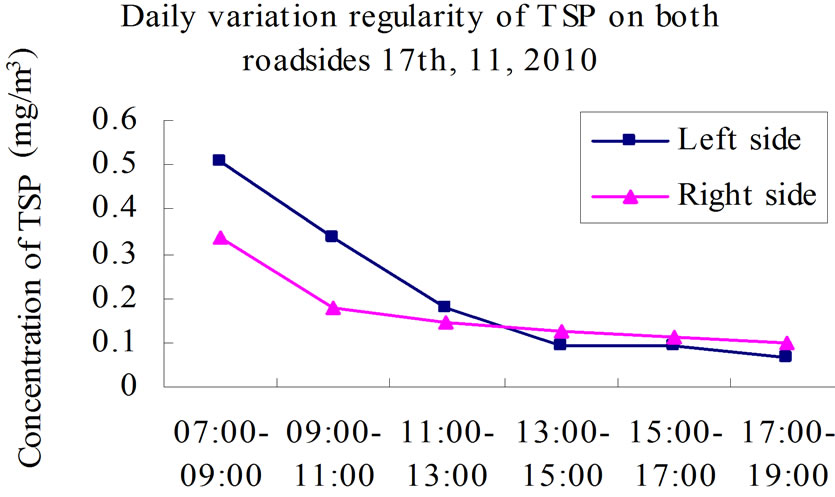
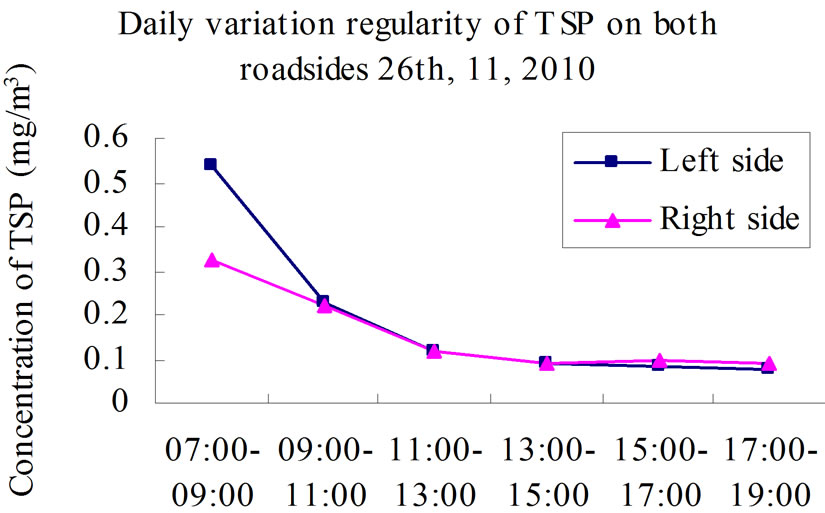
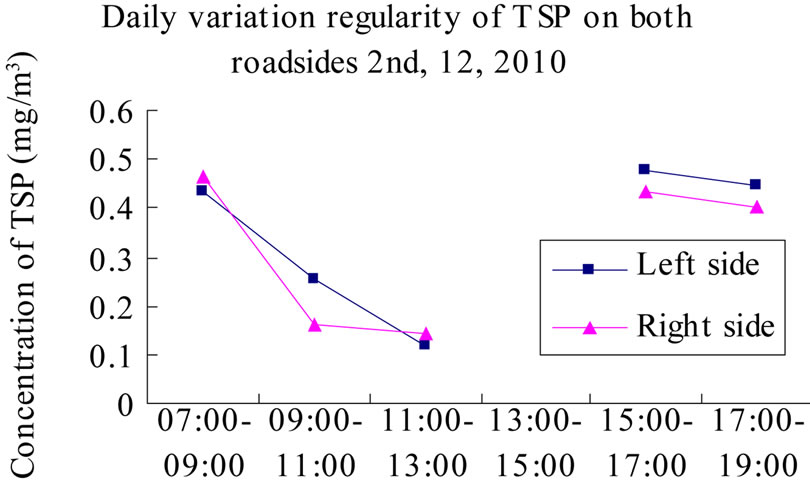

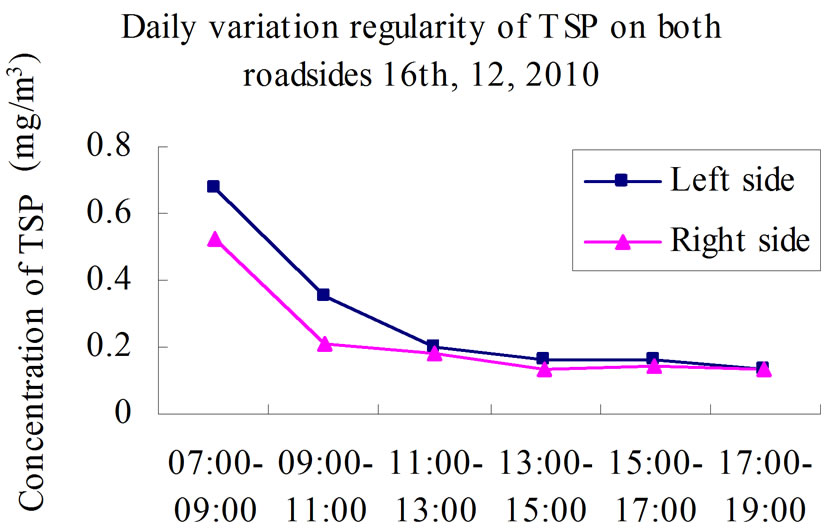
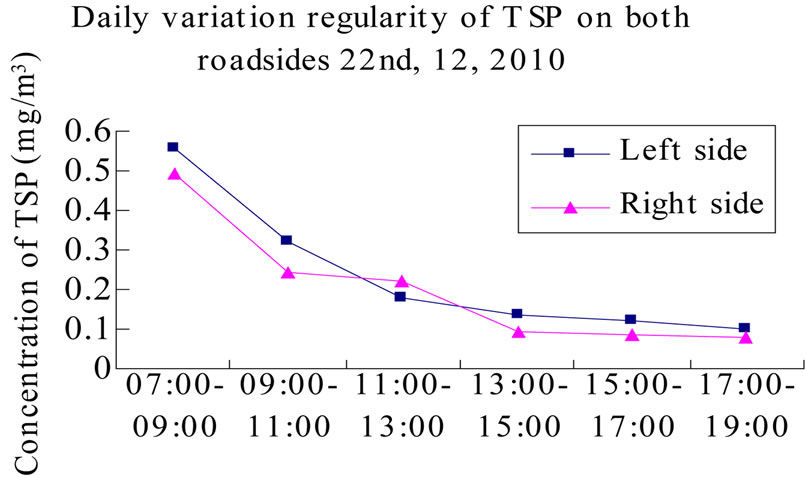
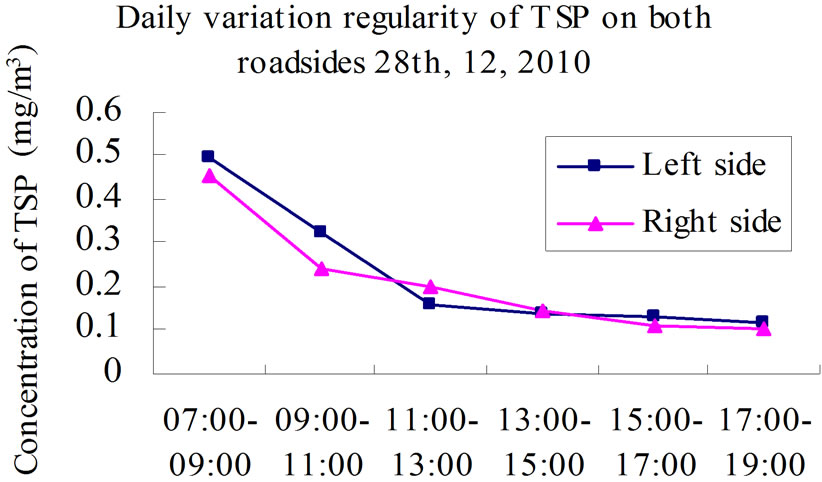
Figure 2. Daily variation of TSP concentration in each sampling day.
factors maybe the main factors influencing the variation of TSP concentration. The Shanghai-Nanjing expressway is not an urban road, but heavy traffic happens in the morning, resulting in the highest TSP concentration in the morning. Secondly, all samplings were undertaken in good weather conditions and were affected largely by temperature and solar radiation with little influence of rain. With the rise of surface temperature in the morning, the heated air near the ground begins to rise. At the same time, the pollutants also begin to rise and diffuse, so the pollutant concentration will drop with time at the daytime.
2) Variation patterns of average pollutants concentration in each month
As shown in Figure 3, the average TSP concentration on the two sides of sampling sites was 0.38141mg/m3 - 1.58766 mg/m3 in the autumn and winter. The minimum value occurred in October while the maximum in December.
The average TSP concentration of 12 hours in each month is in a descending order as December, November, and October. In December, the temperature is low with the average temperature between 5.4˚C - 6.9˚C. The cold airflows are frequent [13] and the convective air is weak. All of these are unfavorable for TSP diffusion. Besides, the heavy traffic on the Shanghai-Nanjing expressway always worsens the pollution around. On the contrary, the month of October lies in the period that summer turning to autumn. The temperature is relatively high with the average temperature of 17.1˚C [14] and the convec tive air is strong. All of these are helpful TSP diffusion so that atmosphere is less polluted.
3) Factors affecting pollution concentration
Temperature has great influence on pollution concentration in the atmosphere. When the temperature is high, there are turbulent flows and dramatic convective motions and the atmosphere is unstable. On the contrary, when the temperature is low, the atmosphere is so stable that the pollution concentration becomes high. A regression analysis was made to the measured TSP concentration on the Shanghai-Nanjing expressway. The result shows that there is little linear correlation between the TSP concentration, the temperature and the atmospheric pressure. And the logarithm correlation and the index correlation are all low as well. Table 3 shows some results with relatively high correlations.
It shows that the correlation between TSP concentration and meteorological factors is low. This is consistent in some other research conclusions [15]. The TSP concentration is affected by several factors while the meteorological factors may not be the dominate factor. With the strong randomness of meteorological factors, the TSP concentration has weak correlation with them.
5. Conclusions
With the rapid development of highway transportation, the roadside atmosphere pollution caused by traffic is widely concerned all over the world. The sources of TSP pollutants in the air near the roadside are multiple, including vehicle emission, road dust and tear-and-wear of tires. Conclusions can be drawn from analyzing the monit-
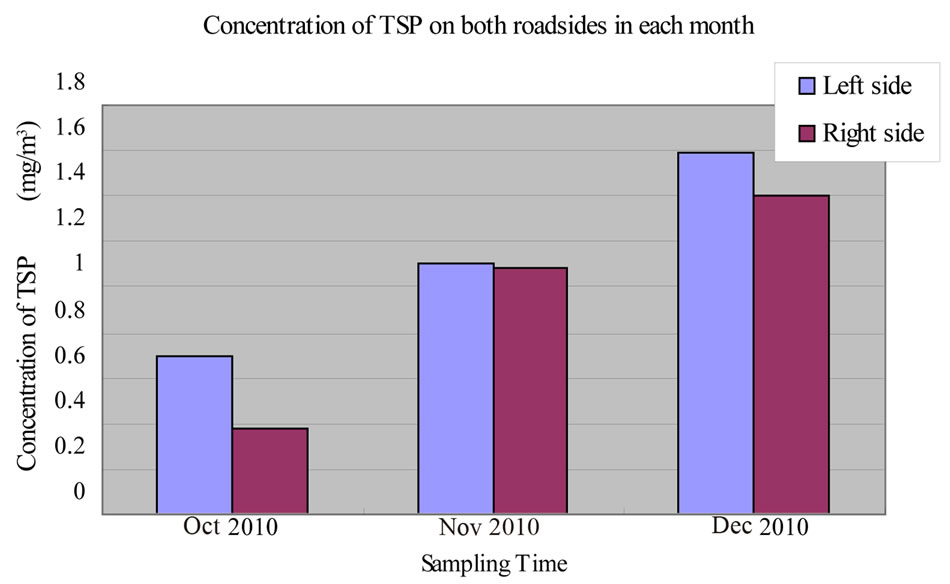
Figure 3. TSP concentration of sampling on two sides of sampling site in each month.
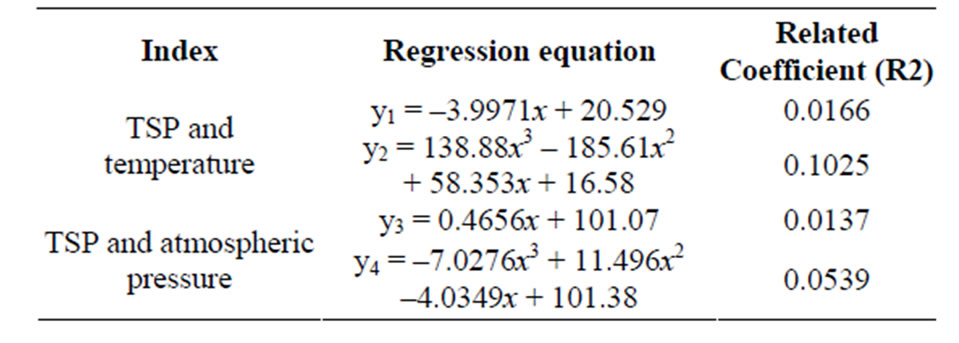
Table 3. The correlation analysis of TSP concentration and meteorological factors.
oring data of atmosphere at the site of the west exit of Shanghai-Nanjing expressway.
The TSP pollution at both sides of the Shanghai-Nanjing expressway is serious, even 6 times of the national limit of the secondary level. It is a great threat to the health of residents, agriculture and ecological safety nearby. The levels of TSP concentrations change with months, with the highest in December. The TSP concentrations are also different on both sides of the road, depending on the surrounding conditions.
The daily variation of TSP concentration is different at two sides of the monitoring site, including the time and the value of the peak concentration. The daily variation of the average TSP concentration at the two sides of the highway is on a descending order as December, November and October.
The correlation between the TSP concentration, the temperature and the atmospheric pressure of the air is weak.
6. Acknowledgements
This study was a part of “Study on the Air Pollution Characteristics on both Sides of the Highway”, which was supported by the Students Scientific and Technological Innovation Project of Nanjing Forestry University.
REFERENCES
- J. H. Li and L. F. Cao, “Analysis on Road Traffic’s Environmental Impact,” Statistics & Information Forum, Comprehensive Edition, 2001, pp. 17-19.
- H. Y. Wang, “Research on Some Problems of Highway’s Atmospheric Environmental Impact Assessment,” MD Thesis, Jinan University, Hunan, 2006, p. 1.
- USEPA, “National Air Quality and Emissions Trends Report,” United States Environmental Protection Agency, Washington DC, 1994, pp. 2, 6, 46, 52.
- N. Kunzil, R. Kaiser, S. Medina, et al., “Public-Health Impact of Outdoor and Traffic-Related Air Pollution: A European Assessment,” Lancet, Vol. 356, No. 9232, 2000, pp. 795-801.
- WHO Regional Office for Europe, “Air Quality Guide Lines for Europe,” 2nd Edition, World Health Organization, Geneva, 2001.
- X. Y. Yan and G. Du, “Atmospheric Particles Distribution Character and Analysis on Heavy Metal’s Pollution Status in Shenyang,” Environmental Protection Science, Vol. 33, 2007, pp. 20-22.
- M. Senichi and K. Takahashi, “Aerosols: Science, Industry, Health and Environment,” Pergamon Press, Oxford, 1990.
- E. G. Hermann and D. Adarsh, “Aerosols and Their Climatic Effects,” A Deepak Publishing, Hampton, 1984.
- R. J. Charlson, S. E. Schwartz, J. M. Halles, R. D. Cess, et al., “Climate Forcing by Anthropogenic Aerosols,” Science, Vol. 255, No. 5043, 1992, pp. 423-430. doi:10.1126/science.255.5043.423
- State Environmental Protection, “Monitoring and Analysis Method of Air and Waste Gases,” 4th Edition, China Environmental Sciences Press, Beijing, 2003, pp. 4-5.
- State Environmental Protection, “Ambient Air-Determination of Total Suspended Particulates-Gravimeric Method (GB/T 15432-1995),” Beijing, 1995.
- State Environmental Protection, “Ambient Air Quality Standard (GB 3095-1996),” Beijing, 1996.
- Meteorological Archives of Nanjing City, “The Evaluation on the Climate in December 2010,” 2011. http://www.njqxj.gov.cn/show.asp?id=1044
- H. Xiao and M. Tao, “Climatical Impact Assessment for October 2010,” 2010. http://www.jsmb.gov.cn/service/folder42/folder68/2010/11/06/2010-11-0620704.html
- R. Zhou, “Research on Atmospheric Environmental Impact of Huaiyan Expressway,” MD Thesis, Jinan University, Nanjing, 2008, pp. 35-38.
NOTES
*The map from Google Map.