American Journal of Analytical Chemistry
Vol.05 No.14(2014), Article ID:50327,11 pages
10.4236/ajac.2014.514099
Analytical Solutions of Nonlinear Differential Equations in the Mathematical Model for Inactivation of Nitric Oxide by Rat Cerebellar Slices
Narayanan Mehala1, Lakshmanan Rajendran2
1Department of Mathematics, K.L.N. College of Engineering, Sivagangai, India
2Department of Mathematics, The Madura College, Madurai, India
Email: mehalapaviammu@gmail.com, raj_sms@rediffmail.com
Copyright © 2014 by authors and Scientific Research Publishing Inc.
This work is licensed under the Creative Commons Attribution International License (CC BY).
http://creativecommons.org/licenses/by/4.0/


Received 28 July 2014; revised 13 September 2014; accepted 29 September 2014
ABSTRACT
A mathematical model for the inactivation of nitric oxide by rat cerebellar slices under non-steady state condition has been analyzed. This diffusion-inactivation model was used to estimate the ki- netics of NO consumption by the rat cerebellar slices. He’s Homotopy perturbation method is used to solve the first order nonlinear differential equations which describe the concentrations given by net of diffusion and inactivation by the slices. Analytical expressions for the concentration of nitric oxide have been derived for all values of parameters. The obtained analytical results are compared with the simulation results (Matlab/Scilab program) and are found to be in good agree- ment.
Keywords:
Cyclic Guanosine Monophosphate (CGMP), Inactivation, Mathematical Modeling, Nitric Oxide, Rat Cerebellar Slices

1. Introduction
Nitric oxide is an important biological regulator and is therefore a fundamental component in the fields of neuroscience, physiology and immunology. It is a diffusible free radical synthesized by a family of nitric oxide synthases (NOS) which participates in a wide range of signaling pathways in biological tissues, mediating physiological processes such as vasodilation, memory and learning, neuronal development, regulation of immune response among many others [1] - [5] . NO acts as an intracellular messenger throughout the brain. In mammals including humans, NO is an important cellular signaling molecule involved in many physiological and pathological processes [6] . It has been emerged as a biological signaling molecule, initially in the cardiovascular, nervous and immune systems [7] - [10] .
NO can cross cell membranes easily by diffusion and it is a highly reactive and unstable free radical species. Knowledge about the physiological existence of nitric oxide (NO) concentrations is essential for developing a quantitative understanding of NO signaling, for performing experiments with NO that emulate reality and for knowing whether or not NO concentrations become abnormal in disease states. Nitric oxide acts as a novel neural biological messenger and stimulates soluble guanylylcyclase by increasing the levels of cyclic guanosine 3’,5’-monophosphate (cGMP) in target cells. This mechanism is believed on by using incubated slices of cerebellum at brain in which the NO/cGMP system has been best characterized. The cerebellum is that part of the brain in which the NO system has been best studied and where the NO synthase is concentrated. It also offers the special experimental advantages of being a simple laminated structure which contains only a few cell types and of having a well-defined synaptic circuitry.
The evidence implicating NO in focal cerebral injury in mice [11] and in 7-day-old rat pups [12] had been reported during last two decades. The production of NO in a variety of intact living systems such as macrophages [13] and cerebellar slices [14] - [16] has been inferred by measuring nitrite (NO2−), nitrate (NO3−) and cyclic guanosine monophosphate (cGMP) in the absence and also in the presence of potent and selective inhibitors of NOS where nitrite and nitrate are considered as the major stable metabolites of NO under aerobic conditions and NO would activate brain guanylylcyclase, which leads to cGMP production [17] [18] . The NO-cGMP pathway has several neurophysiological roles such as synaptic plasticity, neuronal development and the modulation of membrane excitability [19] . Excessive production of NO, would cause damage by various mechanisms such as inhibition of metabolic pathways and in the presence of superoxide anions, the formation of toxic free radicals [20] [21] .
Incubated rat cerebellar slices were exposed to fixed NO concentrations and the produced cGMP response in the whole slice because of diffusion is used as an indicator of NO concentration. This diffusion-inactivation process is modelled by Hall et al. [22] under different physiological conditions by using ordinary differential equations. In this communication, the differential equations involved in the mathematical model are solved analytically, and the analytical expressions so obtained are used for calculating the quantification of cGMP response by means of predicted curves. This theoretical analysis asserts that by using different experimental values of the parameters involved in this diffusional model, the quantification of inactivation of nitric oxide can be achieved.
2. Mathematical Formation of the Problem
The overall change in the concentration of  with respect to time “t” at a particular position in the slice (x) is represented by the net of diffusion and inactivation by the slice. The inactivation process is Michaelis-Menten in nature and it is described by a first order partial differential equation [22] .
 (1)
(1)
where  is the concentration of nitric oxide, D is the diffusion coefficient of nitric oxide,
  and
and  are the Michaelis-Menten parameters. Equation (1) can be written in another way by introducing a pseudo-first order rate constant
 (2)
(2)
where
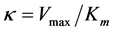 (3)
(3)
The Equation (2) is solved for the following initial and boundary conditions
 (4)
(4)
By introducing the following dimensionless parameters
 (5)
(5)
The governing nonlinear reaction/diffusion Equation (2) is expressed in the non-dimensional format as follows:
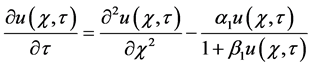 (6)
(6)
The initial and boundary conditions may be presented as follows:
 (7)
(7)
Analytical solution of Equation (6), by using the initial and boundary conditions in (7) is given by
 (8)
(8)
3. Modelling Physiological NO Profiles
3.1. Stepwise Activation of Neuronal NOS
The equation which is derived from the Michaelis-Menten equation, describes the generation of NO signal at various rates of NO synthesis and is given as follows
 (9)
(9)
where  is the rate of NO production and
  is the concentration of the nitric oxide.
The initial condition for solving Equation (9) is given by
 (10)
(10)
By applying new Homotopy approach in Equation (9) and by solving it we get the analytical solution as follows:
 (11)
(11)
where  is defined as in Equation (3). The decline of NO concentration following cessation of synthesis was derived by the following equation
 (12)
(12)
The initial condition for solving the Equation (12) is given by
 (13)
(13)
The analytical expression obtained by solving the Equation (12) using (13) is given by
 (14)
(14)
where  is the Lambert
  function [23] .
3.2. Dynamic Activation of NOS.
The rate of NO synthesis  at time t, is given by the product of the maximum activity and two exponential functions as follows:

where  and
and  are kinetic parameters. Values of maximum synthesis were used to generate NO profiles which can be calculated by finding the net of synthesis and inactivation as given in the following equation.
 (15)
(15)
By solving the above equation analytically using the condition in Equation (10), the following solution is obtained:
 (16)
(16)
where  is defined as in Equation (3).
4. Modelling NO Signals in Three Dimensions
Spatially discrete NO signaling was investigated by modelling diffusion, synthesis and inactivation in three dimensions .The relevant equation which describes the radial diffusion away from a central point, where NO synthesis is positive within boutons and zero outside them is represented as
 (17)
(17)
The corresponding initial and boundary conditions are given as follows:
 (18)
(18)
where  and
and  are constants.
The Equation (17) is reduced into the normalized form by introducing some dimensionless parameters as follows:
 (19)
(19)
The dimensionless form of the Equation (17) using Equation (19) is given by
 (20)
(20)
The boundary and initial conditions in dimensionless form are as follows:
 (21)
(21)
Now by applying Laplace transform technique, method of reduction of order and complex inversion formula for solving (20) using (21), we obtain the following analytical expression for the dimensionless concentration of nitric oxide as
 (22)
(22)
5. Quantification of cGMP Profile across the Slice
The cGMP concentration at each position across the slice can also be quantified from the Hill equation
 (23)
(23)
where ,
,  and the slope
  = 2. Calculation of cGMP concentration using the above Equation (23) allows the generation of predicted NO concentration-cGMP response curves for number of different values of kinetic parameters for cerebellar slices. From such curves, quantification of inactivation can be achieved by comparing the experimental data based on the reaction diffusion model which is described above.
6. Numerical Simulation
The non-linear differential Equations (6), (9), (12), (15) and (20) for the corresponding boundary & initial conditions in (7), (10), (13) and (21) are solved by using numerical methods. The function pdex 4 in Matlab software, which is a function for solving boundary value problems, was used to solve these equations numerically and the Matlab programs are given in supplementary material of this manuscript. Figure 1, Figures 4-7 represent the comparison of analytical results obtained in this work with the numerical results. Upon comparison it is evident that both the results are in good agreement for different values of the reaction and diffusion parameters.
 (a) (b)
Figure 1. Plot of dimensionless concentration  versus dimensionless position in the slice
  using Equations (6) and (8) for various values of the parameters (a)
  = 0.025, 0.25, 0.5, 1 & 1.5,
 ; (b)
; (b)  = 0.025, 0.25, 0, 5, 2.5 & 10,
  Solid lines represent the numerical solutions whereas dotted lines represent the analytical solutions.
7. Results and Discussion
The analytical solutions of Equations (6), (9), (12), (15) and (20) are represented by the Equations (8), (11), (14), (16) and (22) in terms of kinetic reaction and diffusion parameters. Exposure of rat cerebellar slices to several different external NO concentrations allows generation of NO concentration-cGMP response curves as described below.
Figure 1(a) indicates the concentration of nitric oxide for various values of  and for some fixed value of
  and
and . From this time dependent evolution, we infer that the concentration of nitric oxide increases with the decrease in the value of
  or the diffusion coefficient decreases. The normalized concentration becomes uniform and the curve becomes straight line when
 . In this figure the numerical results are compared with the analytical results and it is noted that there is an excellent agreement between the results which are shown by dotted lines and straight lines respectively. Figure 1(b) exhibits the nitric oxide concentration for various values of
  and for some fixed value of
  and
and . It is understood from the figure that the concentration increases along with the increase in the value of
 . Here also the comparison of analytical and numerical results shows a good agreement. It is noted that the concentration is equal to 1 for all values of
  and it remains same for all values of
 .
.
Figure 2(a) represents the plot of dimensionless concentration of nitric oxide versus the dimensionless time . The figure reveals that the concentration increases as the value of
  increases for some fixed value of the thickness of the slice
  and kinetic parameter
 . Change in diffusion occurs only when
 . For the values other than that the concentration remains same. Figure 2(b) shows that the concentration of nitric oxide increases with the decrease in the value of
 . From the figure it is evident that the concentration becomes zero for
  and when
 , it becomes 1.
Figure 3(a) and Figure 3(b) stand for the normalized concentration profiles of nitric oxide for various values of the time parameters. It should be noted the concentration increases with the decrease in time for some fixed values of the parameters  and
and . But we can witness the reverse reaction i.e., if the time increases, the concentration decreases when the values of the parameters
  and
and  are being increased to some extent.
Figure 4(a) and Figure 4(b) indicate the physiological profiles due to step-wise activation of nitric oxide and describes the generation of NO signals for some fixed value of rate of NO synthesis . In Figure 4(a) by keeping the value of
  fixed and varying the value of
 , it is observed that the concentration increases with the decrease in the value of
  but in Figure 4(b) the value of
  is fixed and by varying
 , an increase in the value of concentration is noted as the value of
  increases.
Figure 5(a) and Figure 5(b) also present the physiological NO profiles due to step wise activation of nitric oxide and exhibit the decline of NO concentration following cessation of synthesis. In Figure 5(a), by keeping the value of  fixed and by increasing the value of
 , it is noted that the concentration of NO also increases and it is worth mentioning that after 0.5 minutes there is no significant difference is noted and the concentration attains its steady state value. But in Figure 5(b), the value of
  is fixed and by varying the value of
 , it is understood that along with the decrease in the value of
 , the value of concentration increases
 (a) (b)
Figure 2. Plot of dimensionless concentration  versus dimensionless time
  using Equation (8) for various values of parameters (a)
  = 1000, 100, 10, 1, 0.1 & 0.01 and
 ,
,  (b)
(b)  = 0.01, 0.1, 1, 5, 10 &100 and
 ,
, .
.
 (a) (b)
Figure 3. Plot of dimensionless concentration  versus dimensionless thickness of the slice
  for various values of the time parameters
  using Equation (8) where (a)
 ,
,  and (b)
  and
and .
.
 (a) (b)
Figure 4. Plot of concentration profiles of Nitric oxide  versus time for various values of the parameters using Equations (9) and (11). Solid lines represent the numerical solutions whereas the dotted lines represent the analytical solutions.
 (a) (b)
Figure 5. Plot of concentration of nitric oxide  versus time for various values of the parameters using Equations (12) and (14). Solid lines represent the numerical solutions whereas the dotted lines represent analytical solutions when (a)
 ; (b)
; (b) .
.
and it attains its steady state before 1 minute. In both the Figure 5(a) and Figure 5(b) it is obvious that there is an excellent agreement between the analytical and numerical results.
Figures 6(a)-(d) exhibit the physiological profiles due to dynamic activation of NO. From these figures it is observed that the rapid rise and fall of the NO concentration due to NO synthesis and inactivation implies that the local NO concentration should faithfully follow even very brief periods of NO formation. In Figure 6(a) by increasing the value of , it is observed that the produced curves will converge close to the experimental data and slopes will be steepened considerably. Figure 6(b) and Figure 6(c) exhibit the cGMP response curves produced as a result of dynamic activation of NO for fixed values of
 ,
,  and for various values of kinetic parameters
  (rate of NO synthesis). Varying the value of
  (0.1 nM - 1 nM) by fixing the value of
 , a family of curves will be generated which converge around 1 nM as in Figure 6(d). From the Figures 6(a)-(d), it is instructive that the fall of NO synthesis occurs only after 1 minute.
Figure 7(a) represents the radial diffusion of Nitric oxide for various values of the dimensionless parameter  and for some fixed values of
  and
and . This observation implies that the shape of the plot changes as the value of the parameter changes. Here it is noted that the concentration increases gradually with the decrease in the value of
 . Hence for small values of
  it can be predicted that the normalized concentration should vary linearly with the reaction diffusion parameter
  and it attains its steady state. In Figure 7(b) the concentration profiles corresponding to a fixed value of
  are presented by keeping time as a constant parameter. Virtually there is a gradual increase in the concentration as the value of the parameter
  increases and it becomes 1 for values of
 . In both the Figure 7(a) and Figure 7(b), it is witnessed that there is an excellent agreement between the analytical and numerical results.
In Figure 8(a) the situation corresponding to  and
and  is graphically exhibited. The rapid diffusion of nitric oxide results in steady-state cGMP levels within 1 minute. It is obvious from the figure that the concentration increases steadily with the increase in the value of
 . Alternatively in Figure 8(b) the situation pertaining to
  and
and  is presented. Here it is noted that the diffusion of nitric oxide increases with the decrease in the value of
 .
.
 (a) (b)
 (c) (d)
Figure 6. (a)-(d) Plot of concentration profiles of Nitric oxide  versus time for various values of the kinetic reaction and diffusion parameters using Equations (15) and (16). Solid lines represent the numerical solutions whereas the dotted lines represent the analytical solutions.
 (a) (b)
Figure 7. Plot of dimensionless concentration  versus dimensionless radius
  using Equations (20) and (22) for various values of the parameters (a)
  = 5, 10, 15, 20 & 50 and
 ,
,  (b)
(b)  = 1, 3, 5, 7 & 9 and
  &
& . Solid lines represent the numerical solutions whereas the dotted lines represent the analytical solutions.
 (a) (b)
Figure 8. (a) Plot of dimensionless concentration profiles of Nitric oxide  versus dimensionless time
  using equation (22) for various values of (a)
  = 50, 60, 70, 80, 100 and for
 ,
,  (b)
(b)  = 1, 5, 10, 15, 20 and for
 ,
, .
.
Figure 9(a) and Figure 9(b) represent the family of NO concentration-cGMP response curves that have been generated by using Hill’s equation and by varying the values of the reaction and diffusion parameters  and
and . From Figure 9(a) it is evident that the cGMP concentration decreases with the value of
  and Figure 9(b) shows that the cGMP response will start to decrease as the value of
  increases.
8. Conclusion
The analysis which has been done on the inactivation of NO in rat cerebellar slices is theoretical in nature. Time dependent nonlinear differential equations involved in the mathematical model which depict the physiological NO profiles due to stepwise, dynamic inactivation and also the three dimensional radial diffusion of nitric oxide, are solved analytically and a good agreement between theoretical predictions and numerical results is observed for various kinetic parameters. Using these analytical results, the quantification of nitric oxide consumption due to diffusion (parameter ) in brain cerebellar slices can be done. The theoretical model described here can be used to make number of predictions about NO-cGMP pathways which will be helpful for the future functional studies based on anatomical observations and also should lead to greater understanding of the role of NO in the nervous system.
 (a) (b)
Figure 9. Plot of dimensionless cGMP concentration versus time for various values of the parameters  when
when  using Equations (8) and (23).
Acknowledgements
The authors are thankful to Dr. Murali, The Principal, The Madura College, Madurai, and The Secretary, The Madura College Board, Madurai for their encouragement and also to Dr. A.V. Ram Prasath, The Principal, K. L. N. College of Engineering, Sivagangai for his valuable support.
References
- Coleman, J.W. (2001) Nitric Oxide in Immunity and Inflammation. International Immunopharmacology, 1, 1397-1406. http://dx.doi.org/10.1016/S1567-5769(01)00086-8
- Furchgott, R.F. (1999) Endothelium-Derived Relaxing Factor: Discovery, Early Studies and Identification as Nitric Oxide. Bioscience Reports, 19, 235-251. http://dx.doi.org/10.1023/A:1020537506008
- Garthwaite, J. (2008) Concepts of Neural Nitric Oxide-Mediated Transmission. European Journal of Neuroscience, 27, 2783-2802. http://dx.doi.org/10.1111/j.1460-9568.2008.06285.x
- Steinert, J.R., Chernova, T. and Forsythe, I.D. (2010) Nitric Oxide Signalling in Brain Function, Dysfunction, and De- mentia. Neuroscientist, 16, 435-452. http://dx.doi.org/10.1177/1073858410366481
- Thomas, D.D., Ridnour, L.A., Isenberg, J.S., et al. (2008) The Chemical Biology of Nitricoxide: Implications in Cellular Signaling. Free Radical Biology & Medicine, 45, 18-31. http://dx.doi.org/10.1016/j.freeradbiomed.2008.03.020
- Hou, Y.C., Janczuk, A. and Wang, P.G. (1999) Current Trends in the Development of Nitric Oxide Donors. Current Pharmaceutical Design, 5, 417-441.
- Palmer, R.M., Ferrige, A.G. and Moncada, S. (1987) Nitric Oxide Release Accounts for the Biological Activity of En- dothelium-Derived Relaxing Factor. Nature, 327, 524-526. http://dx.doi.org/10.1038/327524a0
- Ignarro, L.J., Buga, G.M., Wood, K.S., Byrns, R.E. and Chaudhuri, G. (1987) Endothelium Derived Relaxing Factor Produced and Released from Artery and Vein Is Nitricoxide. Proceedings of the National Academy of Science of USA, 84, 9265-9269. http://dx.doi.org/10.1073/pnas.84.24.9265
- Garthwaite, J., Charles, S.L. and Chess-Williams, R. (1988) Endothelium-Derived Relaxing Factor Release on Activation of NMDA Receptors Suggests Role as Intercellular Messenger in the Brain. Nature, 336, 385-388. http://dx.doi.org/10.1038/336385a0
- Marletta, M.A., Yoon, P.S., Iyengar, R., Leaf, C.D. and Wishnok, J.S. (1988) Macrophage Oxidation of L-Arginine to Nitrite and Nitrate: Nitric Oxide Is an Intermediate. Biochemistry, 27, 8706-8711. http://dx.doi.org/10.1021/bi00424a003
- Nowicki, J.P., Duval, D., Poignet, H. and Scatton, B. (1991) Nitric Oxide Mediates Neuronal Death after Focal Ischemia in the Mouse. European Journal of Pharmacology, 204, 339-340. http://dx.doi.org/10.1016/0014-2999(91)90862-K
- Trifiletti, R.R. (1992) Neuroprotective Effects of NG-Nitro-L-Arginine in Focal Stroke in the 7-Day-Old Rat. European Journal of Pharmacology, 218, 197-198. http://dx.doi.org/10.1016/0014-2999(92)90168-4
- Marletta, M.A. (1989) Nitric Oxide: Biosynthesis and Biological Significance. Trends in Biochemical Sciences, 14, 488-492. http://dx.doi.org/10.1016/0968-0004(89)90181-3
- East, S.J. and Garthwaite, J. (1991) NMDA Receptor Activation in Rat Hippocampus Induces Cyclic GMP Formation through the L-Arginine-Nitric Oxide Pathway. Neuroscience Letters, 123, 17-19. http://dx.doi.org/10.1016/0304-3940(91)90147-L
- Garthwaite, J., Garthwaite, G., Palmer, R.M.J. and Moncada, S. (1989) NMDA Receptor Activation Induces Nitric Oxide Synthesis from Arginine in Rat Brain Slices. European Journal of Pharmacology, 172, 413-416. http://dx.doi.org/10.1016/0922-4106(89)90023-0
- Southam, E., East, E.J. and Garthwaite, J. (1991) Excitatory Amino Acid Receptors Coupled to the Nitric Oxide/Cyclic GMP Pathway in Rat Cerebellum during Development. Journal of Neurochemistry, 56, 2072-2081. http://dx.doi.org/10.1111/j.1471-4159.1991.tb03468.x
- Arnold, W.P., Mittal, C.K., Katsuki, S. and Murad, F. (1977) Nitric Oxide Activates Guanylate Cyclase and Increases Guanosine 3’:5’-Cyclic Monophosphate Levels in Various Tissue Preparations. Proceedings of the National Academy of Sciences of the United States of America, 74, 3203-3207. http://dx.doi.org/10.1073/pnas.74.8.3203
- Miki, N., Kawabe, Y. and Kuriyama, K. (1977) Activation of Cerebral Guanylate Cyclase by Nitric Oxide. Biochemical and Biophysical Research Communications, 75, 851-856.
- Hall, C.N. and Garthwaite, J. (2005) Trans-Synaptic Signaling by Nitric Oxide. In: Ludwig, M., Ed., Dendritic Neurotransmitter Release, Springer, New York, 283-300.
- Moncada, S., Palmer, R.M. and Higgs, E.A. (1991) Nitric Oxide: Physiology, Pathophysiology, and Pharmacology. Pharmacological Reviews, 43, 109-142.
- Nathan, C. (1992) Nitric Oxide as a Secretory Product of Mammalian Cells. Journal of the Federation of American Societies for Experimental Biology, 6, 3051-3064.
- Hall, C.N. and Garthwaite, J. (2006) Inactivation of Nitric Oxide by Rat Cerebellar Slices. Journal of Physiology, 577, 549-567.
- Vazquez-Leal, H., Filobello-Nino, U., Yildirim, A., Hernandez-Martinez, L., Castaneda-Sheissa, R., Sanchez-Orea, J., Molinar-Solis, J.E. and Diaz-Sanchez, A. (2012) Transient and DC Approximate Expressions for Diode Circuits. IEICE Electronics Express, 9, 522-530. http://dx.doi.org/10.1587/elex.9.522
Nomenclature and Units
Symbols Description Units
 Concentration of nitric oxide
 Diffusion coefficient
 Maximum velocity
 Michealis Menten constant
 First order rate constant
 Position in the slice
 Time
Time
 Rate of NO production
 Rate of NO synthesis
 Kinetic parameters
 Radius of the Bouton
 Dimensionless time None
 Normalized concentration of NO None
 Dimensionless distance None
 Dimensionless radial distance None
 Kinetic parameters of reaction and diffusion None