American Journal of Analytical Chemistry
Vol.5 No.6(2014), Article ID:45159,5 pages DOI:10.4236/ajac.2014.56045
Docosahexaenoic Acid Ester Degradation Measured by FTIR-ATR with Correlation Spectroscopy
Ronald A. Holser
Quality and Safety Assessment, Russell Research Center, United States Department of Agriculture, Agricultural Research Service (USDA-ARS), Athens, USA
Email: Ronald.Holser@ars.usda.gov
Copyright © 2014 by author and Scientific Research Publishing Inc.
This work is licensed under the Creative Commons Attribution International License (CC BY).
http://creativecommons.org/licenses/by/4.0/


Received 27 February 2014; revised 31 March 2014; accepted 7 April 2014
ABSTRACT
Highly unsaturated fatty acids such as docosahexaenoic acid and linolenic acid are prone to oxidation with a resulting loss of bioactivity and generation of malodorous degradation compounds. Degradation proceeds by formation of the corresponding hydroperoxyl free radical with subsequent oxidative cleavage at the double bond site. FTIR-ATR was used to detect degradation through spectral changes that were correlated to oxidative degradation. The spectrometer was equipped with a heated stage so that a series of spectra could be collected while the sample was exposed to elevated temperatures. The appearance of new bands at 972.8 cm−1, 2934 cm−1, and 3498 cm−1 with the disappearance of bands at 703.6 cm−1 and 3013 cm−1 were observed after heating and these spectral changes were evaluated by correlation spectroscopy analysis. These results provide a method to quickly detect the oxidative degradation of polyunsaturated fats. This approach is expected to be applied for the quality assessment of feed formulations fortified with omega-3 fatty acids.
Keywords:Correlation Spectroscopy, Infrared Spectroscopy, Polyunsaturated Acid, Linolenic Acid

1. Introduction
The polyunsaturated fatty acids such as docosahexaenoic acid (DHA) and linolenic acid (ALA) are finding applications in food and feed formulations due to their associated health benefits [1] [2] . However, these compounds are susceptible to auto-oxidation that results in structural degradation, reduced bioactivity, and generation of malodorous degradation products [3] [4] .
The most common degradation products generated from unsaturated fatty acid oxidation are aldehydes, ketones, alcohols, and carboxylic acids [5] . These compounds result from cleavage that occurs at unsaturated bond sites. The mixture of oxidation products may be analyzed by instrumental methods such as gas chromatography with mass selective detectors [6] . These methods are very sensitive but require skilled technicians and costly equipment. Sample preparation and analysis time can also be significant. Alternative methods are based on colorimetric or spectroscopic techniques [7] . The aldehydes, for example, generally do not contain strong chromophores but can be derivatized by reaction with 1-methyl-2-phenylindole and then detected [8] . The biochemically important unsaturated oxidation product, 4-hydroxy nonenal, exhibits absorbance in the ultraviolet (UV) range and may be measured by high performance liquid chromatography using a UV detector [9] .
The current investigation was undertaken to explore the use of mid-range infrared spectroscopy to detect changes associated with fatty acid degradation. Of particular interest are differences in absorbance between the carbonyl groups of carboxylic acids or esters and aldehydes. Distinguishing spectral characteristics of these compounds include the frequency of absorption due to C=O stretching, absorption due to C-O stretching for acids and esters, and absorption due to the O-H stretch of acids or alcohols. The presence and location of these spectral features could be used as the basis for a rapid analysis. The application of Fourier Transform Infrared Spectroscopy (FTIR) with Attenuated Total Reflectance (ATR) was examined as a method to detect the oxidation products of polyunsaturated acids. This technique can be used on solid or liquid samples with little preparation and requires a very small sample size. It is also a nondestructive method so that the sample could be recovered.
2. Experimental
2.1. Materials
Methyl docosahexaenate (98%) and methyl linolenate (99%) were purchased from Sigma-Aldrich (St. Louis, MO, USA). These materials were used as received.
2.2. Spectroscopy
Spectra were collected with a Tensor 27 FT-IR system (Bruker Optics, Billerica, MA) equipped with a 300 Golden Gate diamond ATR and a temperature controller (Specac, Ltd., London, England). Samples were scanned over the range 4000 - 600 cm−1 at a resolution of 4 cm−1. The spectrum of each sample was the result of 128 co-added scans. The instrument was controlled by OPUS v 5.0 software. A drop of the sample was placed onto the ATR crystal and repeatedly scanned at ten minute intervals while the temperature was increased from 25˚C to 120˚C at 1˚C/min. The sample was maintained at this temperature for up to 10 hours while spectra were collected. Spectra were analyzed using Grams/AI v 8.0 (Thermo Fisher Corp., Waltham, MA, USA). Spectra were baseline and offset corrected prior to analysis. Two-dimensional correlation analysis was performed with the array basic program 2DGen in Grams/AI. Synchronous and asynchronous correlation maps were produced from spectra collected at initial, intermediate, and final times and temperatures.
3. Results and Discussion
Spectra of DHA and ALA methyl esters are shown in Figures 1 and 2, respectively, collected at the start of the experiment and after heating to 120˚C. Prior to the heat treatment both fatty acid esters exhibited the characteristic carbonyl stretching band at 1740 cm−1. Additional strong bands were observed at 703.6 cm−1, 1160 cm−1, 1436 cm−1, 2964 cm−1, and 3013 cm−1 for methyl DHA and at 717.6 cm−1, 1170 cm−1, 1435.9 cm−1, 2928.5 cm−1, 2855.2 cm−1, and 3011.2 cm−1 for methyl ALA. After the temperature reached 120˚C the esters showed several spectral changes were associated with oxidative degradation. The carbonyl stretch has shifted to a lower frequency, from 1740 cm−1 to near 1730 cm−1, which is more typical of an aldehyde than an ester.
New bands appeared in the spectrum of methyl DHA at 972.8 cm−1, 2934 cm−1, and 3498 cm−1 while previous bands at 703.6 cm−1 and 3013 cm−1 are no longer observed. Similar spectral changes were seen with methyl ALA (Figure 2).
Longer heating times produced no additional major changes in the spectra (Figure 3).
Analysis of these spectral changes was performed by correlation spectroscopy to identify the most highly cor-
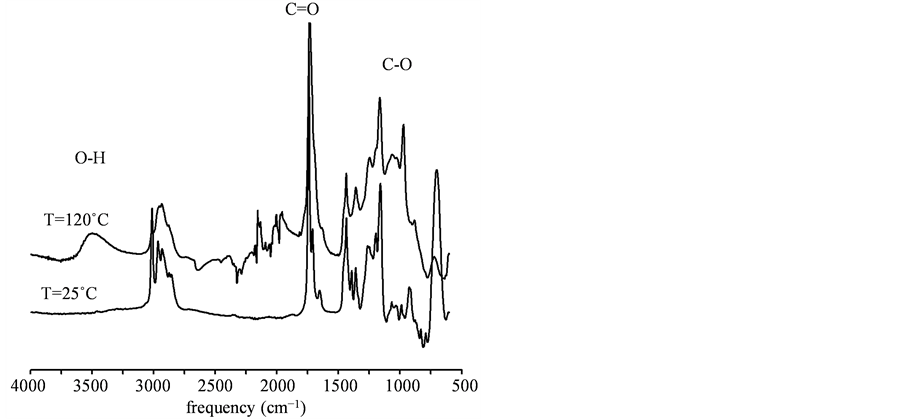
Figure 1. Spectra of DHA methyl ester at 25˚C and 120˚C.
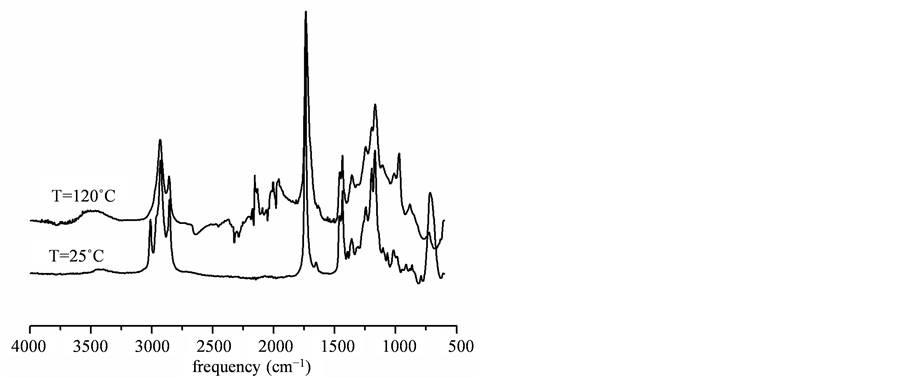
Figure 2. Spectra of ALA methyl ester at 25˚C and 120˚C.
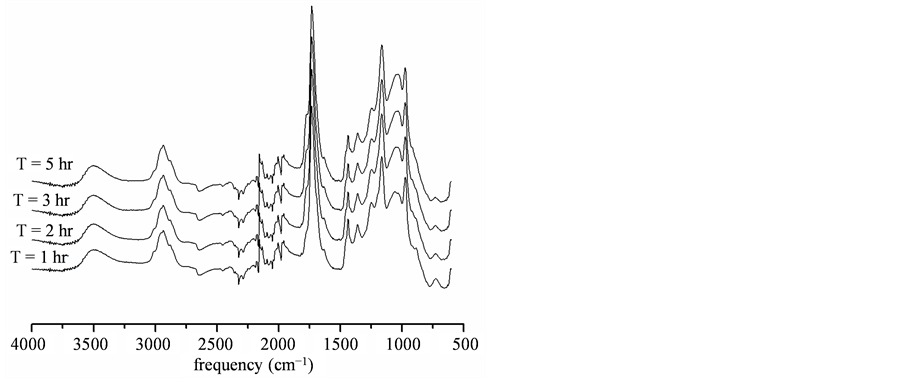
Figure 3. Time series of DHA methyl ester heated at 120˚C.
related regions that could be used as the basis for a screening procedure to identify degradation of DHA or ALA esters [10] [11] . Correlation maps were prepared to evaluate the feasibility of using the selected bands to predict degradation in products fortified with these polyunsaturated fatty acids. The results are shown in Figures 4 and 5 as contour plots where the correlated regions appear at the intersection points along a diagonal line from the origin. Figure 4 displays the synchronous map obtained from the analysis of spectra obtained while heating the DHA methyl ester. The regions that are correlated include: 3000 cm−1, 1710 cm−1, 1170 - 970 cm−1, 750 - 650 cm−1. These are listed in increasing order. The magnitudes of the cross-peaks at 3000 cm−1 and 1710 cm−1 are equal and approximately half the magnitude of the cross-peak centered at 700 cm−1. This analysis indicates that the regions between 1170 - 970 cm−1 and 750 - 650 cm−1 provide the strongest correlations and would be selected for subsequent chemometric model development.
The results for the analysis of the spectra obtained from the ALA methyl esters are shown in Figure 5. The strongest correlations are also identified in the regions centered at 1000 cm−1 and 700 cm−1.
This correlation analysis provided values that could be used in a chemometric model to automate the interpretation of spectral data. It is anticipated that this approach can be applied for quality assessments on products such as animal feeds that have been fortified with DHA or ALA.
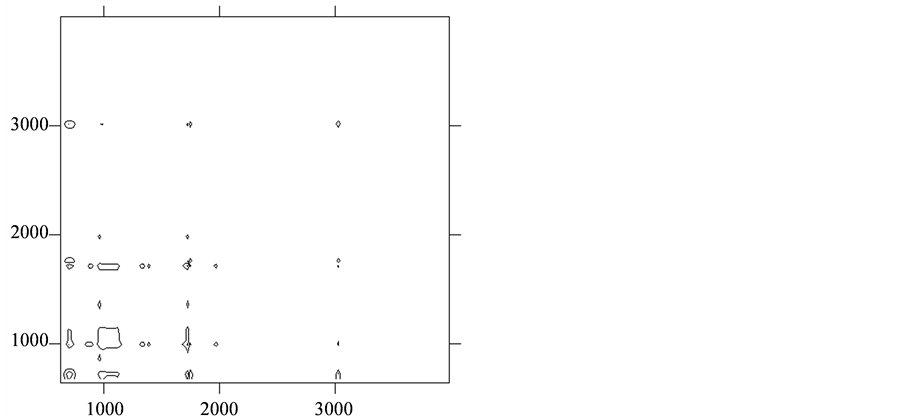
Figure 4. Synchronous plot of DHA methyl ester spectra.
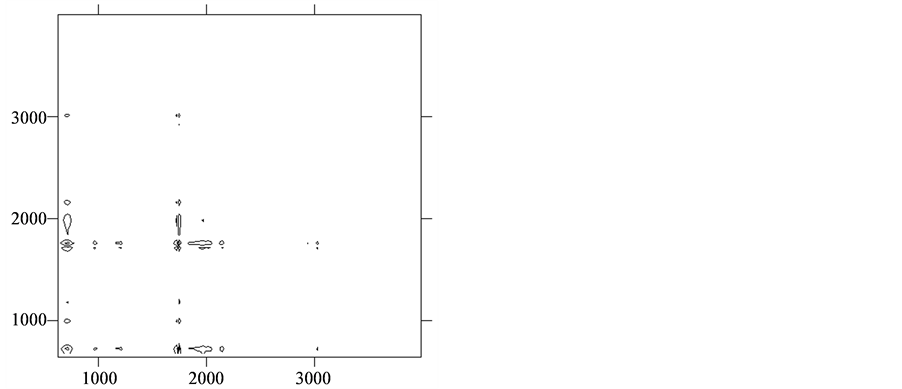
Figure 5. Synchronous plot of ALA methyl ester spectra.
4. Conclusion
The experimental results demonstrated that spectral changes associated with the degradation of DHA and ALA methyl esters could be detected by FTIR-ATR. Visual interpretation of the spectra showed a shift of the carbonyl absorption band from 1740 cm−1 to 1730 cm−1 and the appearance of a broad band centered at 3500 cm−1 that would be consistent with hydroxyl absorption. However, the frequencies that showed the strongest correlation to oxidative degradation were determined from synchronous correlation maps to be 1170 - 970 cm−1 and 750 - 650 cm−1. These regions could be used to develop a rigorous chemometric model for the rapid assessment of oxidative degradation of DHA and ALA esters.
Acknowledgements
The author is grateful for the technical support of N. Ito and B. U. Narang.
References
- Leaf, A. (1990) Cardiovascular Effects of Fish Oils. Beyond the Platelet. Circulation, 82, 624-628. http://dx.doi.org/10.1161/01.CIR.82.2.624
- Tapiero, H., Nguyen Ba, G., Couvreur, P. and Tew, K.D. (2002) Polyunsaturated Fatty Acids (PUFA) and Eicosanoids in Human Health and Pathologies. Biomedicine and Pharmacotherapy, 56, 215-222. http://dx.doi.org/10.1016/S0753-3322(02)00193-2
- Wood, J.D., Richardson, R.I., Nute, G.R., Fisher, A.V., Campo, M.M., Kasapidou, E., Sheard, P.R. and Enser, M. (2004) Effects of Fatty Acids on Meat Quality: A Review. Meat Science, 66, 21-32. http://dx.doi.org/10.1016/S0309-1740(03)00022-6
- Schauenstein, E. (1967) Autoxidation of Polyunsaturated Esters in Water: Chemical Structure and Biological Activity of the Products. Journal of Lipid Research, 8, 417-428.
- Kawai, Y., Takeda, S. and Terao, J. (2007) Lipidomic Analysis for Lipid Peroxidation-Derived Aldehydes Using Gas Chromatography-Mass Spectrometry. Chemical Research in Toxicology, 20, 99-107. http://dx.doi.org/10.1021/tx060199e
- Esterbauer, H. and Zollner, H. (1989) Methods for Determination of Aldehydic Lipid Peroxidation Products. Free Radical Biology and Medicine, 7, 197-203. http://dx.doi.org/10.1016/0891-5849(89)90015-4
- Johnston, J.W., Horne1, S., Harding, K. and Benson, E.E. (2007) Evaluation of the 1-Methyl-2-Phenylindole Colorimetric Assay for Aldehydic Lipid Peroxidation Products in Plants: Malondialdehyde and 4-Hydroxynonenal. Plant Physiology and Biochemistry, 45, 108-112. http://dx.doi.org/10.1016/j.plaphy.2007.01.011
- Lang, J., Celotto, C. and Esterbauer, H. (1985) Quantitative Determination of the Lipid Peroxidation Product 4-Hydroxynonenal by High-Performance Liquid Chromatography. Analytical Biochemistry, 150, 369-378. http://dx.doi.org/10.1016/0003-2697(85)90525-1
- Sasic, S., Morimoto, M., Otsuka, M. and Ozaki, Y. (2005) Two-Dimensional Correlation Spectroscopy as a Tool for Analyzing Vibrational Images. Vibrational Spectroscopy, 37, 217-224. http://dx.doi.org/10.1016/j.vibspec.2005.02.011
- Muika, B., Lendl, B., Molina-Diaz, A., Valcarcel, M. and Ayora-Canada, M.J. (2007) Two-Dimensional Correlation Spectroscopy and Multivariate Curve Resolution for the Study of Lipid Oxidation in Edible Oils Monitored by FTIR and FT-Raman Spectroscopy. Analytica Chimica Acta, 593, 54-67. http://dx.doi.org/10.1016/j.aca.2007.04.050
- Noda, I. (2008) Recent Advancement in the Field of Two-Dimensional Correlation Spectroscopy. Journal of Molecular Structure, 883/884, 2-26. http://dx.doi.org/10.1016/j.molstruc.2007.11.038