American Journal of Analytical Chemistry
Vol.4 No.10(2013), Article ID:37800,7 pages DOI:10.4236/ajac.2013.410068
Electrochemical Study of Cadmium (II) Complexation with Cysteine
1Hydrometeorological Service of Macedonia, Skopje, Macedonia
2Rudjer Bošković Institute, Division for Marine and Environmental Research, Zagreb, Croatia
3Department of Chemistry, University of Prishtina, Prishtina, Kosovo
Email: *tahir.arbneshi@uni-pr.edu
Copyright © 2013 Sheriban Ramani et al. This is an open access article distributed under the Creative Commons Attribution License, which permits unrestricted use, distribution, and reproduction in any medium, provided the original work is properly cited.
Received June 23, 2013; revised July 24, 2013; accepted August 15, 2013
Keywords: Cysteine; Cadmium-Cysteinate Complex; Prepeak; Mass Balance Equations; Stoichiometric Stability Constants; Differential Pulse (DP) Excitation Mode
ABSTRACT
The complexation of Cd with cysteine has been investigated at pH ~9, and in constant ionic medium 0.59 M NaNO3 and borate buffer. Reduction signals of the hydrated Cd2+ and Cd-cysteinate complex were resolved on the potential scale during amperometric titration of 2 × 10⁻⁶ M Cd2+ with cysteine and cysteine with Cd2+, in a differential pulse (DP) mode on HMDE. The 1:1 molar ratio of Cd2+ to cysteine, and cysteine to Cd2+, was defined for Cd-cysteinate complex formed under the defined conditions. The appearance of the prepeak on the Cd-cysteinate reduction signal is showed, as the result of cysteine adsorption in reduced form. From the mass balance equations, the stoichiometric stability constants of Cd-cysteinate complex were calculated. Under various experimental conditions, comparable log K values were obtained. The grand average log K = 7.83 M−1 refers to 0.59 M ionic strength and 23˚C.
1. Introduction
Metals may be bound to active sites of enzymes, stabilize the macromolecular structure of proteins and affect enzymes or membranes during the cellular metabolism. In living organisms, toxic metal ions could specifically bind to biologically important molecules during their uptake, transportation and storage [1].
At the cellular level, toxic effects of metals are caused by their direct binding or by exchanging the essential metals at the biologically important molecules. Cysteine, as an essential amino acid, has a pivotal role in the endogenous detoxication mechanisms and in the redox chemistry at the cellular level. In many proteins, the cysteine residues are positioned on protein surfaces and often are integral components of protein tertiary structure. The sulfhydryl group of low molecular thiols including cysteine is reactive and is often found conjugated to metal ions via its sulfhydryl group [2]. As a B type of cation [3], cadmium has a high affinity for sulphur containing ligands and functional groups. Under physiological conditions [4], the sulphydryl group on a cysteine molecule is chemically the most reactive site of the proteins. The interaction between cadmium and cysteine strongly depends on the extent of proton dissociation of cysteine molecule, and hence on the pH of the solution. Despite the existence of some papers on the complexation of heavy metals by thios, there is a scarcity of data on Cdcysteine complexes. In most cases, potentiometric techniques were used under experimental conditions where a precipitate was formed. Walker and Williams [5] reported that at 25˚C and in 3.0 M NaClO4 the Cd (ІІ)- cysteinate complex precipitates even at the concentration of ~10−3 M. They have interpreted the potentiometric results with the formation of two complexes, CdL and CdL2; the logarithm of overall stability constants log β = 12.88 and 19.63, respectively. Cole et al. [1] reported that only in the pH range from 5.0 to 7.5, cadmium forms insoluble complex with the cysteine. Thus, the complex formation could be studied beyond that pH range.
In order to avoid the precipitation of Cd-mercapto complexes, it is necessary to perform complexation study at as low concentration level of the reactants as possible by means of the technique that is selective and sensitive for metal species characterisation. Complexation at lower level of Cd2+ (around 1 × 10⁻⁵ M) with SH-containing ligands like L-cysteine, glutathione, and N-acetyl-cysteine-methylamid has been studied by differential pulse polarography, in Tris-buffer, pH = 9.1 [6]. The authors estimated the overall stability constants of the Cd-thiol complexes from the competitive reactions with a ligand of known stoichiometry. For the displacement of Cd from the thiol complexes Wagner Ross et al. [6] used nitrilotriacetic acid (NTA).
The aim of our study was to apply species sensitive technique and select those measuring conditions which will directly enable to quantify the complex formation, at low concentration level of the reactants, cadmium and cysteine Further aim is to fully understand the stoichiometry of complex formation, the mechanism of electrochemical reactions, in addition, based on the mass balance of cadmium and cysteine, calculate the stoichiometric stability constants of Cd-complex under the defined conditions.
2. Experimental
2.1. Chemicals, Reagent and Solutions
For the study the following chemicals were used: CdCl2 × H2O extra pure product of Merck; L-cysteine—free base, Sigma Chemical; NaNO3, H3BO3, NaOH, KCl were Suprapur® from Merck, and N2 extra pure 99,999%, Messer.
For solution preparation E-pure water was used having electric resistance 18.2 MΩ/cm. As the supporting electrolyte, 0.59 M NaNO3 was used buffered with 0.071 M H3BO3 and 0.0296 M NaOH to pH 9.
2.2. Apparatus
Amperometric titrations were performed on Computrace 797 VA by Methrom with a Hanging Mercury Drop Electrode (HMDE) as working electrode, surface area A = 0.278 mm2 when mercury drop size was selected as 4. Counter electrode was a platinum tip and reference electrode was Ag/AgCl/3 M KCl. The polarographic cell of 50 ml volume was made off quartz. The experiments were done at room temperature, i.e. at (23˚C ± 1˚C).
Procedures
Differential pulse (DP) excitation mode was selected with the modulation amplitude 0.025 V, scan rate 0.005 V/s, drop time 0.5 s. The negative potential scan started at −0.45 V. Before the measurements the solution was thoroughly deaerated with nitrogen. During the measurements the nitrogen passed over the solution.
3. Results and Discussion
3.1. Cd-Cysteinate Complex Formation
After preliminary studies, the optimal experimental conditions were selected to follow up and quantify the formation of Cd-cysteinate complex. They comprise a differential pulse (DP) reduction mode on a hanging mercury drop electrode (HMDE), in 0.59 M NaNO3, pH ~9.
At low level of reactants, the titration of defined Cd2+ concentration proceeds with the increasing cysteine concentrations up to 1:1 and 1:2 molar ratio of Cd to cysteine.
The titration of 2 × 10⁻⁶ M Cd2+ with cysteine, performed in both DP and differential pulse anodic stripping voltammetry (DPASV) modes, indicated that Cd-cysteinate complex is irreversibly reduced. Therefore, in a DPASV mode, no formation of Cd-cysteinate complex could be observed, contrary to DP reduction mode.
Direct titration of a defined Cd2+ concentration with the cysteine was performed in the polarographic cell. At 2 × 10⁻⁶ M Cd2+ the signal at −0.60 V recorded in a DP mode is assigned to the reduction of the hydrated Cd2+ (Figure 1, curve 1). By successive addition of cysteine solution in the concentration range from 2.5 × 10⁻⁷ M to 4 × 10⁻⁶ M different molar ratios of metal to ligand were attained. After each ligand addition solution was purged with N2 for 25 minutes. After the cysteine addition two signals were recorded, the first one at −0.60 V for hydrated Cd2+ and the second of Cd-cysteinate complex, reduced at −0.692 V which gradually shifted to −0.743 V, if cysteine was added up to 4 × 10⁻⁶ M (Figure 1). Addition of cysteine to Cd2+ solution results in a decrease of the peak of the hydrated Cd2+ and the appearance of Cdcysteinate complex, which peak current increases as the cysteine concentration increases, too. At 1:1 molar ratio of cadmium and cysteine, the peak corresponding to the hydrated Cd2+ disappears (Figure 1, curve 5), while the maximum reduction current of the complex is reached at 1:2 molar ratio of cadmium and cysteine (Figure 1, curve 8).
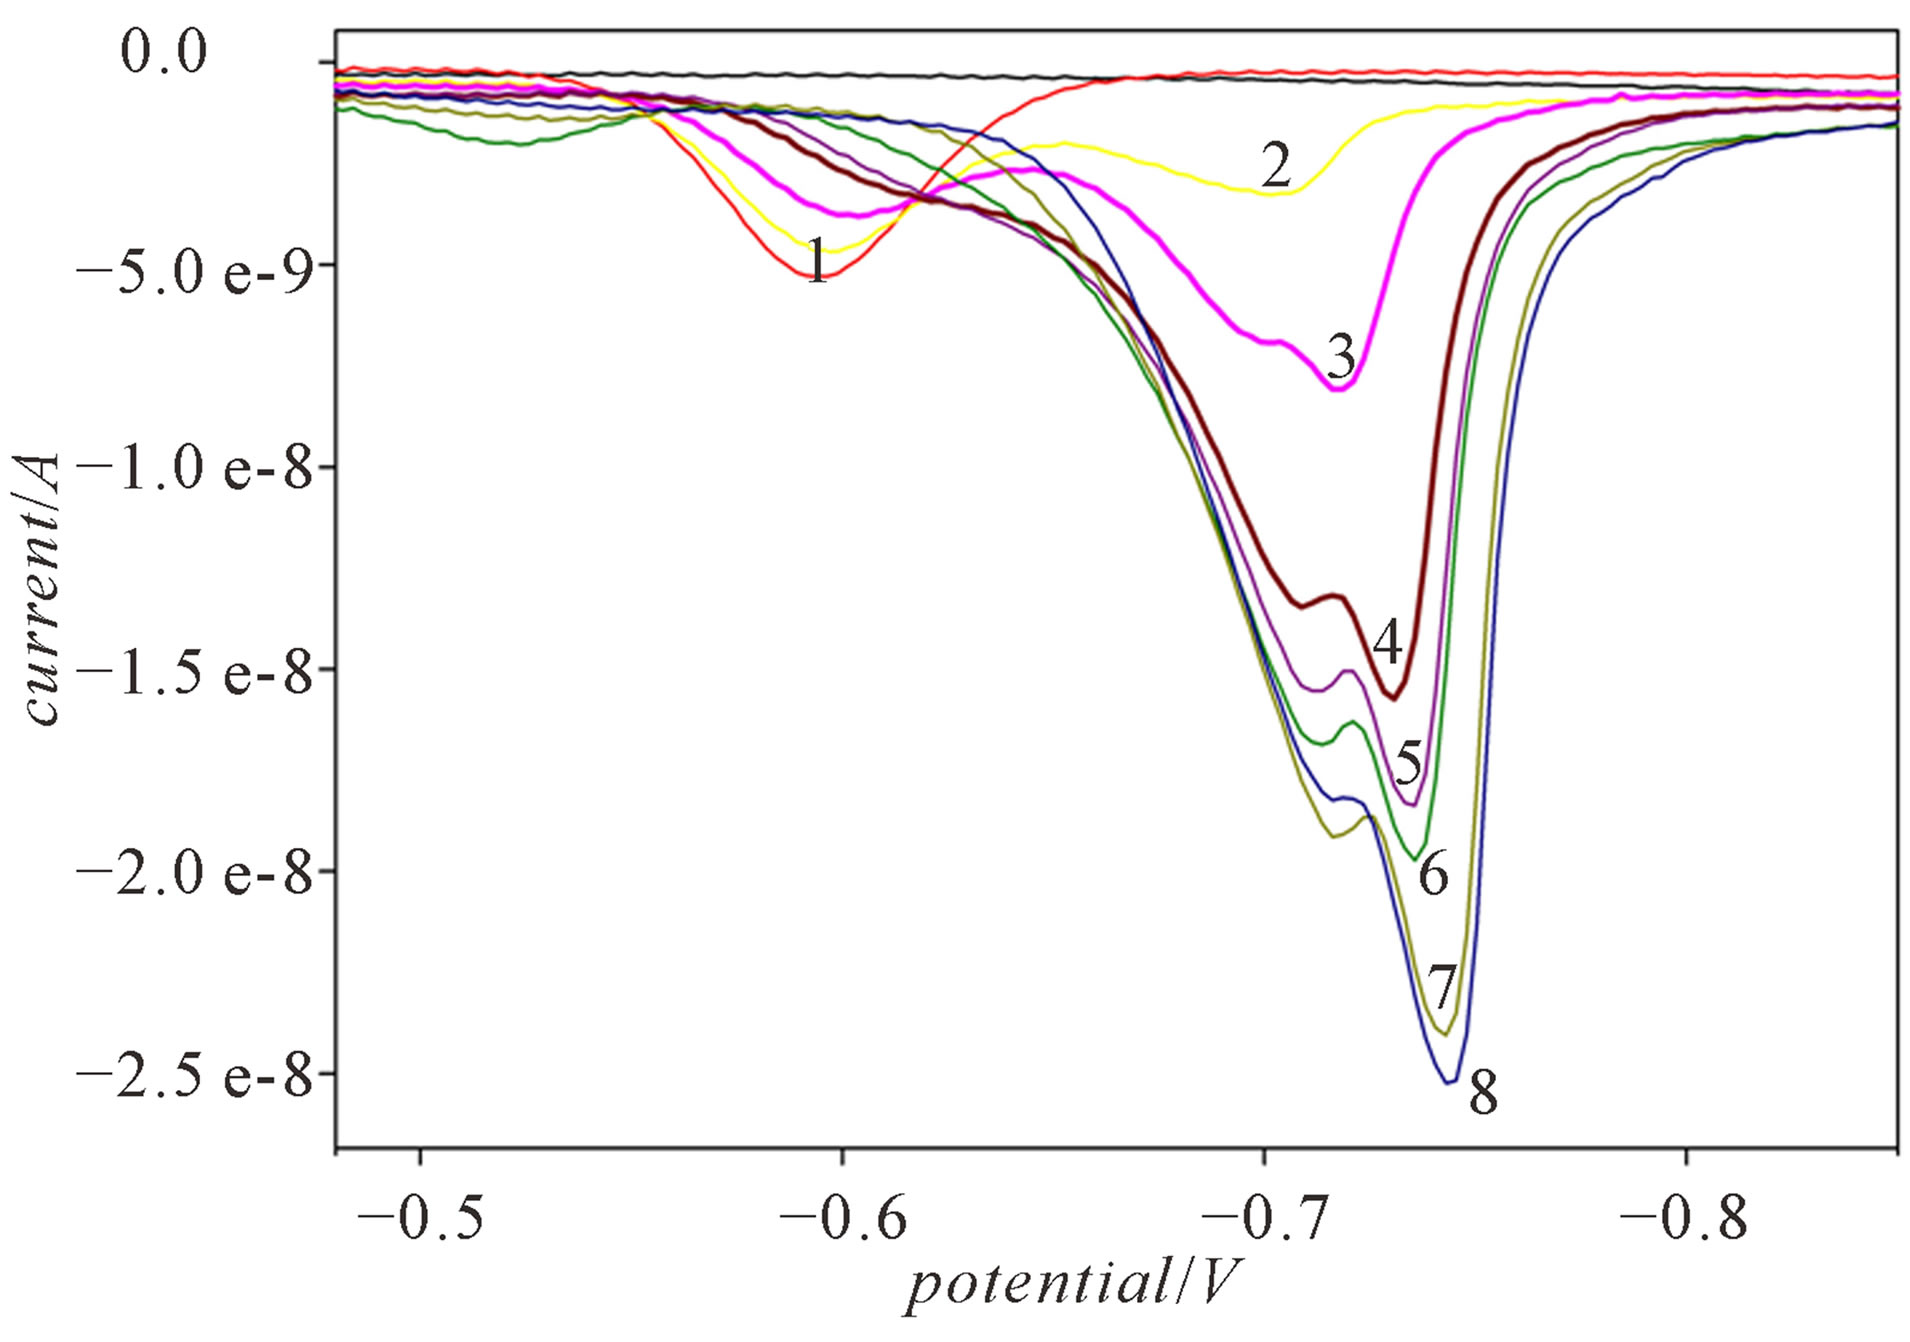
Figure 1. Differential pulse voltammograms recorded during the direct titration of 2 × 10⁻⁶ M Cd2+ with cysteine: 1) 0; 2) 5 × 10⁻⁷ M; 3) 1 × 10⁻⁶ M; 4) 1.75 × 10⁻⁶ M; 5) 2 × 10⁻⁶ M; 6) 2.25 × 10⁻⁶ M; 7) 3 × 10⁻⁶ M; 8) 4 × 10⁻⁶ M, in a DP mode and in 0.59 M NaNO3, pH ~9.
The maximum reduction current of the Cd-cysteinate complex was used to calculate the partition of the Cd complex. The respective curve of Cd-cysteinate formation during Cd2+ titration with cysteine is presented in Figure 2 (curve 1).
3.1.1. Equilibration over the Night
To prove if the equilibrium was attained during direct Cd2+ titration with cysteine, the solutions of certain molar ratios of Cd2+ and cysteine were equilibrated over the night in the volumetric flasks. The voltammograms were recorded in the increasing order of the cysteine concentration. For the hydrated Cd2+ the peak potential was recorded at −0.57 V. Similar to the direct titration, which occurred in the polarographic cell, the reduction signal of Cd-cysteinate was recorded at more negative potential than Cd2+. Comparison of direct titrations of Cd2+ with cysteine and those equilibrated over the night confirmed (Figure 2, curves 1 and 2) that the formation of Cd-cysteinate complex is fast enough during the direct addition of cysteine to the polarographic cell.
3.1.2. Reverse Titration and Cd-Cysteinate Complex Formation
The formation of Cd-cysteinate complex was also observed by titrating defined cysteine concentration with the range of Cd2+ concentrations. Applying the DP reduction mode, the formation of Cd-cysteinate complex was followed at different molar ratios of the reactants. In a solution of 2 × 10⁻⁶ M cysteine concentration, two signals at peak potential –0.50 V and −0.61 V were assigned to the reduction of free cysteine (Figure 3, curve 1). The potential scan occurred from −0.45 V up to −0.9 V, but in the range from −0.63 V to −0.90 V no reduction process was recorded (current is zero).
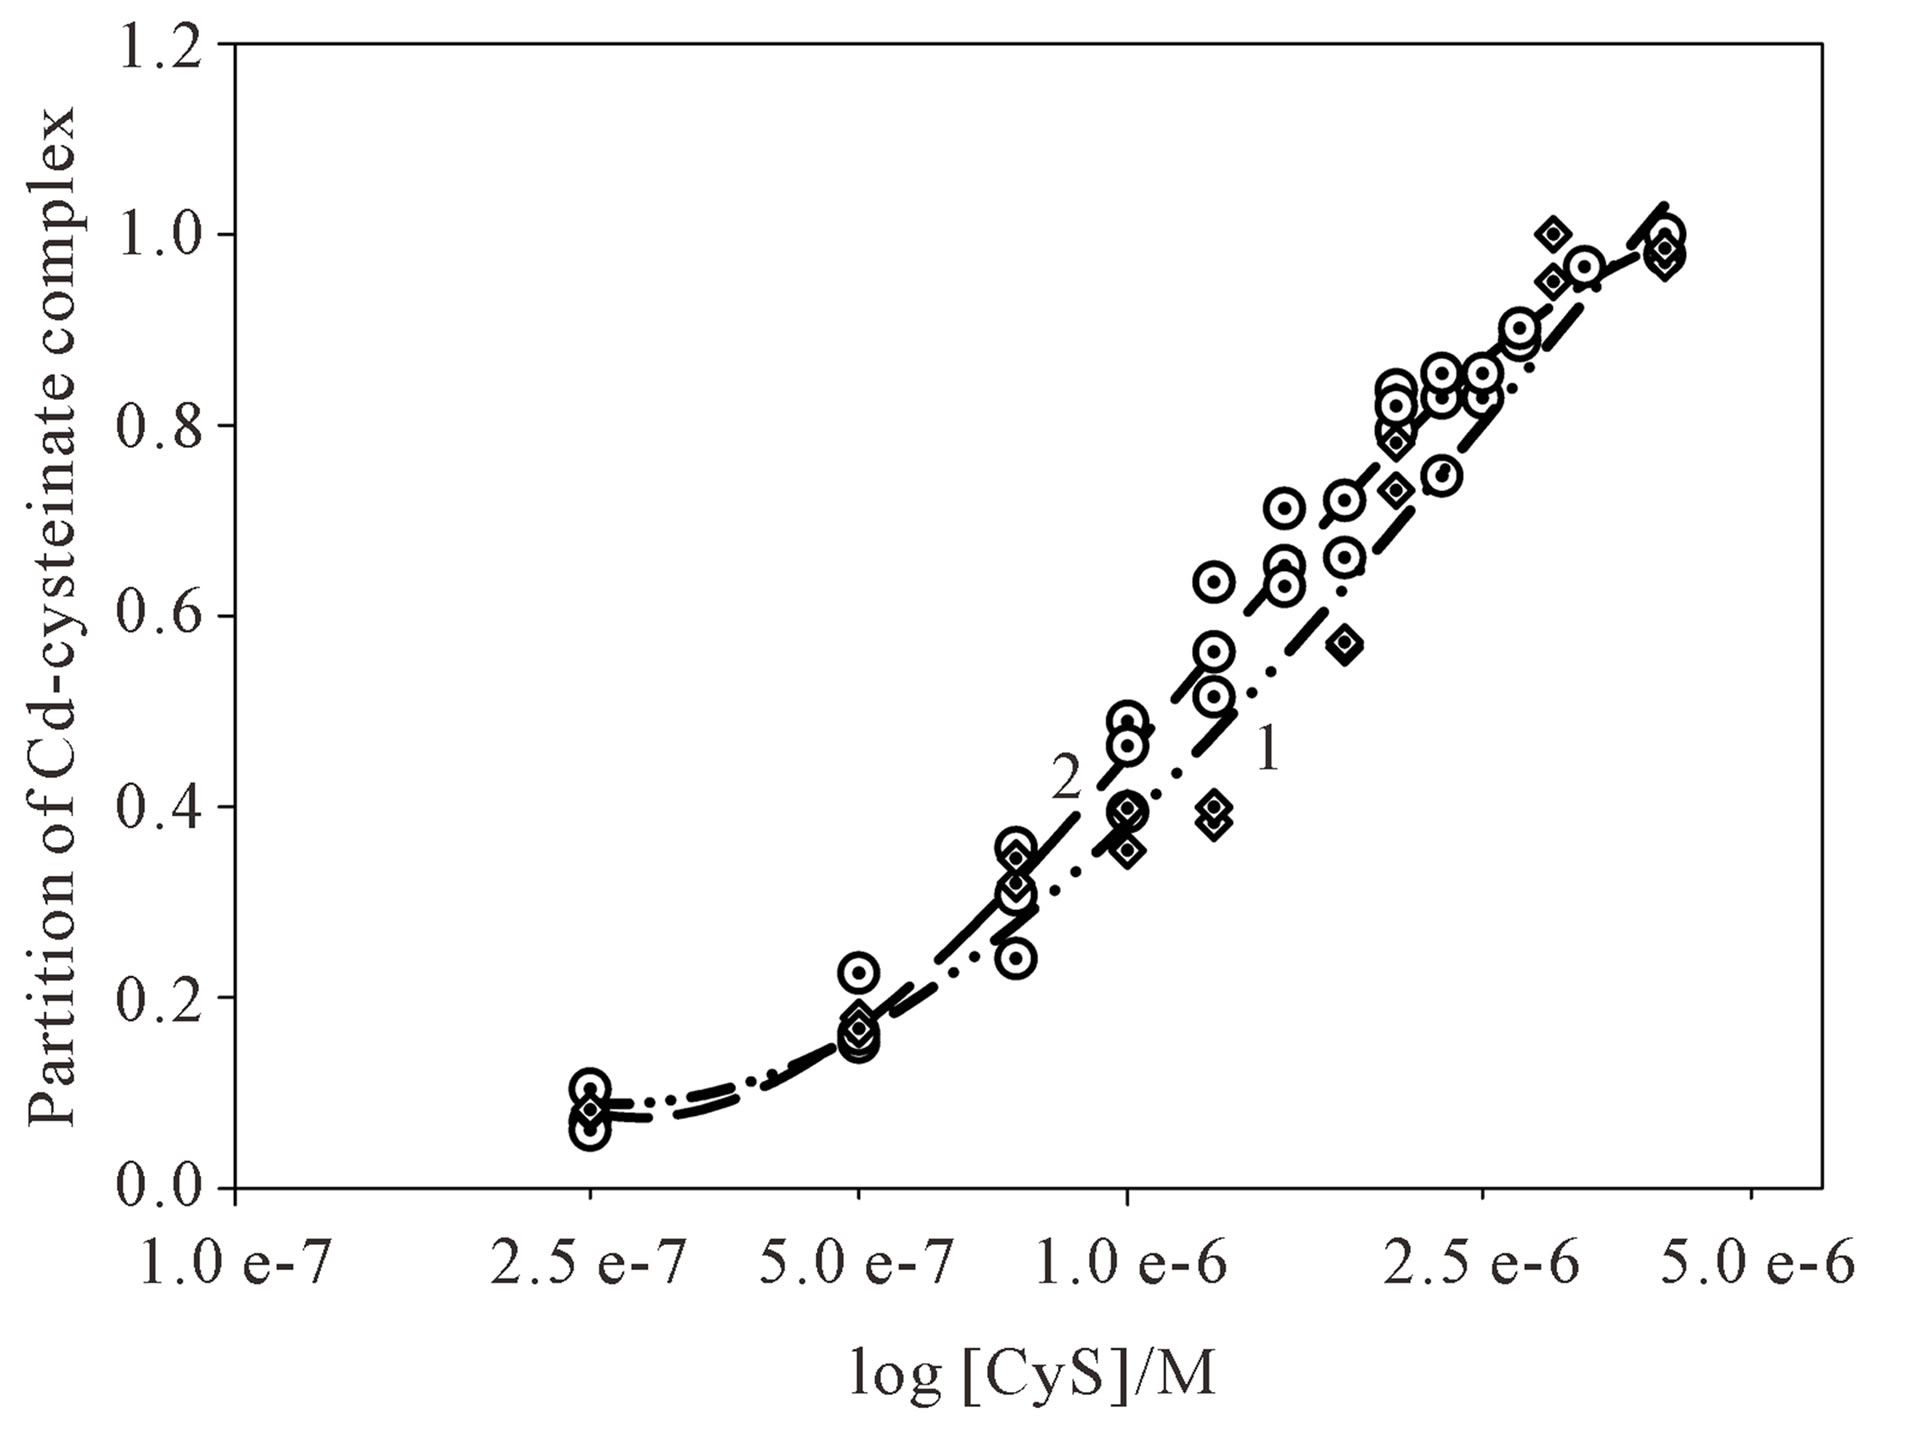
Figure 2. Partition of the respective Cd-cysteinate complex recorded by direct titration (curve 1) and over the night equilibration (curve 2). The formation of Cd-cysteinate complex refers to 2 × 10⁻⁶ M Cd2+ in 0.59 M NaNO3, pH ~9.
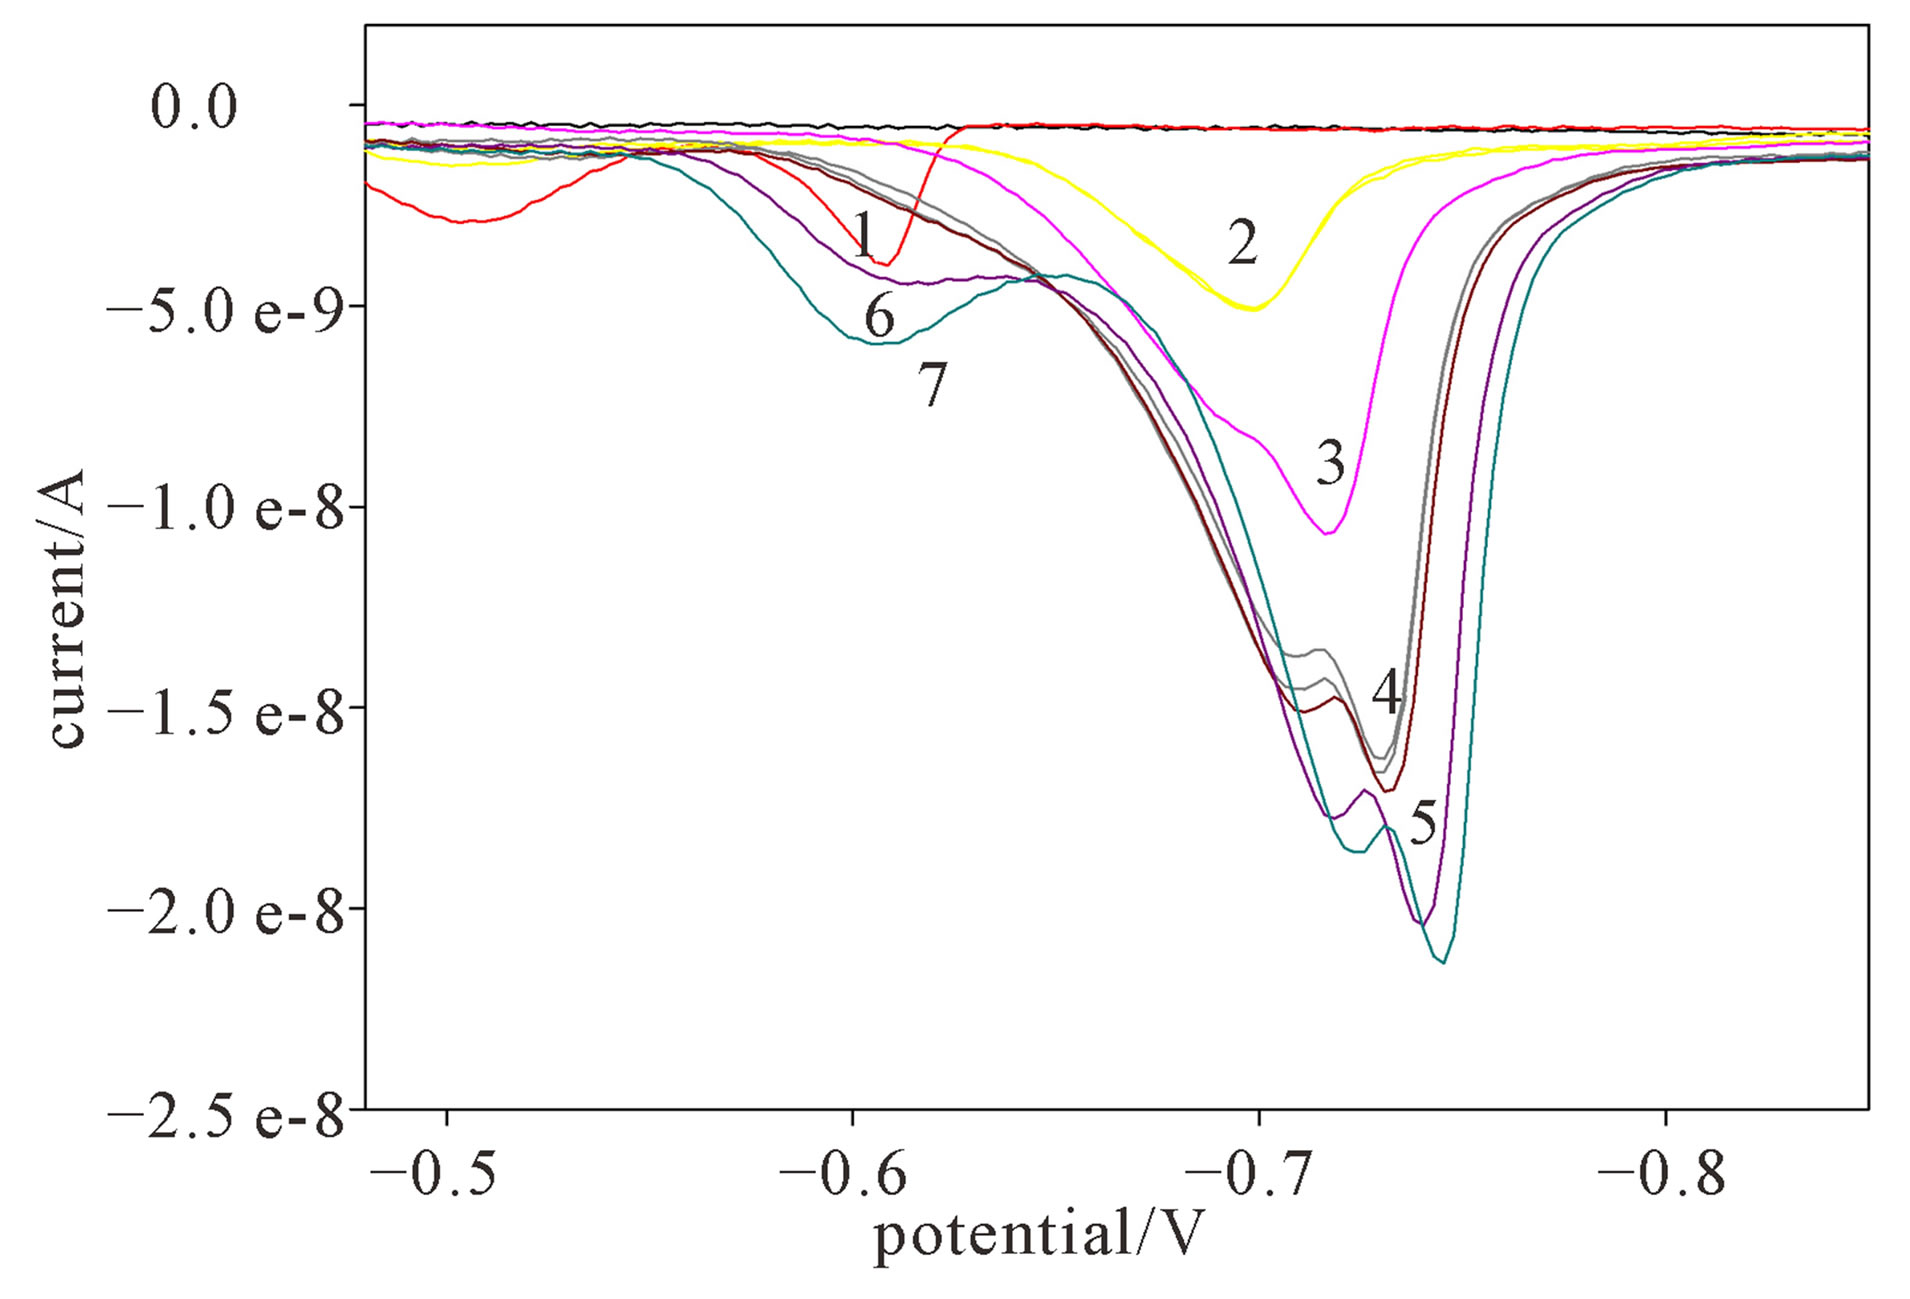
Figure 3. Differential pulse voltammograms during the direct titration of 2 × 10⁻⁶ M cysteine with Cd2+: 1) 0; 2) 5 × 10⁻⁷ M; 3) 1 × 10⁻⁶ M; 4) 1.75 × 10⁻⁶ M; 5) 2 × 10⁻⁶ M; 6) 3 × 10⁻⁶ M; 7) 4 × 10⁻⁶ M Cd2+ in a DP mode and in 0.59 M NaNO3, pH ~9.
After that, standard solution of Cd2+ was succesively added up to 4 × 10⁻⁶ M. After the addition of 2.5 × 10⁻⁷ M Cd2+, the signal of free cysteine diminished, while the signal of Cd-cysteinate complex appears (Figure 3, curve 2) and increases after each successive Cd2+ addition (Figure 3, curves 3 to 7). The reduction current of cadmium complex increases with the subsequent Cd2+ addition, which means that additional Cd-cysteinate is formed in the bulk of solution. After 1:1 molar ratio of cysteine and cadmium is attained, the cysteine complexing sites are saturated, so that further addition of Cd2+ (Figure 3, curves 6 and 7) results in the appearance of the reduction signal of hydrated Cd2+ at −0.60 V. Afterwards, the peak current of the complex remains constant. The maximum reduction current of the Cd-cysteinate complex was used to calculate the partition of Cd complex during the titration. The curve of Cd-cysteinate formation during cysteine titration with Cd2+ is presented in Figure 4 (curve 2), while curve 1 refers to the titration of Cd2+ with cysteine, as already presented in Figure 2.
3.2. Mass Balance and Calculation of the Stability Constant of Cd-Cysteinate Complex
Complexation of cadmium with cysteine has been studied in 0.59 M NaNO3 borate buffer of pH ~9. Sodium nitrate was selected as the supporting electrolyte in order to avoid any competitive reactions of Cd2+ with anions, except with the cysteine. In that manner, during amperometric titration of Cd2+ with cysteine as the ligand, cadmium speciation was simplified to the hydrated form of Cd2+ and subsequently formed inert Cd-complex. Even the buffer was selected in that manner to reduce any competitive reaction with Cd2+. Therefore Cd complexation was only dependent on the available cysteine con-
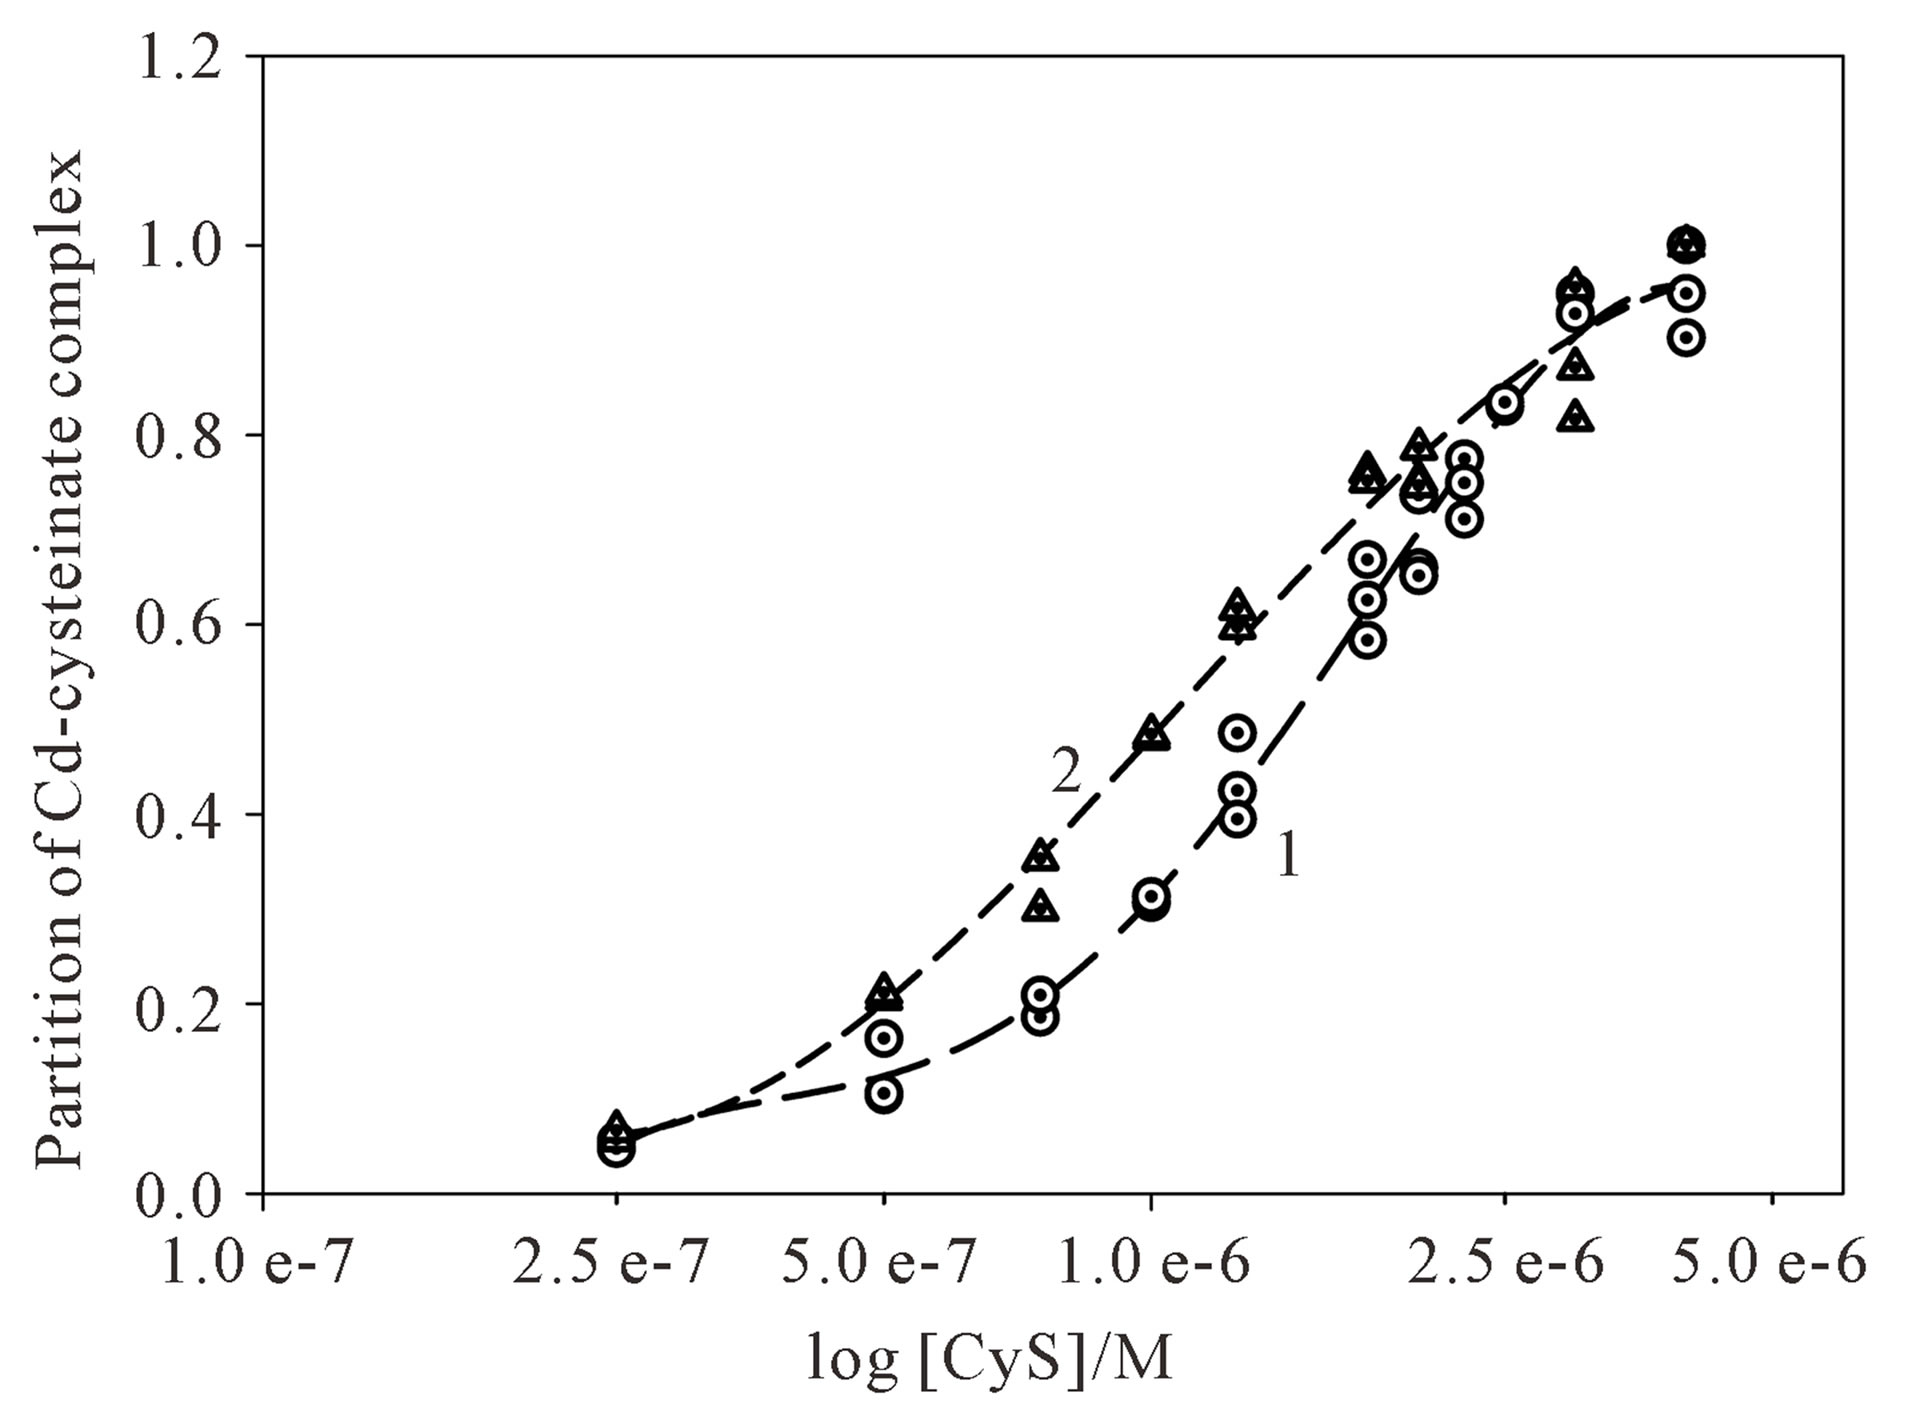
Figure 4. Partition of the respective Cd-cysteinate complex recorded by direct titration of 2 × 10⁻⁶ M Cd2+ with cysteine (curve 1) and 2 × 10⁻⁶ M cysteine with Cd2+ (curve 2) in 0.59 M NaNO3, pH ~9.
centration.
At pH ~9, 80% of analytical cysteine concentration is present in the chemical form HL2−. Under these conditions, on cysteine molecule, carboxylic and sulphydryl groups are deprotenized [7], while ammonium group is protonated. Complex formation of Cd2+ with cysteine occurs mainly via the sulphur atom. Under described conditions complexation of Cd2+ with cysteine occurs as follows
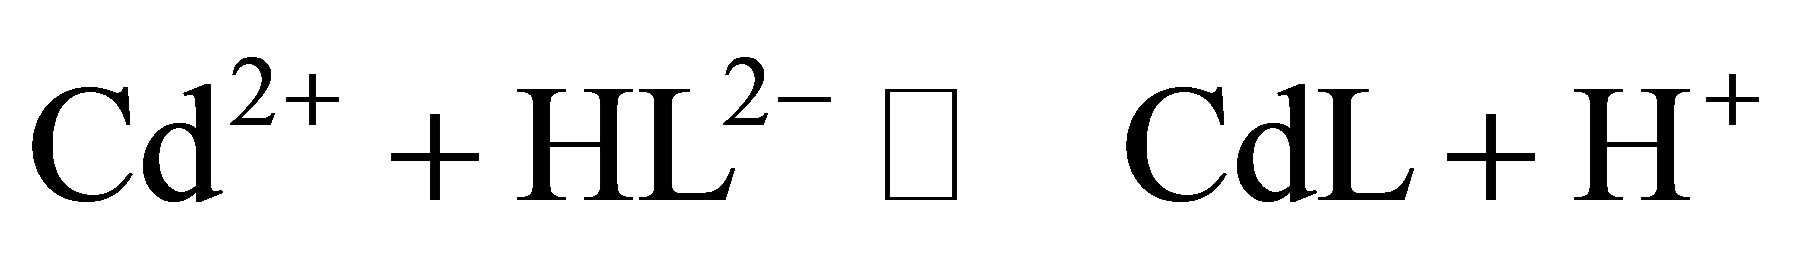 (1)
(1)
Protons liberated by this reaction are neutralized by the buffer and the expression for the stability constant is the following:
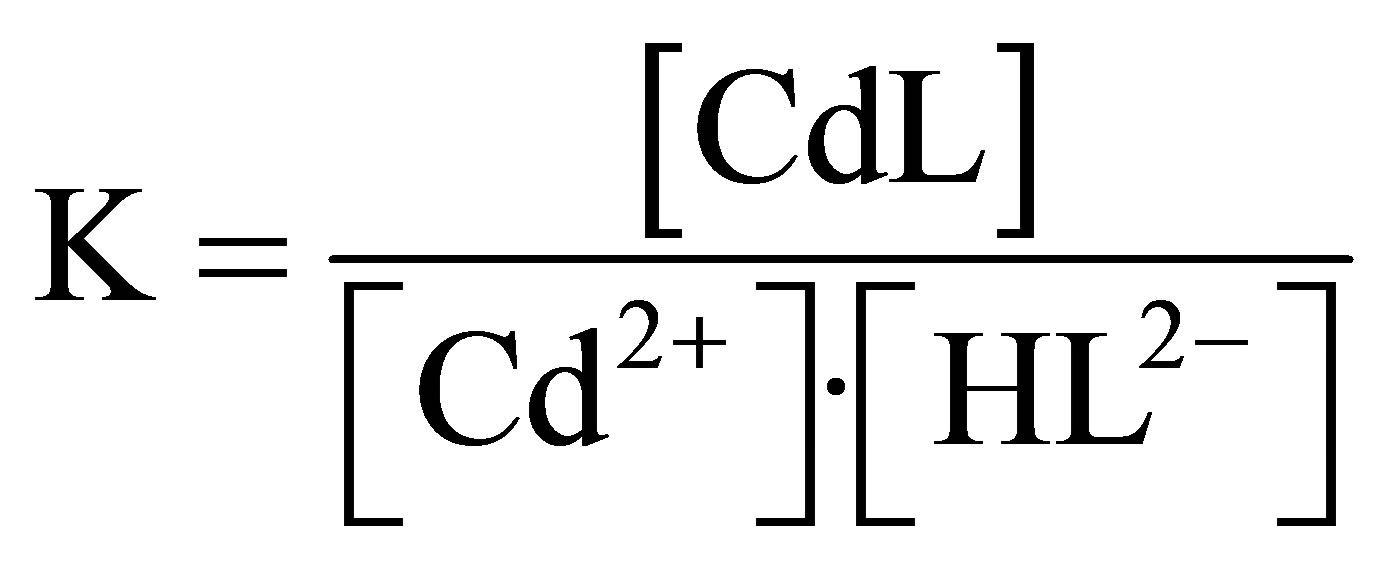 (2)
(2)
In order to calculate stability constant of Cd-cysteinate it is necessary to define free cysteine concentration, i.e. [L3−] because, the stoichiometric concentration stability constant is calculated accordingly:
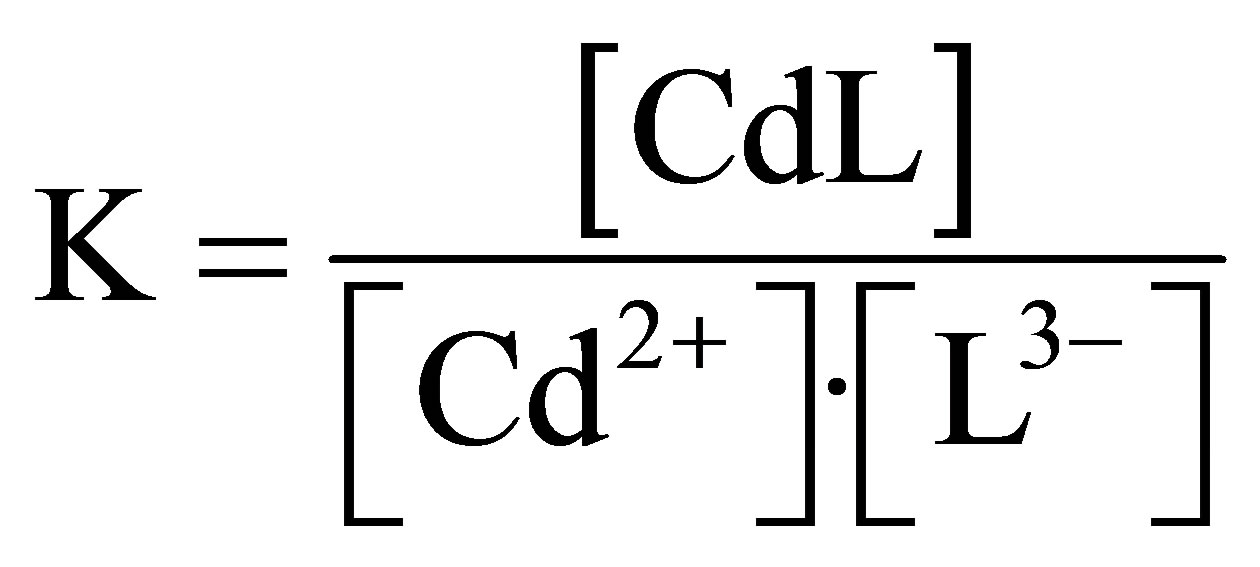 (3)
(3)
The mass balance for total cadmium concentration is presented in Expression (4); [Cd2+]F is the concentration of hydrated cadmium concentration.
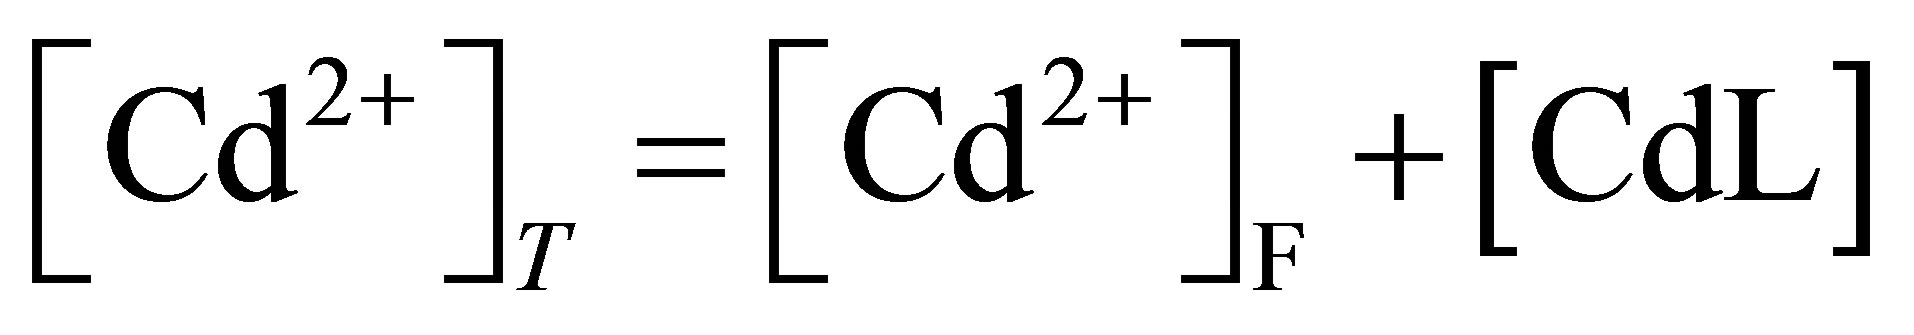 (4)
(4)
The mass balance for total cysteine concentration refers to (5). In Figures 2 and 4 the formation curves of Cd-cysteinate were presented.
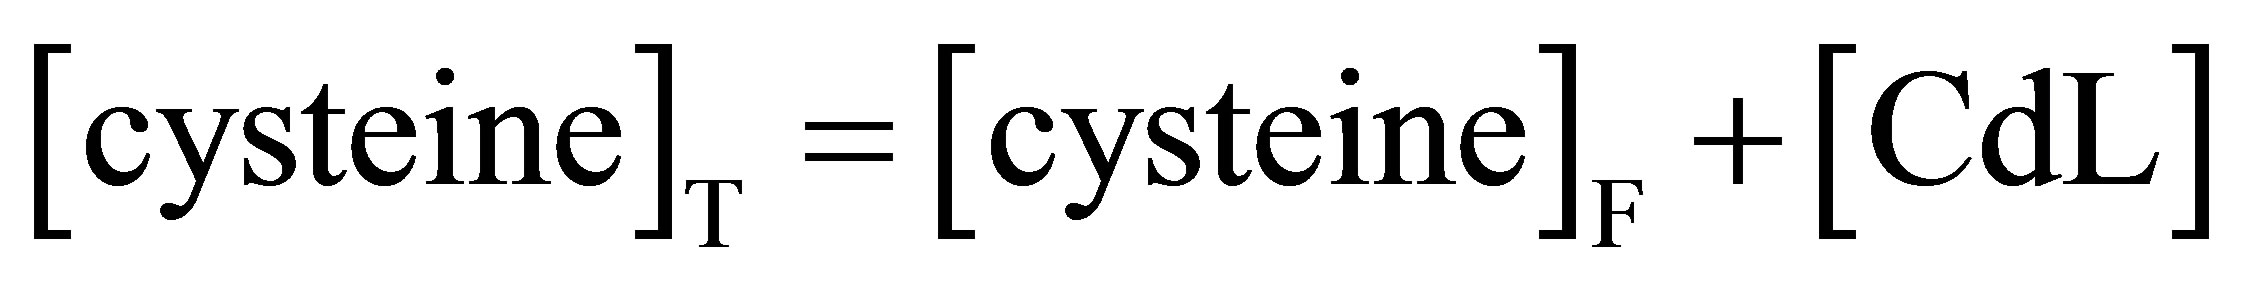 (5)
(5)
Therefore, from the defined total (analytical) cysteine concentration and Cd-cysteinate complex, the concentration of uncomplexed cysteine [cysteine]F is determined. According to the protonation constants log K1 = 10.1, log K2 = 8.10, log K3 = 1.9 reported by [8] which refer to T = 25˚C, m = 0.5 i.e. to the physico-chemical conditions close to those in our study, [L3−] is calculated
 (6)
(6)
After [L3−] concentration of cysteine has been calculated using the protonation constants reported by [7], the stability constant of Cd-cysteinate complex was calculated from the Equation (3) at pH ~9, ionic strength 0.59 M and 23˚C. In Table 1 stability constants determined under three titration modes are presented. The grand average of the stoichiometric stability constants of Cdcysteinate complex amounts to log K = 7.83 M−1. Comparable values in Table 1 indicate that irrespective of the titration mode, the complex of Cd-cysteinate is formed in the bulk of solution and before reduction it diffuses to the electrode.
Different reduction signals recorded in a DP mode on HMDE, during Cd2+ titration with cysteine and vice versa, in 0.59 M NaNO3, borate buffer of pH ~9, were assigned. From two titration modes, namely of Cd2+ with cysteine and cysteine with Cd2+ (Figures 1 and 3), it is clear that both signals (at −0.60 V and about −0.73 V) are related to the electrode processes which involve cadmium [9].
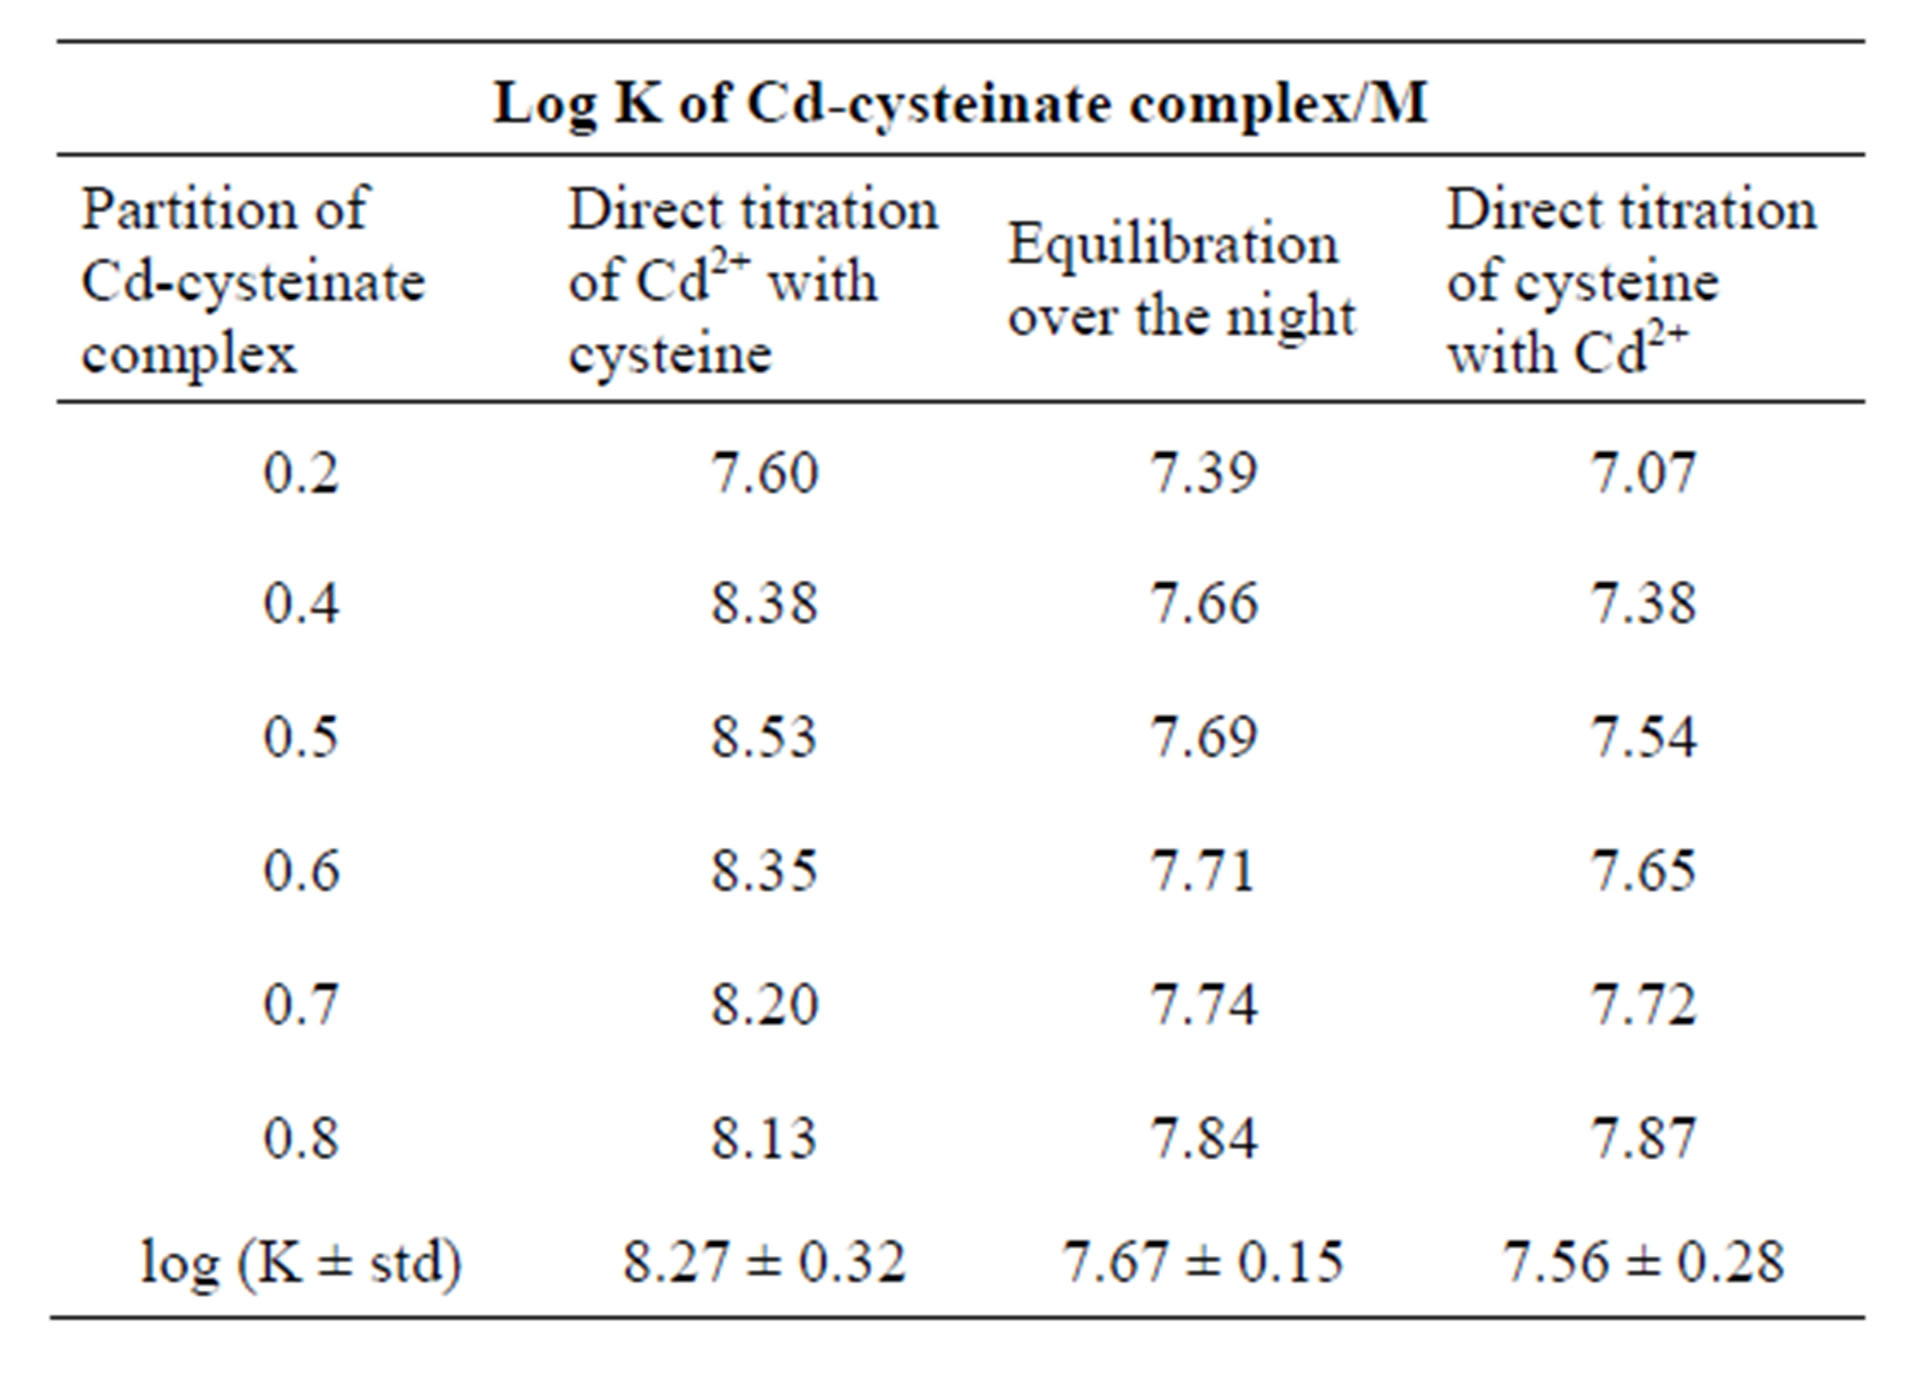
Table 1. Comparison of the stability constants (log K) of Cd-cysteinate complex when different titration modes were applied. Partition of Cd-cysteinate complex was determined from the titration curves presented in Figure 2 (curves 1 and 2) and Figure 4 (curve 2). Concentration stability constants were calculated from the mass balance (Equations (4) to (6)) and the Expression (3). Stability constants refer to 0.59 M ionic strength and 23˚C.
Cd-cysteinate is chemically inert type of complex. In the case of an electrochemically inert complex, it practically does not dissociate within the timescale of the voltammetric measurement. Buffle [10]. Consequently, the linear contribution of the present species to the current can be assumed, since the free metal and the complex(es) diffuse independently towards the electrode (i.e. without conversion into each other) and the system behaves like any other multianalyte system. Thus, the total current for every potential is equal to the sum of the current contribution of the species, which are proportional to the respective bulk concentrations. This feature produces two (or more) separate signals. The first one, with the same half-wave or peak potential as in the absence of ligand, is due to the reduction of free metal ion. The second (or higher) one is due to the reduction of the complex(es). In most cases its half-wave or peak potential is more negative than that of the free metal because, usually, complexation stabilises the oxidised form of the metal as compared to the reduced form, although this is not always true. In some cases, such stabilisation is so important that the complex cannot be reduced inside the available potential window and does not produce any signal [11].
During the titration of cysteine with Cd2+ it has been observed that above the 1:1 molar ratio, addition of Cd2+ solution results in the appearance of uncomplexed Cd2+ (at −0.60 V) (Figure 3, curves 6 and 7).
The reduction of Cd-cysteinate complex occurs close to the HMDE surface at more negative potential than the hydrated Cd2+ and dissociates to Cd2+ that is subsequently reduced. At the same time the cysteine is also released and the reduced form is adsorbed at the HMDE, which is evident from the pre-peak of Cd-cysteinate signal (Figures 1 and 3). The reduction current of Cd-cysteinate complex in a DP mode on HMDE is 4 to 5 times higher than the peak current of hydrated, uncomplexed concentration of cadmium. The same is observed if the defined cysteine concentration (2 × 10⁻⁶ M) is titrated with Cd2+ solution. This means that the reduction current of Cd-cysteinate is not only the result of Cd2+ reduction (released by dissociation of Cd-complex), but also the reduction of cysteine takes place, which is afterwards adsorbed. Once cysteine is released by the dissociation of Cd-cysteinate in the vicinity of HMDE surface, cysteine is adsorbed in the reduced form. The appearance of prepeak on the Cd-cysteinate reduction signal, recorded with the digital type of instrument, supports this explanation. This behavior is in agreement with the mechanisms by which the adsorption of the reduced form ZR produces a pre-peak of the main, diffusion controlled signal.
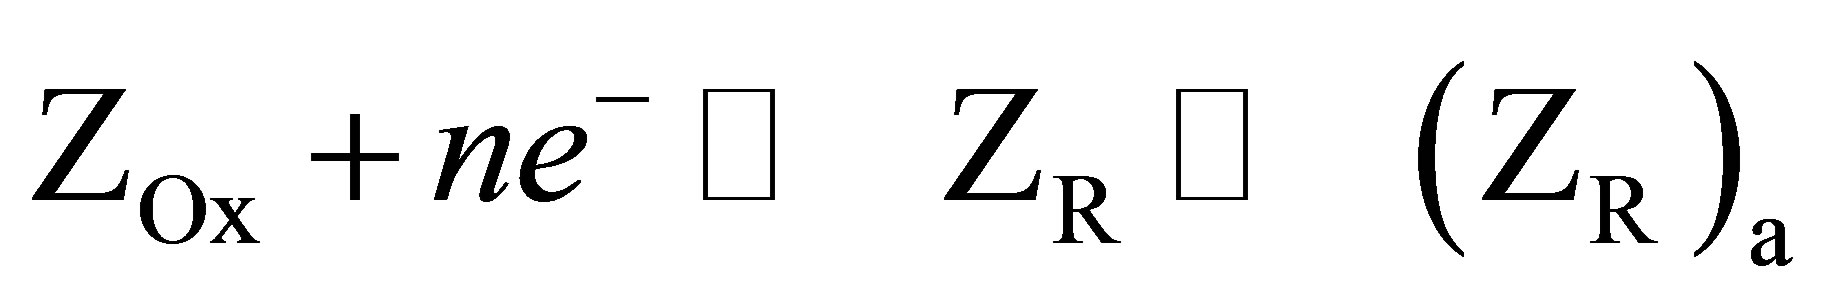 (7)
(7)
The adsorption reaction facilitates the overall reduction process by displacing the redox equilibrium towards the right [10]. If on the other hand, the reduced product is surface-active while the oxidized form remains inactive, the reduced form shall be adsorbed at the electrode surface. Consequently, a product, which is adsorbed at the electrode surface, will need less energy for its formation than the unadsorbed compound. The adsorption of the reduced product therefore gives rise to a pre-peak at less negative potential than the main, diffusion controlled signal. This is in agreement with our study that the prepeak follows the increase of the Cd-cysteinate reduction signal, which increases up to the saturation, with subsequent addition of the cysteine concentration. On the other hand, from the titration data of cysteine with the increasing Cd2+ concentrations (Figure 3, curve 1) it is also evident that the dissolved cysteine (2 × 10⁻⁶ M) is not electroactive, because in the potential range where the reduction of Cd-cysteinate complex occurs (more negative than −0.63 V) no reduction current has been recorded, if only the cysteine is dissolved in 0.59 M NaNO3 electrolyte. It also means that only that ligand concentration, which is released by dissociation of Cd complex that reaches the electrode surface by diffusion, is reduced. Therefore, the reduction signal with the peak at about −0.73 V is proportional to the formed Cd-cysteinate complex, which diffuses from the bulk of solution to the electrode surface.
Adsorption in differential pulse polarography (DPP), may lead to deformation or splitting of the peak Leeuwen et al. [12]. The current component due to conversion of adsorbed material depends strongly on tp, the time dependence is much stronger than for the diffusion-controlled current. Adsorption takes place at potentials which move through the range selected. In the pre-pulse period the adsorption and the faradaic reaction can proceed simultaneously. Moreover, the potential dependence of the adsorption may play a significant role. A separate peak may be observed at E > E1/2 for strong product adsorption and in the presence of product adsorption the limiting current is depressed [13].
Leeuwen et al. [12] also noted that most electron transfer of electrode reactions of metal ions with organic molecules complicated by product adsorption are totally irreversible if the charge transfer is followed by fast and irreversible protonation of the product. In order to understand why the reduction of Cd-cysteinate complex is irreversible, we have considered the following. As reported by Kapoor and Aggarwal [14] major cause of the irreversibility of the electrode reaction is the slow establishment of the equilibrium between the oxidized and the reduced forms at the electrode surface, since the rates of the electrochemical reaction in the cathodic and anodic directions may not be the same. Thus, as the reaction proceeds mainly in one direction, a change in composition of the solution occurs near the electrode surface as compared to the equilibrium state in the bulk of solution. Here, by the electrochemical reaction the electron exchange, between the electrode and the active species (depolarizer) is meant. Irreversible process can arise when a depolarizer is inactive and has to be transformed into an active form, which is capable of undergoing electron-exchange reaction. Due to the fact that cysteine molecule is adsorbed in the reduced form, it means that the complex formation with the oxidized Cd2+ cannot take place, if the differential pulse anodic stripping more (DPASV) is applied. In line with the discussed electrochemical reactions and based on our results, the reduction mechanism of cadmium chemical species in the presence of cysteine, in 0.59 M NaNO3, pH ~9, is schematically presented in Figure 5.
Numerous reports on stability constants of cadmium (II) cysteine complexes; with differences in the experimental conditions (e.g. temperature, ionic medium, concentration range) restrict their applicability for comparison among stability constants. Among all the reports about the stability constants of cadmium cysteinate complex, comparison can be made only with the study of Vicente et al., who have used conditions similar to our study. The obtained value for stability constants of cadmium cysteinate complex log K = 7.83 M−1 is in good agreement with that reported by Vicente et al. [15] for CdL complex.
4. Conclusion
We summarize the electrochemical characteristic of Cd titration with an essential amino acid like cysteine it fol-
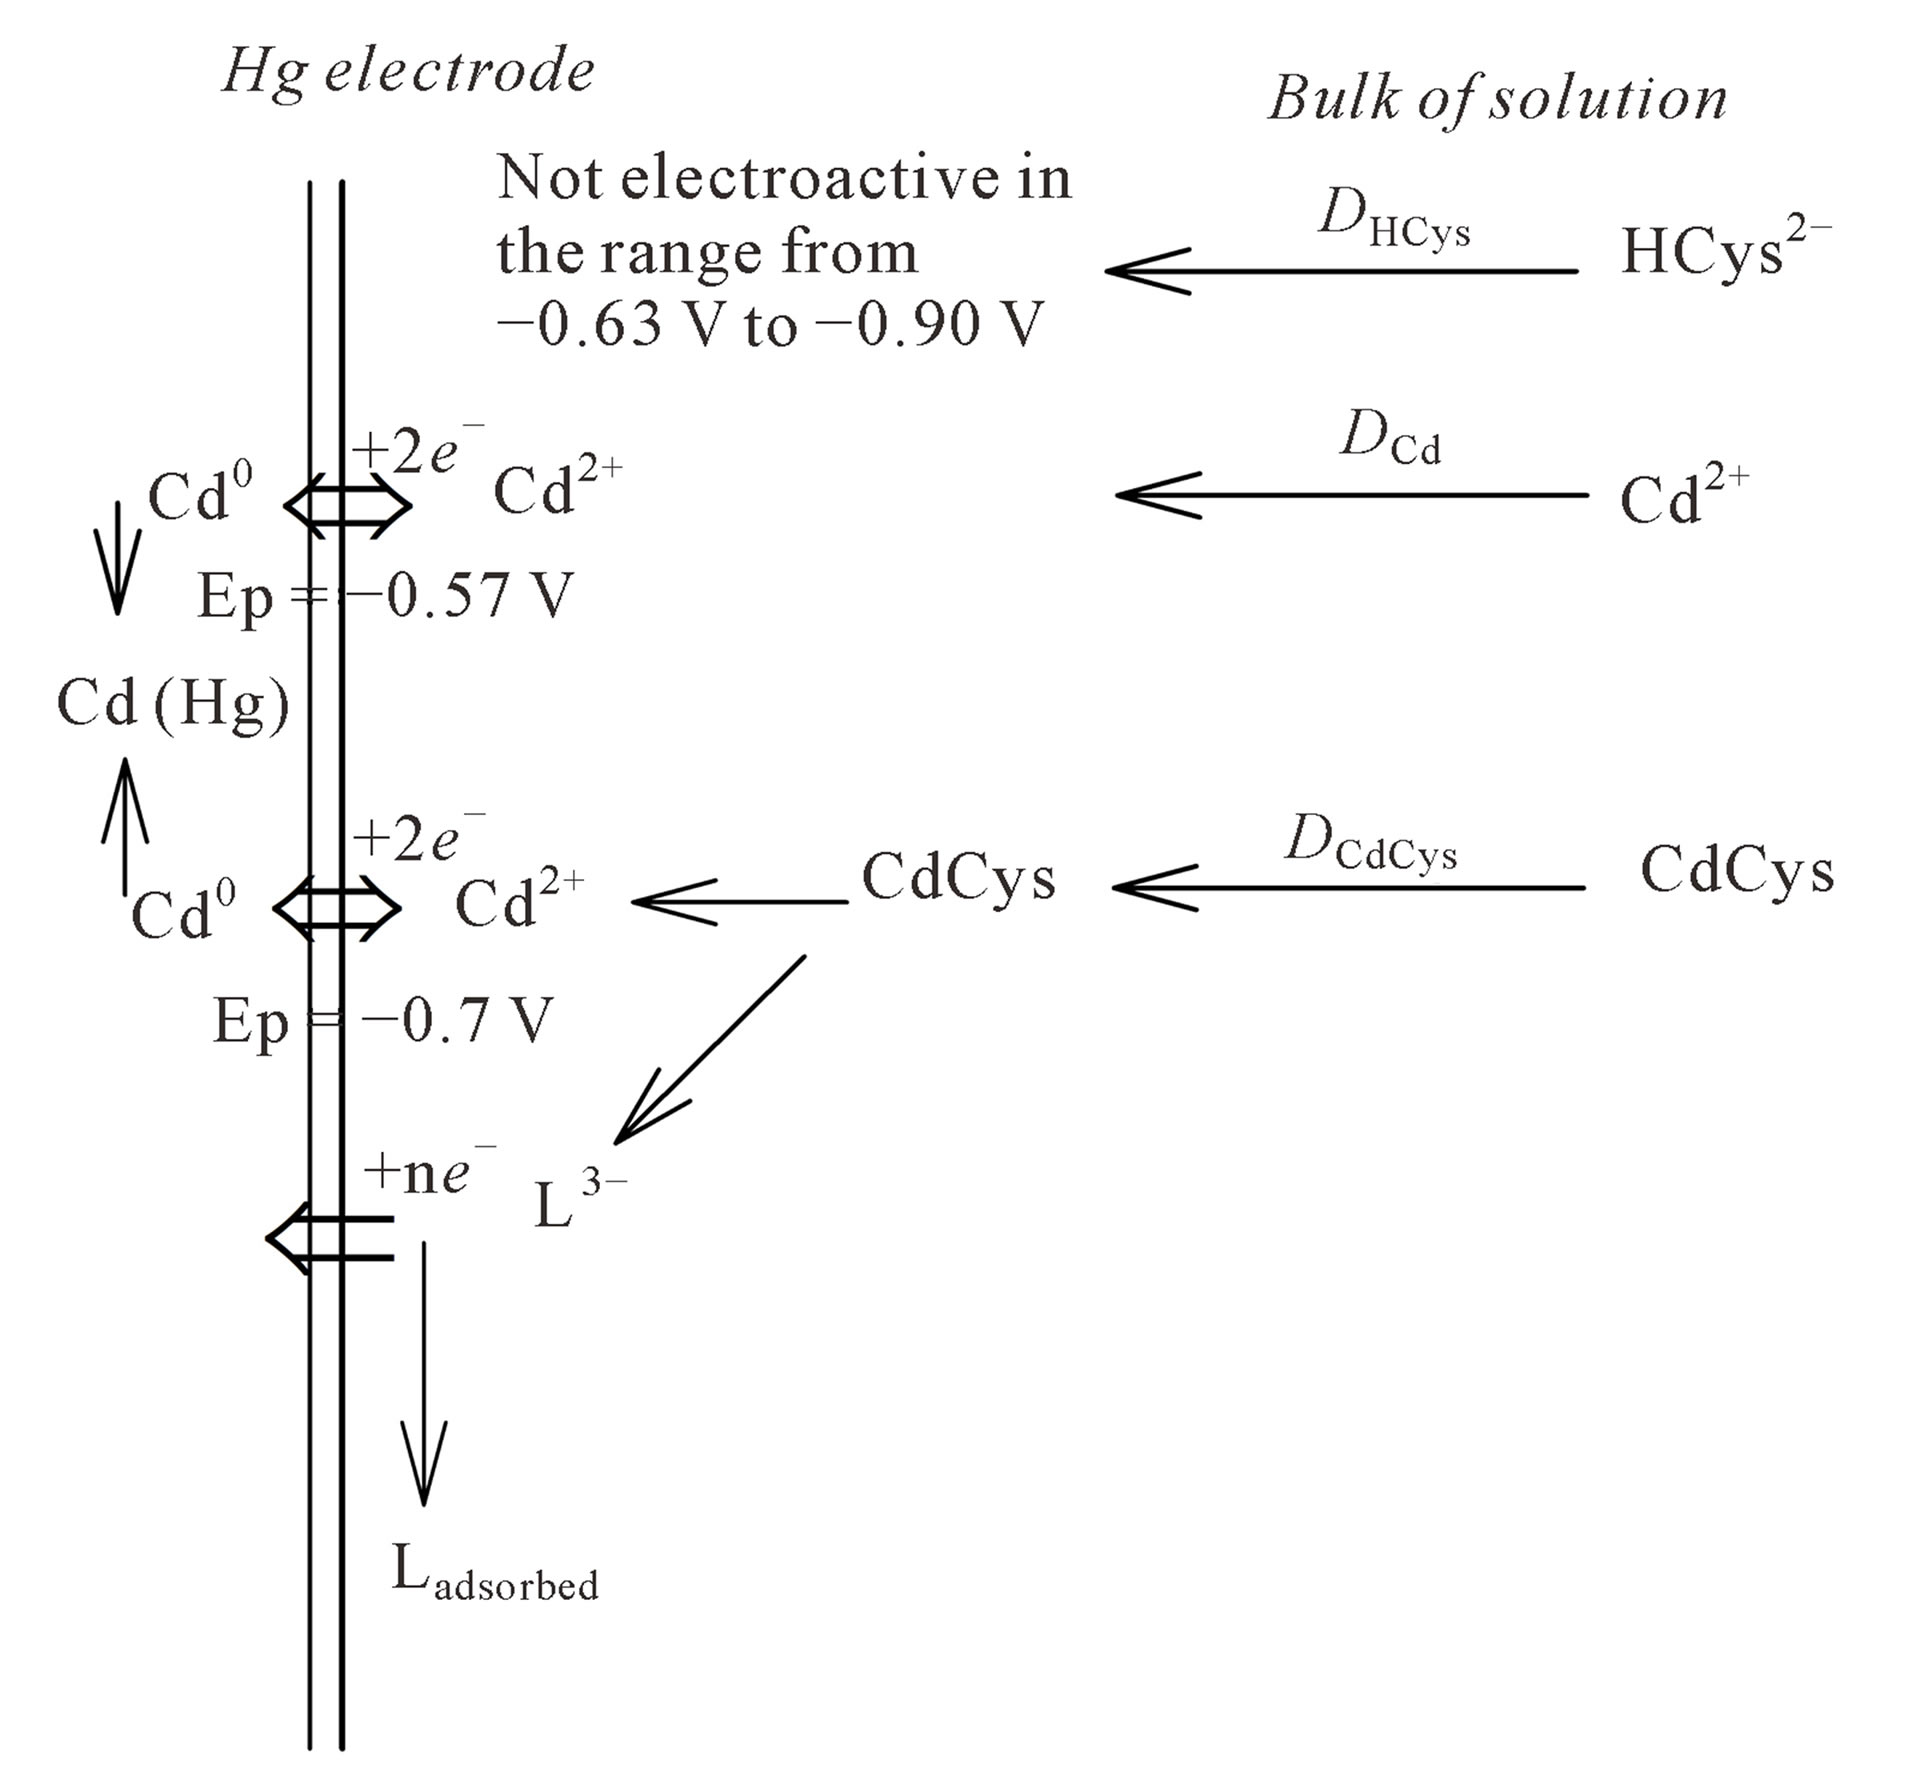
Figure 5. Reduction mechanism of cadmium chemical species in the presence of cysteine.
lows: the reduction signals of hydrated Cd2+ (Ep = −0.60 V) and Cd-cysteinate complex (Ep = −0.743 V) are separated on the potential scale. The applied DP mode proved to be suitable for resolving labile from the inert type of Cd complexes, and additionally the free cysteine concentration. Optimal experimental conditions for amperometric titration comprise a differential pulse (DP) mode on a hanging mercury drop electrode (HMDE), in 0.59 M NaNO3, pH ~9. The stoichiometric stability constants of Cd-cysteinate complex were determined. Different titration modes indicate that the formation of the Cd-cysteinate complex is fast enough and occurs during the direct addition of cysteine to the polarographic cell.
In a DPASV mode, no signal of Cd-cysteinate complex was recorded. It indicates that the reduction of Cd-cysteinate complex is electrochemically irreversible. The proposed reduction mechanism of Cd-cysteinate complex clarifies this observation.
REFERENCES
- A. Cole, C. Furnival, Z. X. Huang, D. Cerijones, P. M. May, G. L. Smith, J. Whittaker and D. R Williams, “Computer Simulation Models for the Low-Molecular-Weight Complex Distribution of Cadmium (II) and Nikel (II) in Human Blood Plasma,” Inorganica Chimica Acta, Vol. 108, No. 3, 1958, pp. 165-171. http://dx.doi.org/10.1016/S0020-1693(00)84536-3
- D. Hynek, L. Krejcova, J. Sochor, J. Natalia Cernei, J. Kynicky, V. Adam, L. Trnkova, J. Hubalek, R. Vrba and R. Kizek, “Study of Interactions between Cysteine and Cadmium(II) Ions using Automatic Pipetting System Off- Line Coupled with Electrochemical Analyser,” International Journal of Electrochemical Science, Vol. 7, No. 3, 2012, pp. 1802-1819.
- R. G. Pearson, “Hard and Soft Acids and Bases,” Journal of the American Chemical Society, Vol. 85, No. 22, 1963, pp. 3533-3539. http://dx.doi.org/10.1021/ja00905a001
- T. E. Creighton, “Proteins Structures and Molecular Properties,” 2nd Edition, Freeman, W. H. and Co., New York, 1993.
- M. D. Walker and D. R. Williams, “Thermodynamic Considerations In Co-Ordination. Formation Constants for Cadmium (II)-Amino-acid Complexes as Determined by Glass and Soil-State Cadmium-Electrode Potentiometry,” Journal of the Chemical Society, Dalton Transactions, Vol. 1186, 1974, pp. 1186-1189. http://dx.doi.org/10.1039/dt9740001186
- L. Wagner-Roos, H. Zahn, J. M. Séquaris and P. Valenta, “Polarographic Investigations on the Complexation of Cadmium and Zinc by Thiol Peptides,” Toxicological and Environmental Chemistry, Vol. 22, No. 1-4, 1989 pp. 77-90. http://dx.doi.org/10.1080/02772248909357426
- M. Calvin, “Mercaptans and Disulfides,” In Glutathione, Academic Press, Inc., New York, 1954, pp. 8-11.
- NIST Standard Reference Database 46 Version 5.0. NIST Critically Selected Constants of Metal Complexes, 1995.
- S Nyberg and L. Zhou, “Polarography as a Tool in Peptide and Protein Analysis: Studies on Metal-Chelating Substances Included by Cadmium in the Algae Pheodactylum tricornutum and the Graminae Agrosits Capillaries,” Ecotoxicology and Environmental Safety, Vol. 32, No. 2, 1995, pp. 147-153. http://dx.doi.org/10.1006/eesa.1995.1095
- J. Buffle, “Complexation Reactions in the Aquatic Systems,” An Analytical Approach, Wiley and Sons, New York, Chapter 9, 1988, pp. 467-563
- M. Esteban, C. Ariño and J. M. Díaz-Cruz, “Metal Complexation by Electroanalytical Techniques: Hardand Soft-Modelling Approaches,” Contributions to Science, Vol. 2 No. 3, 2003, pp. 359-373.
- H. P. Van Leeuwen, J. Buffle and M. Lovric, “Reactant Adsorption in Analytical Pulse Voltammetry,” Pure and Applied Chemistry, Vol. 64. No. 7, 1992, pp. 1015-1028. http://dx.doi.org/10.1351/pac199264071015
- F. Montserrat and M. Raewyn, “Town, Determination of Metal Ion Binding Parameters for Humic Substances Part 1. Application of a Simple Calculation Method for Extraction of Meaningful Parameters from Reverse Pulse Polarograms,” Journal of Electroanalytical Chemistry, Vol. 485, No. 1, 2000, pp. 21-33. http://dx.doi.org/10.1016/S0022-0728(00)00083-8
- R. C. Kapoor and B. S. Aggarwal, “Principles of Polarography,” John Wiley and Sons, 1991.
- T. Vilarino, I. Brandariz, S. Fiol, J. Lopez-Fonseca and M. Sastre de Vicente, “Complexation of Cd2+ by cysteine at ionic strength of 0.7 M studied by differential pulse polarography,” Bulletin des Sociétés Chimiques Belges, Vol. 102, No. 11/12, 1993, pp. 699-707. http://dx.doi.org/10.1002/bscb.19931021104
NOTES
*Corresponding author.