American Journal of Analytical Chemistry
Vol.4 No.7A(2013), Article ID:33867,10 pages DOI:10.4236/ajac.2013.47A003
Adsorption of Reactive Dyes on Activated Carbon Developed from Enteromorpha prolifera
1College of Chemistry & Chemical Engineering, Qingdao University, Qingdao, China
2Qingdao Sub-Administration, Administrative Departments for Yellow River Diversion to Qingdao Project of Shandong Province, Qingdao, China
Email: *luckysds@163.com
Copyright © 2013 Deshuai Sun et al. This is an open access article distributed under the Creative Commons Attribution License, which permits unrestricted use, distribution, and reproduction in any medium, provided the original work is properly cited.
Received April 10, 2013; revised May 10, 2013; accepted June 17, 2013
Keywords: Activated Carbon; Enteromorpha prolifera; Reactive Dye; Adsorption Isotherm; Adsorption Dynamics
ABSTRACT
Activated carbon was prepared from Enteromorpha prolifera by zinc chloride activation. The adsorption behaviors of three reactive dyes (Reactive Red 23, Reactive Blue 171 and Reactive Blue 4) onto this biomass activated carbon were investigated in batch systems. The experimental findings showed that the removal efficiencies of three dyes onto activated carbon were maximum at the initial solution pH of 4.5 - 6.0. Thermodynamic studies suggested that adsorption reaction was an endothermic and spontaneous process. Adsorption isotherm of the three dyes obeyed Freundlich isotherm modal. Dye adsorption capacities of activated carbon were 59.88, 71.94 and 131.93 mg·g−1 for RR23, RB171 and RB4 at 27˚C, respectively. Second-order kinetic models fitted better to the equilibrium data of three dyes. The adsorption process on activated carbon was mainly controlled by intraparticle diffusion mechanism.
1. Introduction
Synthetic dyes have been increasing in textile industries for dyeing natural and synthetic fibers. Discharge of dyebearing waste-water makes an adverse effect on aquatic environment because the dyes give water undesirable color [1] and reduce light penetration and photo-synthesis [2-4]. Conventional methods used to treat colored effluents are oxidation, coagulation and flocculation, biological treatment, membrane filtration, etc. However, the single conventional treatment is unable to remove certain forms of color, particularly those arising from reactive dyes as a result of their high solubility and low biodegradability [5].
Adsorption process is an attractive and effective alternative treatment for dye removal from wastewater. There are many advantages of adsorption process, such as less land area (half or a quarter of what is required in a biological system), lower sensitivity to diurnal variation, not getting affected by toxic chemicals, greater flexibility in the design and operation and superior removal of organic contaminants [6]. Activated carbon is the most common adsorbent for the removal of many organic contaminants. The adsorption process of activated carbonhowever, is prohibitively expensive, which limits its application. Therefore, there is a need to produce activated carbon from cheaper and readily available materials. In the past years, several investigations have been reported the removal of dyes using activated carbons developed from industrial or agricultural wastes [7]. These low-cost biomass materials include sugarcane bagasse pith [6], pomegranate peel [8], coconut coir [9], sawdust [5,10], pine cone [11], walnut shell [12], rice husk [13,14], seed shell [15] and wheat shell [16].
Enteromorpha prolifera (EP), a kind of green alga, is abundantly available in many of the world’s oceans. It offers many advantages in adsorption process as their cell wall structures contain many functional groups such as amino, hydroxyl, carboxyl and sulphate, which can act as binding sites for many organic pollution materials via both electrostatic attraction and complex reaction [17]. Furthermore, it has also been proved to be a good and low-cost precursor material for the development of activated carbon [18]. However, no literature has reported the adsorption of reactive dyes onto activated carbon prepared form Enteromorpha prolifera (ACEP).
In this paper, ACEP was developed by ZnCl2 activation and applied to remove three reactive dyes from aqueous solutions. The effects of various operating parameters on the adsorption such as initial pH, dye concentration and adsorption temperature were investigated in controlled batch experiments. Finally, the thermodynamic, isotherm and dynamic mechanisms in the adsorption process were evaluated.
2. Experiments
2.1. Preparation and Characterization of ACEP
Marine alga, EP, used for the preparation of the activated carbon, was collected from the Yellow Sea coast in Qingdao, China. This EP was washed with distilled water and dried at room temperature for a week. The dried material was then milled and separated by manually shaking stainless steel mesh screens with the opening of standard 0.45 mm. 20 g of EP was immersed in 200 mL of ZnCl2 solution (28% concentration) for 12 h, and then dried in an oven for 24 h at 105˚C. The zinc treated EP was placed in a sealed ceramic oven and pyrolysed under N2 atmosphere at 350˚C for 2 h. The temperature of oven was continuously raised to 600˚C and after that it remained constant for 1 h. The resulting activated carbon was washed with hot 0.5 M HCl solution to remove excess zinc chloride, filtered and rinsed with warm water until the washings were free of zinc ions. The final product of ACEP was dried at 105˚C for 24 h and kept in desiccators for further study.
Surface morphology of the ACEP and dye-loaded samples was characterized by an S-4800F field emission scanning electron microscope (HITACHI). The surface area, total pore volume and pore distribution of ACEP were measured through N2 adsorption at −196˚C using a TRISTAR-3000 surface area and porosity analyzer (Micromeritics). IR spectra were recorded in the range 400 - 4000 cm−1 using a Thermo Nicolet FTIR spectrophotometer. The slurry pH of ACEP was measured by a PHS-3C pH meter (Shanghai Precision & Scientific Instrument Co. LTD.). pH of zero charge (pHpzc) of the samples was determined using pH drift method [19].
2.2. Preparation and Characterization of Dye Solutions
The adsorbates in this study included three reactive dyes, Reactive Red 23 (RR23), Reactive Blue 171 (RB171) and Reactive Blue 4 (RB4). All dyes were commercial grade and employed without further purification. Figure 1 illustrated their chemical structures. Molecular weight and dimension data were calculated using ChemSketch 12.0 (Advanced Chemistry Development, Toronto, Canada) and showed in Table 1. The other chemicals of analytical purity grade were purchased from Sinopharm Chemical Regent Co., Ltd. and used without any further purification.
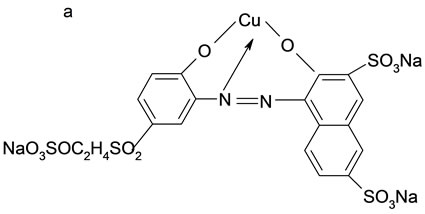
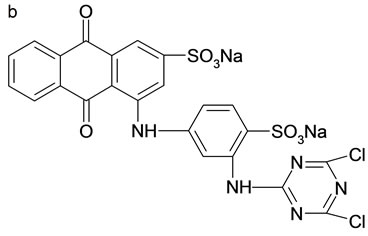
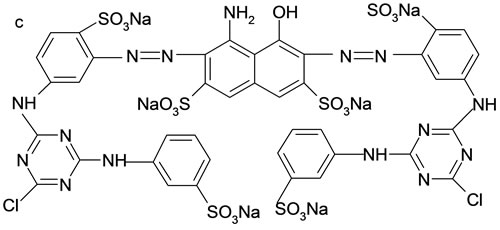
Figure 1. Structure of three reactive dye. (a) RR23; (b) RB4; (c) RB171.
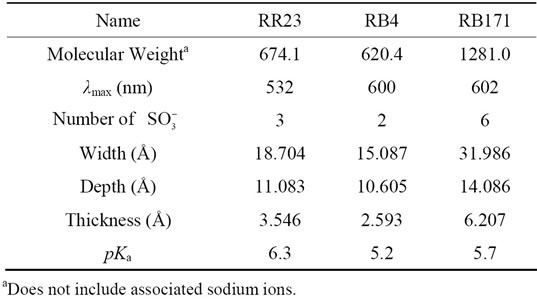
Table 1. Characterization of three reactive dyes.
The synthetic wastewaters were prepared by dissolving dyestuffs in de-ionized water to produce a stock solution of 1 g·L−1. For the batch study, aqueous solutions of these dyes were diluted from stock solutions by de-ionized water. The UV-visible spectrum of each dye solution was previously determined and identified the maximum absorption wavelength (λmax) using a UV- 2102PC UV-visible spectrometer (Unicol Instrument Co., Ltd.). Ka values of these dyes were determined according to a standard procedure [20].
2.3. Adsorption Study
Batch experiments were carried out to examine the adsorption properties of ACEP. Prior to their use, the adsorbents were oven-dried at 105˚C for 2 hours to eliminate traces of moisture. A predetermined amount of ACEP was added to 50 mL of dye solution of varying concentration (30 - 600 mg·L−1). The mixture was stirred with mechanical agitator (150 rpm) at 27˚C or 45˚C for a predetermined time. Subsequently, the suspensions were separated by filtering. The residual concentration of dye solution was determined using a calibration curve prepared at the corresponding maximum wavelength. The effect of solution pH on dye removal was investigated similarly as described above by changing the initial pH (2 - 12) adjusting by dilute HCl or NaOH. All adsorption data reported in this paper were the average values of three times.
2.4. Error Analysis
In the adsorption studies, the optimization procedure required error indicators to be defined to evaluate the validity of the isotherm and kinetics model to the experimental data. The correlation coefficient (r2) is used widely to determine the model parameters in dye adsorption process. In addition, root mean square error (RMSE) was defined to evaluate these models, which was given by Equation (1).
 (1)
(1)
where qexp and qcal are the experimentally measured and modal prediction for the amount of dyes adsorbed, respectively. Smaller RMSE represents that data from the model is similar to the experimental value, whereas larger value points out the difference between them.
3. Results and Discussions
3.1. Character of Adsorbents and Adsorbates
3.1.1. Character of ACEP
Physical characterizations of ACEP were given in Table 2. Bulk density, moisture content and ash content were determined for the activated carbon. Microstructure of ACEP plays an important role on the adsorption capacity. Figure 2 showed the SEM images of the ACEP samples
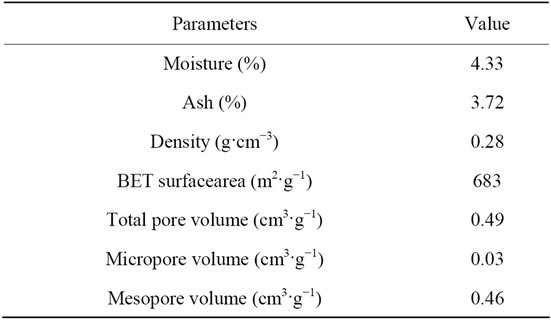
Table 2. Physical characterization of ACEP.
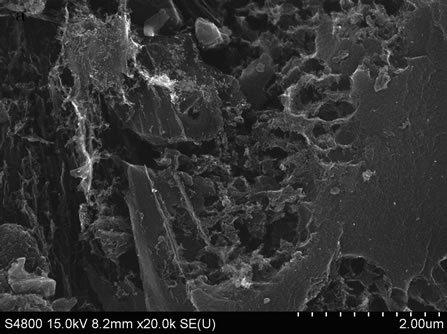
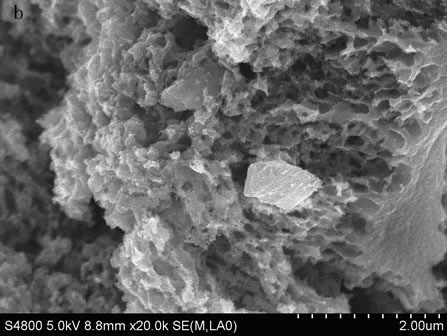

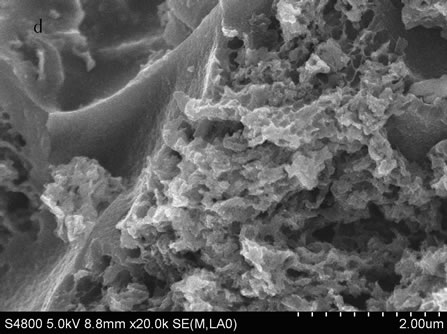
Figure 2. SEM images of ACEP and dye-loaded ACEP. (a) ACEP; (b) ACEP + RR23; (c) ACEP + RB4; (d) ACEP + RB171.
before and after adsorption. Pores of different size and different shape could be observed from Figure 2(a), revealing the potential adsorption power. It could be seen that numbers of pores on the surface of dye-loaded ACEP, suggesting that dyes were adsorbed on the mesopore or micropore. Figure 3 illustrated the N2 adsorption and pore size distribution of ACEP. The hysteresis loop at high P/P0 values revealed a type IV isotherm, typical of mesoporous solids. The pore diameter range of ACEP was 2 - 4 nm. The specific surface area and pore volume of the ACEP obtained from the N2 equilibrium adsorption isotherms were found to be 683 m2·g−1 and 0.47 cm3·g−1, respectively.
The FTIR spectra of ACEP and dye-loaded ACEP were shown in Figure 4. One could find that the most significant bands were in the regions of 3448, 2958, 1629, 1558 and 1137 cm−1 for ACEP. The broad band at 3448 cm−1 was assigned to absorbed water. A weak absorption at 2958 cm−1 was usually ascribed to the aliphatic groups (asymmetrical and symmetrical stretch of CH3). Two sharp bands located in 1629 and 1558 cm−1 corresponded to an aromatic carbon or carbonyls (stretch of C=C in aromatic rings and stretch of C=O), respectively. These bands shifted to higher frequencies after adsorbing the dyes, which indicated an aromatic carbon or carbonyls could combine with the dye molecules on the surface of activated carbon [21]. The band at 1137 cm−1 of ACEP may belong to C-O stretching in alcohol or ether or hydroxyl groups. It could be seen that the absorbance peaks in dye-loaded ACEP shifted to 1143, 1140 and 1142 cm−1 for RR23, RB171 and RB4. The above results indicated that functional groups on the surface of ACEP affected the adsorption process [21].
A number of functional groups on the surface of ACEP could result in the acid or basic character of the carbon surface, which was depicted by pH of zero charge (pHpzc). pHpzc of ACEP studied in this test was about 4.4 from “pH drift” experiment (plot not shown). At pH <
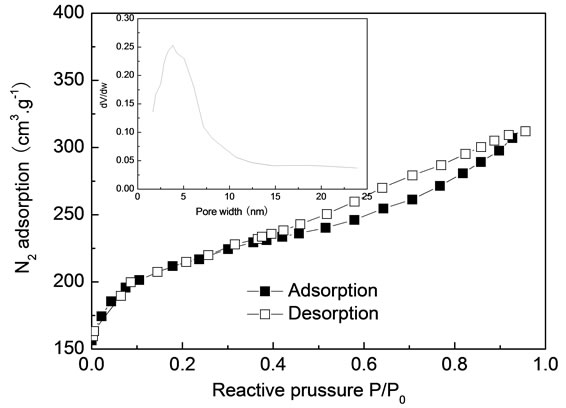
Figure 3. N2 adsorption and pore size distribution of ACEP.
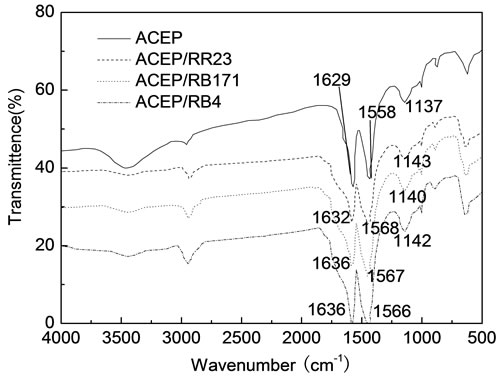
Figure 4. FTIR spectra of ACEP and dye-loaded ACEP.
pHpzc, the surface of ACEP had a net position charge, while at pH > pHpzc the surface had a net negative charge.
3.1.2. Character of Reactive Dyes
Reactive dyes present various acid-base properties in solution, which can be described by acidity constants (Ka). These constants are analyzed by the alkali-metric titration method using suitable acid or base solution. The pKa values (Table 1) of three reactive dyes were calculated by plotting the buffer intensity of dye versus the equilibrium pH (plot not shown).
3.2. Effect of Initial pH on Dye Adsorption
Solution pH determines the surface charge of the adsorbent and the degree of ionization and speciation of the adsorbate, which affects the adsorption of dyes on ACEP. Moreover, the hydrogen ion and hydroxyl ion are adsorbed strongly and subsequently decreases the adsorptions of other ions. The relationship between the initial solution pH and dye removal was illustrated in Figure 5. The removal percentages of three reactive dyes were maximum at acidic pH range of 4.5 - 6.0 and decreased with further increasing or decreasing in pH. Similar optimal pH rang that maximized the removal efficiency of reactive dyes was reported in documents [6,22]. Further adsorption experiments were carried out at optimum pH of 5.0.
Generally, electrostatic interaction between ACEP and dye molecules was the main force controlling the adsorption process. The protonated groups of activated carbon were mainly carboxylic group (-CO- ), phenolic
(-OH2+) and chromenic groups ( ) [2,23]. The deprotonated groups of reactive dyes were probably the sulphonate groups (-SO3−). In the pH range of 4.5 - 6.0, the surface of ACEP was negatively charged (pHpzc = 4.4) and reactive dyes were positively charged (pKa = 5 - 6).

Figure 5. Effect of initial solution pH on dye adsorption onto ACEP.
The strong electrostatic attraction favored the adsorption of reactive dyes onto ACEP, resulting in the high removal efficiency of dyes.
When solution pH was less than 5, the sulphonate groups of the reactive dyes were almost protonated (SO3H, i.e., neutral). Furthermore, the protonation of nitrogen atoms especially those not involved in aromatic systems was also probable [24]. The reactive dye molecules, therefore, are natural or positive charged in acidic solution. Subsequently, the attraction between reactive dyes and ACEP decreased, resulting in the slightly decreasing of dye removal [25]. The low dye removal at highly basic solution could be due to the strong repulsion interaction between the negatively charged ACEP and the deprotonated reactive dye molecules. At the same time, hydroxide ion concentration increased with the incremental solution pH, and it could be adsorbed preferentially on the surface of the activated carbon. There was competition between OH− (at high pH) and dye ions for positively charged adsorption sites. These results could be decreased evidently the removal efficiency of reactive dyes.
3.3. Effect of Temperature on Dye Adsorption and Thermodynamics
The adsorption of three reactive dyes on ACEP was studied at 27˚C and 45˚C, as shown in Figure 6. The adsorption capacities of three reactive dyes increased with the incremental temperature. For example, the values of RB171 increased from 36.4 to 41.2 mg·g−1 when the temperature improved from 27˚C to 45˚C. Two reasons could explain this result. First, the pore sizes of adsorbent particles would enlarge at elevated temperatures [20]. Second, the number of the adsorption sites would increase because of breaking of some internal bonds near the edge of active surface sites of adsorbent [26].
The thermodynamic parameters, i.e., free energy  , enthalpy
 , and entropy
 , were calculated using the following equations:
 (2)
(2)
 (3)
(3)
 (4)
(4)
where K (L·mg−1), R (J·mol−1·K−1) and T (K) are the equilibrium constant of the adsorption process, gas constant and absolute temperature, respectively. Table 3 summarized the thermodynamic parameters for the adsorption of reactive dyes on ACEP.  was negative values at 27˚C and 45˚C, indicating the favorable and spontaneous adsorption process of reactive dyes on ACEP. The positive values of
  for each dye suggested the endothermic nature of the adsorption process. The positive values of
  revealed the increased randomness at the solid/solution interface during the adsorption of dyes in aqueous solution on ACEP. Similar results were also observed in the adsorption of Remazol Brillant Blue, Remazol Red 133 and Rifacion Yellow HED on activated carbon [2] and in the sorption of methylene blue onto coconut coir activated carbon [8]. However, different results were also found by other researchers for the adsorption of dyes on various adsorbents [7,27].
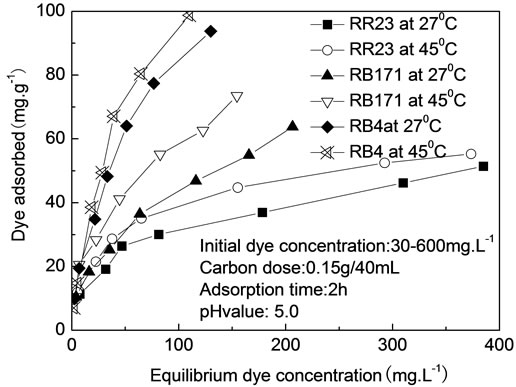
Figure 6. Effect of adsorption temperature on dye adsorption onto ACEP.
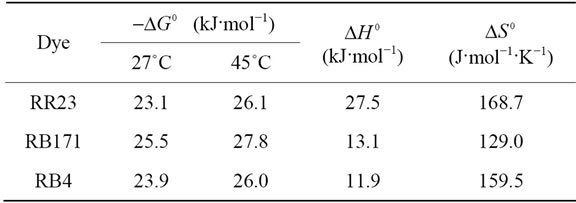
Table 3. Thermodynamic parameters for the adsorption of reactive dyes onto ACEP.
3.4. Equilibrium Isotherm of Dye Adsorption
The adsorption isotherm data (Figure 7) revealed that the amount of dye adsorbed increased with increasing equilibrium concentration of dyes. However, the adsorption reached a maximum capacity due to nearly complete coverage of the active sites at high dye concentrations. For solid-liquid system, adsorption isotherm is important in description of adsorption behavior. In this work, two well-known models of Freundlich and Langmuir isotherm would be evaluated.
3.4.1. Freundlich Isotherm
The Freundlich isotherm is an empirical equation employed to describe heterogeneous systems. The linear form of Freundlich equation is given by Equation (5).
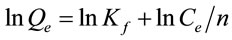 (5)
(5)
where Qe (mg·g−1) and Ce (mg·L−1) are defined as the amount of dye adsorbed per unit weight of adsorbent and equilibrium liquid-phase concentration, respectively. Kf (mg·g−1) is defined as an adsorption or distribution coefficient, representing the amount of adsorbate adsorbed on an adsorbent for a unit equilibrium concentration. The slope 1/n is a parameter of the adsorption intensity or surface heterogeneity.
Figure 7(a) presented the Freundlich isotherm plots of three reactive dyes adsorption onto ACEP. The model parameters calculated from the linear plots and the two indictors were shown in Table 4. The high regression correlation coefficients (>0.98) and the small RMSE values (RMSE = 1.694 - 2.717) suggested that Freundlich model was applicable to describe the reactive dyes adsorption equilibrium onto ACEP. The high values of Kf (Kf = 5.397 - 7.133 mg·g−1) indicated that ACEP had a higher adsorption capacity and affinity for the dye molecules. The n values were in range of 1.604 - 2.787 for all dyes, which revealed the favorable adsorption.
3.4.2. Langmuir Isotherm
The Langmuir isotherm assumes uniform energies of adsorption onto the surface and no transmigration of the adsorbate in the plane of the surface. This model is expressed in the linear form by Equation (6).
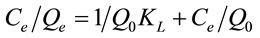 (6)
(6)
where Q0 (mg·g−1) is a constant related to the area occupied by a monolayer of adsorbate, reflecting the maximum adsorption capacity. KL (L·mg−1) is a direct measure of the intensity of the sorption. Figure 7(b) described the plots of Ce/Qe against Ce using linear regression analysis (MATLAB 7.5). The constants Q0 and KL (Table 4) were determined from the intercept and slope


Figure 7. Freundlich (a) and langmuir (b) isotherm of reactive dyes onto ACEP.
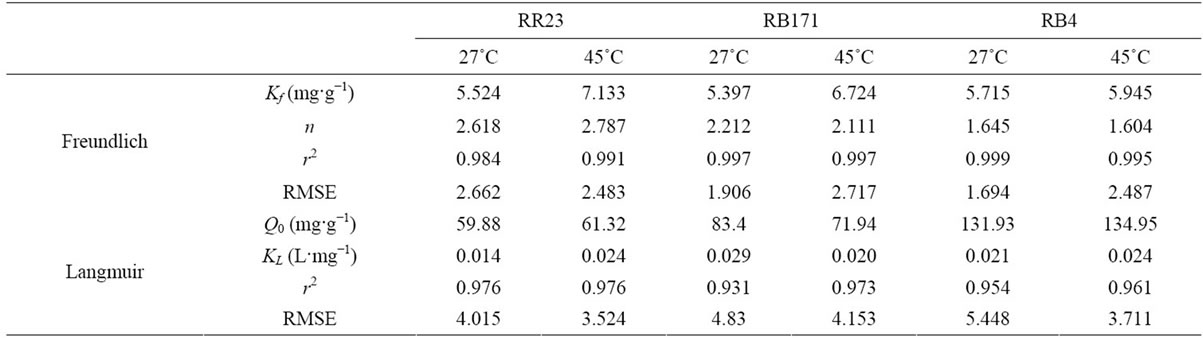
Table 4. Isotherm constant for the freundlich and langmuir isotherm.

Table 5. Comparison of adsorption capacities on activated carbon from waster biomass materials.
of the linear plots. The Q0 from the Langmuir isotherm increased with the incremental temperature. And the values were 59.88, 71.94 and 131.93 mg·g−1 for RR23, RB171 and RB4 at 27˚C, respectively.
Numerous biomass materials were used as precursors to develop activated carbon. Activated carbon from different waste materials displayed various adsorption properties. Table 5 showed the comparison of the adsorption capacities of dyes onto activated carbon prepared from waste biomass materials. The maximum adsorption capacity was 456 mg·g−1 in the adsorption of reactive orange 16 onto activated carbon derived from Brazilian-pine fruit shell [29], and the minimum was 3.53 mg·g−1 in adsorption of reactive orange by activated carbon prepared from walnut shell [12]. ACEP had a higher adsorption capacity of 59.88 - 134.95 mg·g−1, suggesting that it was a promising adsorbent to remove reactive dyes from aqueous solutions.
3.5. Dynamic Study
Adsorption kinetics shows the dependence on the physical and chemical characteristics of the adsorbent material and adsorbate species. Figure 8 depicted the effect of
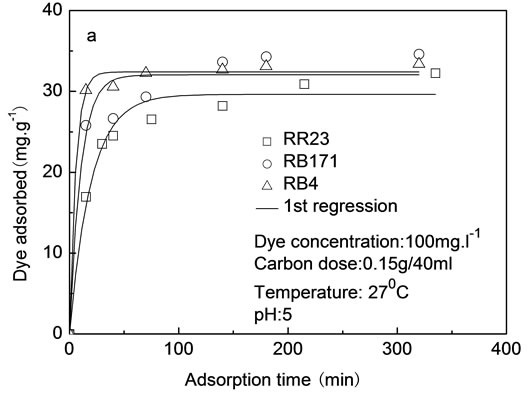

Figure 8. Lagergren first-order (a) and pseudo-secondorder (b) kinetics of dyes onto ACEP.
contact time on adsorption capacity. The adsorption process included two stages: the first rapid stage and the later slow stage. The adsorption of reactive dyes was rapid in the first 20 minutes, and subsequently, increased gradually with the prolongation of contact time.
The first and the second order rate equations were used to determine the most suitable rate expression for adsorption of the said dyes on ACEP, which are defined as follow:
 (7)
(7)
 (8)
(8)
where q (mg·g−1) is the amount of material adsorbed at time t, qe(mg·g−1) is the adsorption capacity at equilibrium, k1 (min−1) and k2 (g·mg−1·min−1) represents the rate constant of the first-order and the second-order model.
Batch dynamic parameters were obtained using nonlinear regression analysis (MATLAB 7.5). Figure 8 depicted these experiment data and modal prediction. Table 6 showed the calculated adsorption parameters and the two indicators using each of the modal.
For the first-order model, the small r2 values (r2 ≤ 0.95)
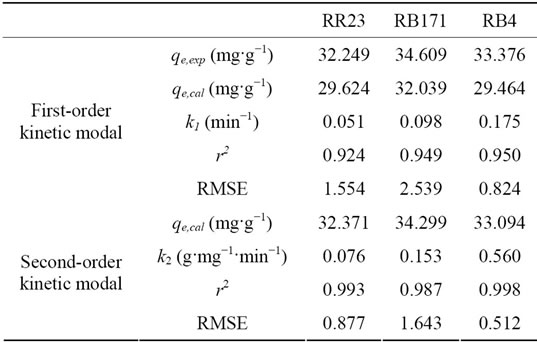
Table 6. Comparison of the first and second order rate constants at initial dye concentration of 100 mg·L−1.
and large RMSEs (0.824 - 2.539) indicated this model was insufficient to describe the adsorption process of reactive dyes on ACEP. Further, the calculated equilibrium adsorption capacities did not agree with experimental values. For the pseudo-second-order kinetics modal, the correlation coefficients were 0.987 - 0.998 and the RMSEs were 0.512 - 1.643, which revealed pseudo second order modal was applicable to the adsorption kinetics. Based on the pseudo second-order model, these observations indicated that the rate of dye adsorption process was controlled by the chemi-sorption process, which was depended on the chemical character of ACEP and dyes [31].
3.6. Adsorption Controlling Mechanism
A number of mechanisms were suggested to control the adsorption rate of dye-adsorbent systems because the first-order and the second-order model can not to identify the diffusion mechanism. Of the mechanisms mentioned above, external diffusion and intraparticle diffusion were important in dye adsorption process.
In order to understand the adsorption rate controlling mechanism, a mathematical modal was used to determine the intraparticle diffusion coefficient. Intraparticle diffusion, D, the sum of pore and surface diffusion, may simply be calculated from the following Equation (9) [32].
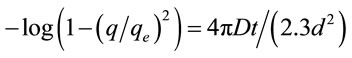 (9)
(9)
where d (μm) is the mean diameter of spherical particles. The D values were calculated from the slope of the plots and showed in Table 7. One could be found the values were in range of 0.21 × 10⁻⁷ - 2.15 × 10⁻⁷ cm2·s−1, and fall well within the magnitudes reported in literature [33], specifically for chemisorption systems (10−5 to 10−13 cm2·s−1). The intraparticle diffusion coefficient decreased in the order RB4 > RR23 > RB171. This may be explained by the fact that the volume of dye molecular increased and subsequently hindered the pore diffusion.
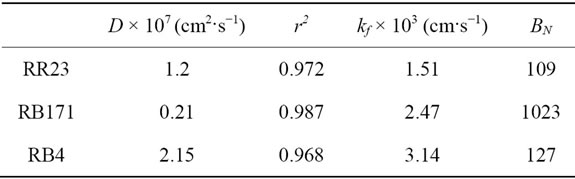
Table 7. Diffusion coefficient of reactive dyes onto ACEP.
The external diffusion model assumes that the concentration at the adsorbent surface tends to zero and the intraparticle diffusion was negligible at early times of contact [34]. The change in concentration of adsorbates with respect to the time is related by the following Equation (10) [35]:
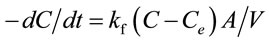 (10)
(10)
where C (mg·L−1) and Ce (mg·L−1) are the concentration at time t and at equilibrium, respectively. A/V is the total interfacial area of the particles to the total solution volume, which can be determined by Equation (11).
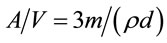 (11)
(11)
where m (g·cm−3) is the adsorbent dosage, and ρ (g·cm−3) is the apparent density of the adsorbent. Using the initial conditions (i.e., C = C0 and Ce = 0 at t = 0), therefore
 (12)
(12)
The external diffusion coefficient kf can be obtained using differential calculation in MATLAB 7.5. Table 7 showed the calculated external mass transfer coefficient, kf (cm·s−1). The maximum value was 3.14 × 10⁻³ cm·s−1 for RB4 and the minimal one was 1.51 × 10⁻³ cm·s−1 for RR23.
The Biot number is used to determine the predominance of surface diffusion against external diffusion, which can be estimated from the Equation (13).
 (13)
(13)
Table 7 showed the calculated Biot numbers in reactive dye adsorption. All Biot number was higher than 100, which suggested that adsorption of reactive dyes on ACEP was mainly controlled by intraparticle diffusion mechanism [36].
4. Conclusions
1) The adsorption of reactive dyes onto ACEP was a pH-dependent process with the maximum removal efficiency at the initial pH of 4.5 - 6.0. Thermodynamic studies suggested that adsorption reaction onto ACEP was an endothermic and spontaneous process.
2) Freundlich isotherm described the equilibrium data of dyes on ACEP better than Langmuir isotherm. The adsorption capacities from the Langmuir isotherm were 59.88, 71.94 and 131.93 mg·g−1 for RR23, RB171 and RB4 at 27˚C, respectively.
3) Adsorption processes for reactive dyes were found to follow the pseudo second-order kinetics rate expression. The Biot number confirmed the intraparticle diffusion as the rate-limiting step in the dye adsorption process.
5. Acknowledgements
The authors wish to acknowledge the financial support from National Natural Science Foundation of China (Contract No. 21206080), from Postdoctoral Innovation Fund of Shandong Province (Contract No. 201203027), and from Ministry of Water Resources Special Funds for Scientific Research on Public Causes (200901063).
REFERENCES
- S. Ibrahim, I. Fatimah, H. Ang and S.Wang, “Adsorption of Anionic Dyes in Aqueous Solution Using Chemically Modified Barley Straw,” Water Science and Technology, Vol. 62, No. 5, 2010, pp. 1177-1182. doi:10.2166/wst.2010.388
- Y. S. Al-Degs, M. I. El-Barghouthi, M. A. Khraisheh, M. N. Ahmad and S. J. Allen, “Effect of Surface Area, Micropores, Secondary Micropores and Mesopores Volumes of Activated Carbons on Reactive Dyes Adsorption from Solution,” Separation Science and Technology, Vol. 39, No. 1, 2004, pp. 97-111. doi:10.1081/SS-120027403
- S. Wang, Y. Boyjoo, A. Choueib and H. Zhu, “Removal of Dyes from Solution Using Fly Ash and Red Mud,” Water Research, Vol. 39, No. 1, 2005, pp. 129-138. doi:10.1016/j.watres.2004.09.011
- B. C. Oei, S. Ibrahim, S. Wang and H. Ang, “Surfactant Modified Barley Straw for Removal of Acid and Reactive Dyes from Aqueous Solution,” Bioresource Technology, Vol. 100, No. 18, 2009, pp. 4292-4295. doi:10.1016/j.biortech.2009.03.063
- K. Vijayaraghavan, S. W. Won and Y. Yun, “Treatment of Complex Remazol Dye Effluent Using Sawdustand Coal-Based Activated Carbons,” Journal of Hazardous Materials, Vol. 167, No. 1-3, 2009, pp. 790-796. doi:10.1016/j.jhazmat.2009.01.055
- N. K. Amin, “Removal of Reactive Dye from Aqueous Solutions by Adsorption onto Activated Carbons Prepared from Sugarcane Bagasse Pith,” Desalination, Vol. 223, No. 1-3, 2008, pp. 152-161. doi:10.1016/j.desal.2007.01.203
- M. A. M. Salleh, D. K. Mahmoud, W. A. Karim and A. Idris, “Cationic and Anionic Dye Adsorption by Agricultural Solid Wastes: A Comprehensive Review,” Desalination, Vol. 280, No. 1-3, 2011, pp. 1-13. doi:10.1016/j.desal.2011.07.019
- N. K. Amin, “Removal of Direct Blue-106 Dye from Aqueous Solution Using New Activated Carbons Developed from Pomegranate Peel: Adsorption Equilibrium and Kinetics,” Journal of Hazardous Materials, Vol. 165, No. 1-3, 2009, pp. 52-62. doi:10.1016/j.jhazmat.2008.09.067
- Y. C. Sharma and S. N. U. Upadhyay, “Removal of a Cationic Dye from Wastewaters by Adsorption on Activated Carbon Developed from Coconut Coir,” Energy and Fuel, Vol. 23, No. 6, 2009, pp. 2983-2988. doi:10.1021/ef9001132
- P. K. Malik, “Use of Activated Carbons Prepared from Sawdust and Rice-husk for Adsorption of Acid Dyes: A Case Study of Acid Yellow 36,” Dyes and Pigments, Vol. 56, No. 3, 2003, pp. 239-249. doi:10.1016/S0143-7208(02)00159-6
- N. M. Mahmoodi, B. Hayati and C. Lan, “Adsorption of Textile Dyes on Pine Cone from Colored Wastewater: Kinetic, Equilibrium and Thermodynamic Studies,” Desalination, Vol. 268, No. 1-3, 2011, pp. 117-125. doi:10.1016/j.desal.2010.10.007
- A. Aygun, S. Yenisoy-Karakas and I. Duman, “Production of Granular Activated Carbon from Fruit Stones and Nutshells and Evaluation of Their Physical, Chemical and Adsorption Properties,” Microporous and Mesoporous Materials, Vol. 66, No. 2-3, 2003, pp. 189-195. doi:10.1016/j.micromeso.2003.08.028
- N. Kannan and M. M. Sundaram, “Kinetics and Mechanism of Removal of Methylene Blue by Adsorption on Various Carbons—A Comparative Study,” Dyes and Pigments, Vol. 51, No. 1, 2001, pp. 25-40. doi:10.1016/S0143-7208(01)00056-0
- V. K. Gupta, A. Mittal, R. Jain, M. Mathur and S. Sikarwar, “Adsorption of Safranin T from Wastewater Using Waste Materials-Activated Carbon and Activated Rice Husk,” Journal of Colloid and Interface Science, Vol. 303, No. 1, 2006, pp. 80-86. doi:10.1016/j.jcis.2006.07.036
- N. Thinakaran, P. Panneerselvam, P. Baskaralingam, D. Elango and S. Sivanesan, “Equilibrium and Kinetic Studies on the Removal of Acid Red 114 from Aqueous Solutions Using Activated Carbons Prepared from Seed Shells,” Journal of Hazardous Materials, Vol. 158, No. 1, 2008, pp. 142-150. doi:10.1016/j.jhazmat.2008.01.043
- P. D. Saha, A. Dey and P. Marik, “Batch Removal of Chromium(VI) from Aqueous Solutions Using Wheat Shell as Adsorbent: Process Optimization using Response Surface Methodology,” Desalination Water Treatment, Vol. 39, No. 1-3, 2012, pp. 95-102. doi:10.1080/19443994.2012.669164
- A. Öer, G. Gürbüz, A. Çalimli and B. K. Köbahti, “Biosorption of Copper(II) Ions on Enteromorpha Prolifera: Application of Response Surface Methodology,” Chemical Engineering Journal, Vol. 146, No. 3, 2009, pp. 377- 387. doi:10.1016/j.cej.2008.06.041
- R. Aravindhan, J. R. Rao and B. U. Nair, “Preparation and Characterization of Activated Carbon from Marine Macro-Algal Biomass,” Journal of Hazardous Materials, Vol. 162, No. 2-3, 2009, pp. 688-694. doi:10.1016/j.jhazmat.2008.05.083
- D. Mohan, K. P. Singh, G. Singh and K. Kumar, “Removal of Dyes from Wastewater Using Flyash, a LowCost Adsorbent,” Industrial & Engineering Chemistry Research, Vol. 41, No. 15, 2002, pp. 3688-3695. doi:10.1021/ie010667+
- N. Dizge, C. Aydiner, E. Demirbas, M. Kobya and S. Kara, “Adsorption of Reactive Dyes from Aqueous Solutions by Fly Ash: Kinetic and Equilibrium Studies,” Journal of Hazardous Materials, Vol. 150, No. 3, 2008, pp. 737-746. doi:10.1016/j.jhazmat.2007.05.027
- V. K. Gupta and A. Rastogi, “Biosorption of Hexavalent Chromium by Raw and Acid-treated Green Alga Oedogonium Hatei from Aqueous Solutions,” Journal of Hazardous Materials, Vol. 163, No. 1, 2009, pp. 396-402. doi:10.1016/j.jhazmat.2008.06.104
- Y. S. Al-Degs, M. I. El-Barghouthi, A. H. El-Sheikh and G. M. Walker, “Effect of Solution pH, Ionic Strength, and Temperature on Adsorption Behavior of Reactive Dyes on Activated Carbon,” Dyes and Pigments, Vol. 77, No. 1, 2008, pp. 16-23. doi:10.1016/j.dyepig.2007.03.001
- Y. S. Al-Degs, M. A. M. Khraisheh, S. J. Allen and M. N. Ahmad, “Effect of Carbon Surface Chemistry on the Removal of Reactive Dyes from Textile Effluent,” Water Research, Vol. 34, No. 3, 2000, pp. 927-935. doi:10.1016/S0043-1354(99)00200-6
- S. Wang and H. T. Li, “Dye Adsorption on Unburned Carbon: Kinetics and Equilibrium,” Journal of Hazardous Materials, Vol. 126, No. 1-3, 2005, pp. 71-77. doi:10.1016/j.jhazmat.2005.05.049
- A. R. Dinçr, Y. Güneş, N. Karakaya and E. Güneş, “Comparison of Activated Carbon and Bottom Ash for Removal of Reactive Dye from Aqueous Solution,” Bioresource Technology, Vol. 98, No. 4, 2007, pp. 834-839. doi:10.1016/j.biortech.2006.03.009
- J. Acharya, J. N. Sahu, C. R. Mohanty and B. C. Meikap, “Removal of Lead(II) from Wastewater by Activated Carbon Developed from Tamarind Wood by Zinc Chloride Activation,” Chemical Engineering Journal, Vol. 149, No. 1-3, 2009, pp. 249-262. doi:10.1016/j.cej.2008.10.029
- M. Matheswaran and T. Karunanithi, “Adsorption of Chrysoidine R by Using Fly Ash in Batch Process,” Journal of Hazardous Materials, Vol. 145, No. 1-2, 2007, pp. 154- 161. doi:10.1016/j.jhazmat.2006.11.006
- N. K. Amin, “Removal of Reactive Dye from Aqueous Solutions by Adsorption onto Activated Carbons Prepared from Sugarcane Bagasse Pith,” Desalination, Vol. 223, No. 1-3, 2008, pp. 152-161. doi:10.1016/j.desal.2007.01.203
- B. T. Calvete, E. C. Lima, N. F. Cardoso and C. P. Vaghetti, “Application of Carbon Adsorbents Prepared from Brazilian-Pine Fruit Shell for the Removal of Reactive Orange 16 from Aqueous Solution: Kinetic, Equilibrium, and Thermodynamic Studies,” Journal of Environmental Management, Vol. 91, No. 8, 2010, pp. 1695-1706. doi:10.1016/j.jenvman.2010.03.013
- S. Senthilkumaar, P. Kalaamani, K. Porkodi, P. R. Varadarajan and C. V. Subburaam, “Adsorption of Dissolved Reactive Red Dye from Aqueous Phase onto Activated Carbon Prepared from Agricultural Waste,” Bioresource Technology, Vol. 97, No. 14, 2006, pp. 1618-1625. doi:10.1016/j.biortech.2005.08.001
- A. A. Ahmad, B. H. Hameed and N. Aziz, “Adsorption of Direct Dye on Palm Ash: Kinetic and Equilibrium Modeling,” Journal of Hazardous Materials, Vol. 141, No. 1, 2000, pp. 70-76. doi:10.1016/j.jhazmat.2006.06.094
- M. A. M. Khraisheh, Y. S. Al-Degs, S. J. Allen and M. N. Ahmad, “Elucidation of Controlling Steps of Reactive Dye Adsorption on Activated Carbon,” Industrial & Engineering Chemistry Research, Vol. 41, No. 6, 2002, pp. 1651-1657. doi:10.1021/ie000942c
- D. Chazopoulos, A. Varma and R. L. Irvine, “Activated Carbon Adsorption and Desorption of Toluene in the Aqueous Phase,” AIChE Journal, Vol. 39, No. 12, 1993, pp. 2027-2041. doi:10.1002/aic.690391213
- S. Rengaraj and S. H. Moon, “Kinetic of Adsorption of Co(II) Removal from Water and Wastewater by Ion Exchange Resins,” Water Research, Vol. 36, No. 7, 2002, pp. 1783-1793. doi:10.1016/S0043-1354(01)00380-3
- K. V. Kumar and K. Porkodi, “Mass Transfer, Kinetics and Equilibrium Studies for the Biosorption of Methylene Blue Using Paspalum Notatum,” Journal of Hazardous Materials, Vol. 146, No. 1-2, 2007, pp. 214-226. doi:10.1016/j.jhazmat.2006.12.010
- R. Apiratikul, V. Madacha and P. Pavasant, “Kinetic and Mass Transfer Analyses of Metal Biosorption by Caulerpa Lentillifera,” Desalination, Vol. 278, No. 1-3, 2011, pp. 303-311.
NOTES
*Corresponding author.