American Journal of Analytical Chemistry
Vol.4 No.4(2013), Article ID:30443,14 pages DOI:10.4236/ajac.2013.44023
Safety of Lebanese Bottled Waters: VOCs Analysis and Migration Studies
UMR (Emballages Alimentaires au Liban), Faculty of Sciences II, Lebanese University, Jdeidet El-Matn, Lebanon
Email: *alghanem@ul.edu.lb
Copyright © 2013 Aline Ghanem et al. This is an open access article distributed under the Creative Commons Attribution License, which permits unrestricted use, distribution, and reproduction in any medium, provided the original work is properly cited.
Received February 26, 2013; revised March 26, 2013; accepted April 20, 2013
Keywords: BTEX; Styrene; HS-SPME-GC/FID; SPE-GC/FID
ABSTRACT
Despite the worldwide increase in the consumption of PET-bottled mineral waters compared to tap waters encouraged by its microbiological and chemical safety for public health, contaminants could migrate from the plastic packaging into the water and induce adverse effects on human health. Volatile organic compounds (VOCs), including benzene, toluene, ethylbenzene, ortho, meta, and para-xylenes (BTEX), styrene, chlorobenzene and benzaldehyde are among the potential contaminants of bottled waters. This study aimed to assess Lebanese PET-bottled waters, in respect of VOCs contents, with comparison to polycarbonate-bottled and tap waters. Both HS-SPME-GC/FID and SPE-GC/FID were optimized and validated for VOCs determination in the waters, and their performances were compared. The HS-SPME-GC/FID was valid (Afnor NF T 90-210 (May 2009)) for all the studied molecules with limits of quantifications (LOQ) far lower the maximum contaminants levels (MCLs) set by both US-EPA and WHO. SPE-GC/FID was valid only for ethylbenzene, m/p-xylenes, o-xylene, and styrene, with poorer LOQs. HS-SPME-GC/FID was used therefore for VOCs monitoring in studied water samples showing the safety of the Lebanese bottled-water. The effects of bottles storage conditions (time, and exposure to sunlight) on VOCs migration were also studied.
1. Introduction
Bottled drinking water consumption is increasing especially in developing countries, due to safety reasons, because in these countries tap water is rarely submitted to control and monitoring to ensure its chemical and microbiological quality. Various contaminants including aldehydes and phthalates occur in bottled ad tap waters [1-3]. Volatile organic compounds (VOCs), such as benzene, toluene, ethylbenzene, ortho, meta, and para-xylenes called (BTEX), as well as styrene, chlorobenzene and benzaldehyde may also be present in bottled and tap waters [4] due to: 1) their relatively high solubility in water which is 18, 25, 3, 20, 50, 100, 300, 500 and 4600 mg·L−1, respectively [5], 2) their non-intentionally addition to PET during its production and therefore their potential migration from bottles to waters, and to 3) the environmental contamination from industrial activities of springs, ground and surface waters from which drinking waters are derived. The contamination of the aforementioned environmental matrices by VOCs is one of the consequences of the environmental pollution by waste solvents, oils and sewage, gasoline cars and pesticides, which leads to the VOCs transfer to drinking waters [5,6].
Another source of these VOCs in bottled mineral waters is the plastic packaging. The polyethylene terephthalate (PET) is the most commonly used especially for making water bottles below 7 liters. This polymer is obtained by polymerization of ethylene glycol (MEG) with terephthalic acid (TPA) or dimethylterephtalate (DMT). After this first step, a second polycondensation is carried out with antimony-, germaniumor titanium-based catalyst [7,8]. Then the PET obtained as granules is submitted to an extrusion process at 285˚C to produce preforms, and subsequently to a blow molding process between 95 and 100˚C, which gives the bottle its final form [9]. Polycarbonate (PC) is used to make water containers above 7 liters. Most migration studies concerned the migration of bisphenol A (BPA) from PC bottles [10,11]; however, other compounds might be present in PC-bottled food and waters and deserve therefore an investigation.
BTEX are used worldwide as solvents and chemical intermediates in plastic production [12]; whereas styrene derived from composites of PET with polystyrene (PS) [13]. Residual traces of these VOCs might migrate from PET bottles to the bottled water. Otherwise and during injection-blowing, high-temperature is able to cause the degradation of PET and the appearance of by-products including VOCs which can leach out, by diffusion into the water after bottling [3]. Similarly it is shown that the rate of the secondary products in PET increases exponentially with the applied temperature, especially for benzene [14]. Also the presence of oxygen [15] and humidity can promote degradation reactions [16]. Finally the migration of these pollutants from PET to bottled water is held according to the partition and the diffusion coefficient of each compound between the two mediums. Chemical migration increases with the storage time, the exposure to UV light and to the high temperature.
Dutra et al. [17] have shown the presence of benzaldehyde in PET virgin bottles without being present in the granules before their formatting. This may be due to a degradation of the polymer during the process. In addition the detection of this VOC by several studies in the recycled PET [18,19] allows us to consider that its presence in bottled mineral water is an indicator that the used PET is totally or partly recycled, because benzaldehyde is used as solvent for printing inks used for bottles labelling.
Today, the water contamination with VOCs is a topical issue challenging not only the scientific community for developing suitable and sensitive analytical methods, but is worrying as well for environmental, social and public health concerns. Due to the toxicity (carcinogenic or mutagenic properties) of the VOCs even at trace levels, many countries focus their research on the monitoring of these contaminants in waters [20].
Food contact plastic materials are covered by the European regulation N˚ 10/2011 which establishes the list of authorized compounds for use in plastic formulation and sets restrictions for individual authorized substances expressed as specific migration limits (SML) [21]. Also the US-Environmental Protection Agency (EPA) [22] and the World Health Organization (WHO) [23] set maximum concentration levels (MCLs) for the potential migrants in drinking water. These values are relatively low for the VOCs, especially for benzene which are of 5 and 10 µg·L−1 for EPA and WHO, respectively.
The Purge and trap-GC/MS technique is adopted by the U.S.EPA 524.2 method [24] as the most widely used for the analysis of VOCs in water, allowing low detection limits (LOD) of 0.1 µg·L−1 for BTEX and styrene, far below their MCLs [4,25]. Flame ionization detector (FID) allows less sensitivity with LODs ranging between 0.3 and 2.4 µg·L−1 [7]. The use of photoionization detector (PID) shows LODs between 5.6 and 7.2 µg·L−1 [26]. However the drawbacks of the Purge and trap are the requirement of complex instrumentation, the interference of water vapor generated at the purge stage, the possible contamination of the trap (cross contamination), longer analysis time per sample, and its nonavailability in all analytical laboratories.
HS-GC/MS arises as an alternative method with a LOD of 0.02 µg·L−1 [27]. The replacement of the MS by FID or PID detector allows LOD between 0.2 and 7.5 µg·L−1 which is not adequate for all VOCs [28]. Head space solid phase dynamic extraction (HS-SPDE) coupled to GC/MS is a very efficient technique with a LOD of 20 ng·L−1, but it is not available in all laboratories [29]. Another fast method is the direct aqueous injection DAIGC/MS that allows LOD ranging from 0.6 to 1.1 µg·L−1 [30,31]. This technique requires the use of an absorbing material in the liner of the injection port and a temperature below 70˚C to the injector, to prevent the passage of water to the separation column. But this temperature is not adequate for the separation of VOCs with a higher boiling point.
Solid phase extraction (SPE) is a widely used technique for sample preparation including purification and concentration in a single step with the use of a small volume of solvent eluent. SPE-GC/MS gives a LOD between 6 and 10 µg·L−1 [32], because of the loss of VOCs by volatility during sample concentration [33]. In the literature, some authors suggest the conservation of the sample and the elution solvent at 4˚C, or the addition of a Cetrimonium bromide (CTAB) surfactant in the sample, to limit the loss of VOCs by formation of micelles and subsequently ensure a good recovery [34].
The solid phase micro extraction (SPME) is used as an alternative extraction technique offering the advantages to be simple, fast and does not require solvents (green and environmentally friendly technique). In immersion and head space mode, the LOD is between 0.01 and 0.5 µg·L−1 with GC/MS [17,35-37] and between 0.01 and 1 µg·L−1 with GC/FID [38-41]. However the HS mode has proven to be more advantageous because it often shows an important reduction of extraction time [41].
The objective of our work is to verify the safety of mineral bottled waters in Lebanon in respect to the VOCs contamination. Analytical methods involving HS-SPMEGC/FID and SPE-GC/FID were developed and their performances were compared. Optimization of the parameters of each technique was accomplished by using the methodology of the experimental design [42]. Methods validation was carried out following the Afnor NFT 90 - 210 (May 2009) criteria. The methods were applied to monitor VOCs in Lebanese bottled water samples with comparison to tap waters in order to assess the safety of the drinking water in our country. A study of the VOCs migration from the PET to the bottled waters was carried out involving the storage time, and the exposure to sunlight.
2. Materials and Methods
2.1. Chemicals and Standards
Ethylbenzene (98%), m/p-xylene (99%), styrene (99%), o-xylene (98%), fluorobenzene (99%) (Internal Standard, IS) and benzaldehyde (98%) were purchased from Sigma-Aldrich (Steinheim, Germany); benzene (extra pur) was purchased from Merck (Germany); toluene (99.7%) from Fluka Analytical (St. Louis, MO, USA) and chlorobenzene (99%) from Riedel de Haën (Seelze, Germany). All chemicals and solvents used were of analytical-reagent and chromatographic grade, respectively. The 0.45 µm filtered ultrapure water (conductivity 0.055 µS/cm) was used for solutions preparation and was generated by “TKA” Smart 2 Pure Water System (Niederelbert, Germany). Stock solutions of mixture compounds were prepared in acetonitrile at 500 mg·L−1. The working standard solutions of all volatile organic compounds were prepared by diluting the stock solution in water.
2.2. Sample Collection
Different samples of mineral bottled water were collected from the Lebanese market. Sampling was performed mainly according to the following criteria: bottle brand and type (PET, PC, or glass), bottle volume (0.33, 0.5, 1, 1.5, 2, and 6 liters for PET, 18.9 liters for PC and 0.75 liters for glass). Comparison was made with tap water. All samples were analyzed within their validity date (before expiry date as mentioned on the bottle), during the year 2010-2011.
In addition, the effect of storage mode of PET-bottles on the migration of VOCs into the bottled water was also evaluated. For this part of study, PET-bottled water samples from different brands and sizes were collected in duplicate and were divided into two equivalent groups (same batch number) to be stored during 5 months before analysis: one was stored at dark at 20˚C as mean temperature and one in open air under sunlight (35˚C as mean temperature).
To assess the quality of the PET-bottled water samples at their expiry date (Directive 2002/72/EC), a series of PET-bottled samples (0.5 L) were analyzed freshly after collection and 10 similar samples were incubated at 40˚C during 10 or 20 days, then analyzed and the results were compared.
2.3. Analytical Procedures
For HS-SPME, a 10 mL of sample solution containing 10 µg·L−1 of fluorobenzene as internal standard was undertaken, added to a 20 mL sample vial equipped with a PTFE-coated septum. A 65 µm PDMS/DVB fiber was used to extract the VOCs from water samples. Duplicate analyses were performed under the following conditions: extraction temperature (25˚C), extraction time (31 min), NaCl concentration (0.2 g·mL−1), and sample solution stirring.
SPE extraction was carried out on a VisiprepTM SPE Vacuum Manifold (Sigma-Aldrich, Steinheim, Germany). The SampliQ C18 SPE cartridges (500 mg, 6 mL) provided from Agilent (USA) were conditioned by flushing 10 mL of methanol followed by 10 mL of ultrapure water. Water samples (330 mL) were loaded on the cartridges at a flow rate of 3 mL·min−1. The cartridges were then rinsed with 3 mL of water and analytes were eluted in 10 mL of acetonitrile containing 108 µL of dodecane, added as keeper to decrease the rate of VOCs volatilization. Sample concentration was then carried out under a stream of nitrogen until 50% of evaporation of the extract volume. After SPE concentration, 1 µL of the sample were injected in the GC injector set on splitless mode.
Chromatographic separation was performed on a gas chromatograph (Agilent technologies 6890N Series N.05. 04) equipped with FID detector. The data acquisition and processing were done using Agilent Chem Station software. The separation of BTEX (benzene, toluene, ethylbenzene, and xylenes), styrene, chlorobenzene and benzaldehyde was carried out on a DB-5 column (30 m × 0.25 mm i.d.) with 1 µm of film thickness. The GC oven temperature was programmed as follows: 50˚C held for 3 min, rate at 15˚C/min to 90˚C and held for 3 min; rate 15˚C/min to 60˚C and held for 2 min and finally rate 15˚C/min to 140˚C and held for 4 min. The total time for each GC run was 22 min. Helium, at a constant flow rate of 2 mL/min, was used as the carrier gas. The injector and detector temperatures were set at 250˚C and 300˚C, respectively. For HS-SPME, the injection port fitted with a 0.75 mm i.d. injection liner (Supelco, Sigma-Aldrich, Steinheim, Germany) was operated in the splitless mode.
2.4. Methods Validation
The linearity and limits of quantification were validated according to standard AFNOR NF T 90 - 210 (May 2009) [43], under the optimum conditions of both HS-SPME and SPE-GC/FID methods. This validation was obtained by extracting five different concentrations of standards ranging between LOQ and 100 µg·L−1, with fluorobenzene (10 μg·L−1) as internal standard for HS-SPME; whereas standards concentrations were 50, 70, 90, 120 and 250 μg·L−1, with chlorobenzene (90 μg·L−1) as internal standard, for SPE. Calibrations were performed on five consecutive days.
According to the AFNOR document NF T 90 - 210 (May 2009), 10 measurements of independent solutions with a concentration at the estimated limit of quantification LOQ were performed (mean = zLOQ, standard deviation sLOQ). The estimated limit of quantification is acceptable when zLOQ – 2 × sLOQ > LOQ – 60% × LOQ and zLOQ + 2 × sLOQ < LOQ + 60% × LOQ. The 0.6 value has been defined by convention but can be modify in agreement with specific regulations.
To ensure the quality control of the analysis, the samples analysis were performed after verifying the absence of memory effect in the chromatograms. All sample analysis were performed in duplicate, and a blank sample was analyzed every six sequences.
2.5. Experimental Designs
2.5.1. HS-SPME Design
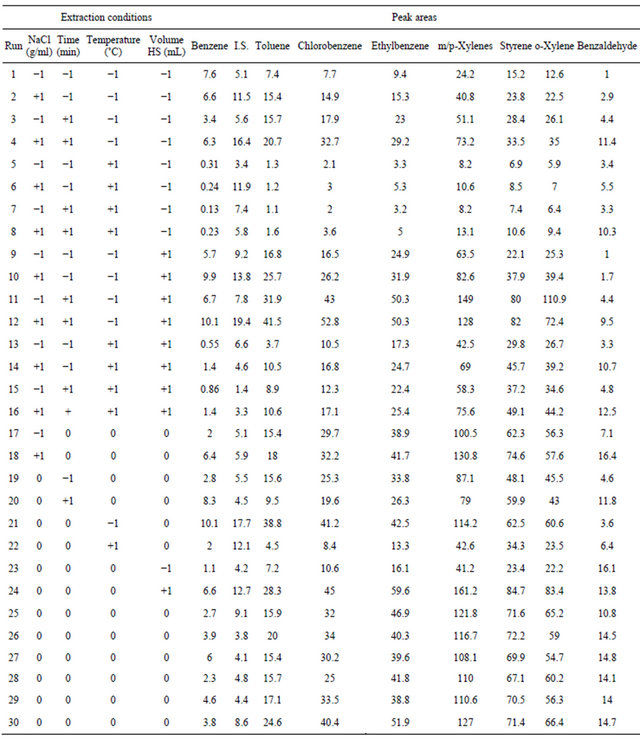
To Central Composite Designs (CCDs) were used to combine the experiments of a factorial design (Nf), the star points (2k + 1) and N0 in the center of the field trials. This is a quadratic model with N = 2 ^ k 2 + k N0, k is the number of factor. The star points are located at ±α, with α = 1 in this case the center of the experimental domain. These tests are on the faces of the cube [44]. The number of experiments was 30 involving 4 factors (Table 1) and 6 replicates of the central point were included to assess the experimental errors.
This design allows assessing isoresponse curves. Once the experiments and the model coefficients are calculated, we obtain the response surfaces shown in Figure 1. To find an acceptable compromise area for the experimental conditions we have defined the individual desirability functions for the studied contaminants. These are left unilateral functions, knowing that in the global desirability, no preponderance was imposed.
All “blank” water samples were spiked with the standards in mixture at 10 µg·L−1 for each compound. CCD was used to optimize the four factors (cited with their low (−1), central (0), and high levels (+1)). The optimized factors were: 1) the ionic strength by means of the NaCl concentration (0 - 0.1 - 0.2 g·mL−1), 2) extraction temperature (25˚C - 50˚C - 75˚C), 3) extraction time (5 - 18 - 31 min), and 4) headspace volume (ratio phase of sample volume in 20 mL vial) (2/20 - 6/20 - 10/20).
Using the CCD, the peak areas of all analytes were extracted from the chromatograms and were considered as the responses. The software used is NemrodW (LPRAI, Marseille-France, 2011), which allows us to draw the appropriate matrices, to calculate the coefficients of the model, to represent the response surface, the desirability surface and to find the optimum.
2.5.2. SPE Design
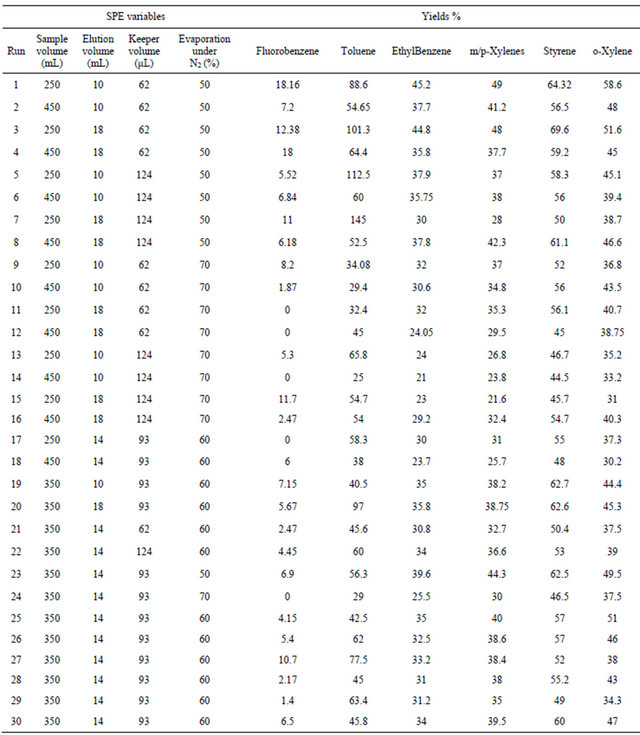
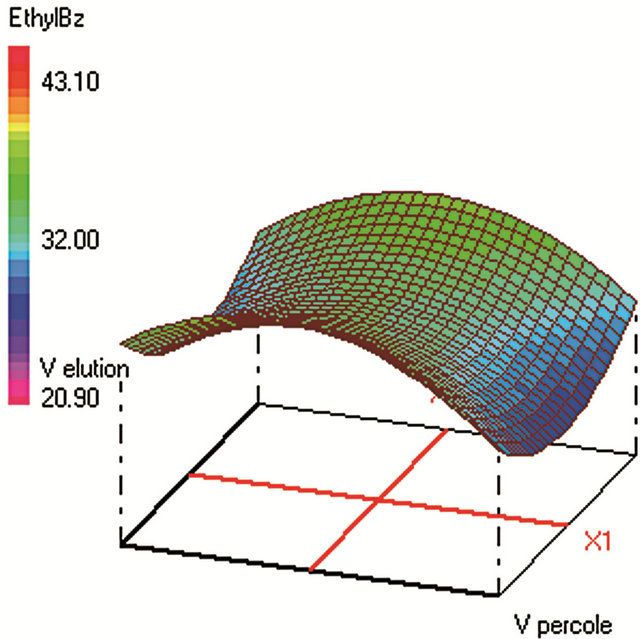
Similar CCD was used for SPE optimization (Table 2) and involved 30 experiments and 4 factors that are: 1) sample volume (250 - 350 - 450 mL), 2) elution volume of acetonitrile (10 - 14 - 18 mL), 3) keeper volume in elution phase (62 - 93 - 124 μL) and 4) percentage of the evaporation of the extract volume under nitrogen stream (50% - 60% - 70%). The water samples were spiked with standards in a mixture at 250 µg·L−1 for each compound. The extraction recoveries (calculated from the peak areas obtained) were considered as the responses to include in the chemometric calculations (Figure 2).
3. Results and Discussion
3.1. Optimization of the HS-SPME
3.1.1. Choice of the Fiber Coating
In order to select the best fiber to extract VOCs, several fiber coatings purchased from Supelco (Sigma-Aldrich, Steinheim, Germany), were tested: 1) a fused silica fiber coated with 100 µm layer of polydimethylsiloxane (PDMS), 2) a fused silica fiber partly coated (composite coatings) with a 65-µm layer of polydimethylsiloxane/divinylbenzene (PDMS/DVB) [36], and 3) a fused silica fiber partly coated with a 75-µm layer of carboxen/polydimethylsiloxane (CAR/PDMS) [45].
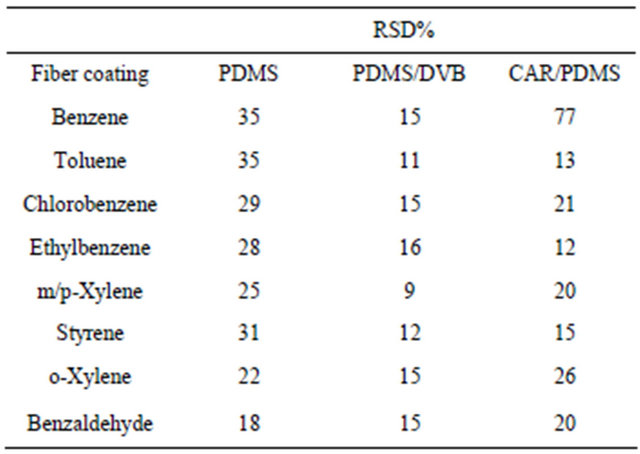
A test of repeatability (n = 3) was realized to choose the most repeatable fiber, using water samples spiked with the mixture of standards at 10 µg·L−1 for each compound. In a vial of 20 mL, 10 mL of spiked water with a NaCl concentration of 0.2 g·mL−1 (HeadSpace HS ratio of 10/20) were extracted under magnetic stirring for 10 min at 25˚C. The fiber was then introduced into the GC injector to desorb at 250˚C during 1.5 min the analytes from the fiber coating. The relative standard deviation (RSD%) of the absolute area of each analyte was determined.
The results obtained (Table 3) showed that the PDMS/ DVB coating allows the best peak area repeatability of analytes with RSD lower than 16%; whereas the RSD values reaches 35% with PDMS for the most volatiles (i.e. benzene and toluene) and 77% with CAR/PDMS for the benzene. The non-polar PDMS coating is recommended by the supplier for non-polar with low molecular weight compounds such as alkanes, etc., via adsorption [45]. However, our results showed poor repeatable extraction with the PDMS when dealing with high volatiles compounds, which could be explained by unreached partition equilibrium of the analytes between the polymeric stationary phase and the sample matrix.
Despite that CAR/PDMS, a bipolar adsorbent, has been previously described for BTEX analysis at trace levels by SPME coupled to cryo-trap GC/MS [45], this fiber coating was poorer repeatable for benzene (the most critical analyte) extraction when HS-SPME-GC/FID is involved. Our analytes were adsorbed more efficiently, and released faster with more repeatable extraction, on the 65- µm (PDMS/DVB)-coated fiber. With the thinner coating and higher specific surface area, the PDMS/DVB extracts more of our analytes through diffusion and better
Table 1. Experimental variables, levels, matrix of CCD and peak areas (a.u.) for the VOCs by HS-SPME-GC/FID using the PDMS/DVB fiber.
release the compounds during thermal desorption.
3.1.2. Optimization Results
The optimization of the HS-SPME was performed on the fiber that allows the best repeatability (65 µm PDMS/ DVB). The desorption temperature and time of the VOCs from the SPME fiber into the GC injector were optimized classically by testing desorption efficiency of the analytes by means of their peak areas in the corresponding chromatograms, with the absence of memory effect in the
Table 2. Experimental variables, levels, matrix of CCD and yields (%) for the VOCs by SPE-GC/FID.
further blank injections.
The studied four HS-SPME factors (salinity, extraction time and temperature, and HS volume) are often described in the literature [36,41,45] as the most relevant. Before optimization, a screening design similar to this described in the literature [36] was applied to assess the pertinence of the aforementioned factors, involving additional factors such as the SPME mode (HS vs direct immersion), the sample pH, and the sample stirring during extraction. From results obtained (data not shown), the HS mode, magnetic stirring with no pH-adjustment of the sample were fixed throughout the experiments.
 (a)
(a)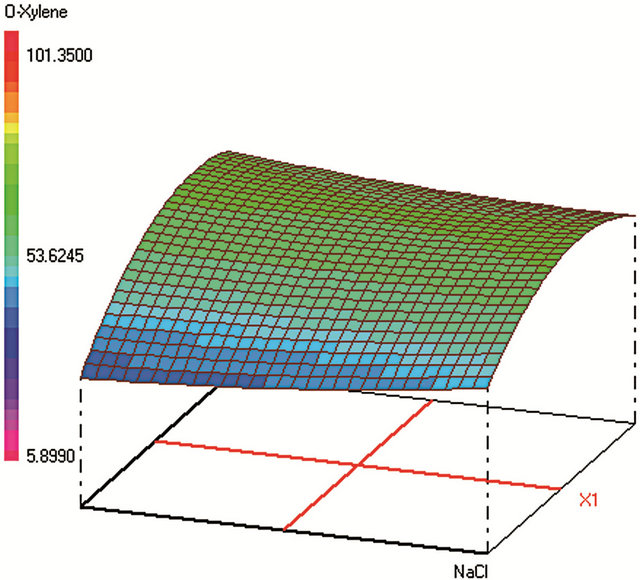 (b)
(b)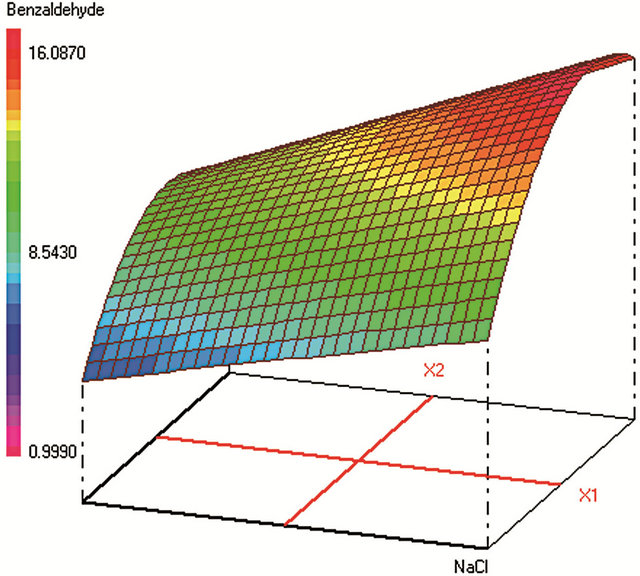 (c)
(c)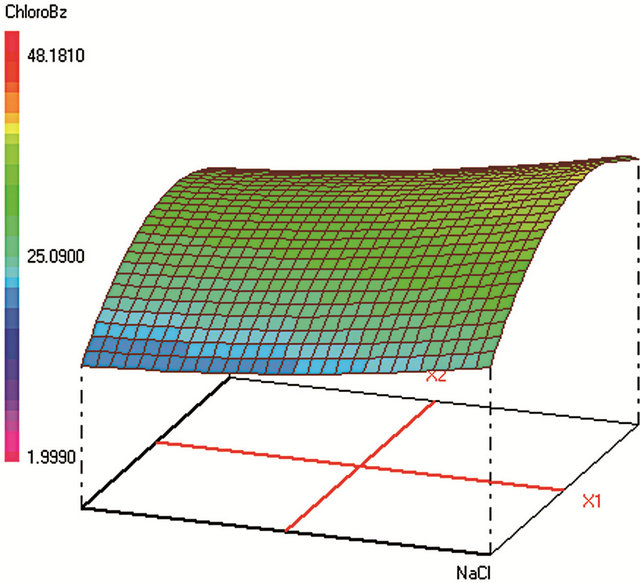 (d)
(d)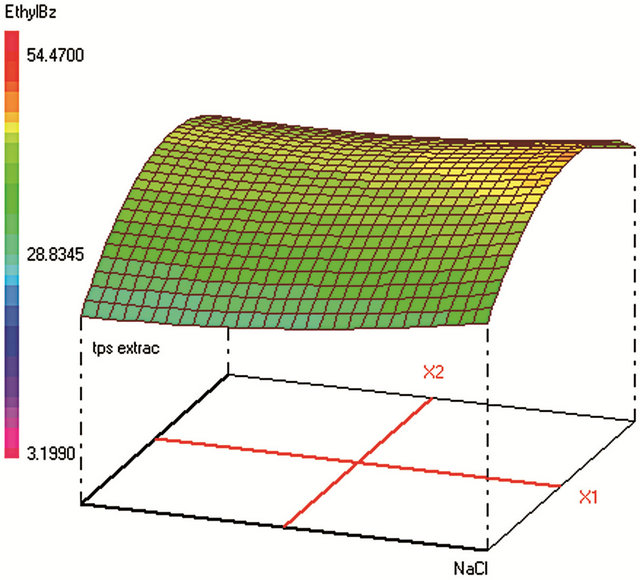 (e)
(e)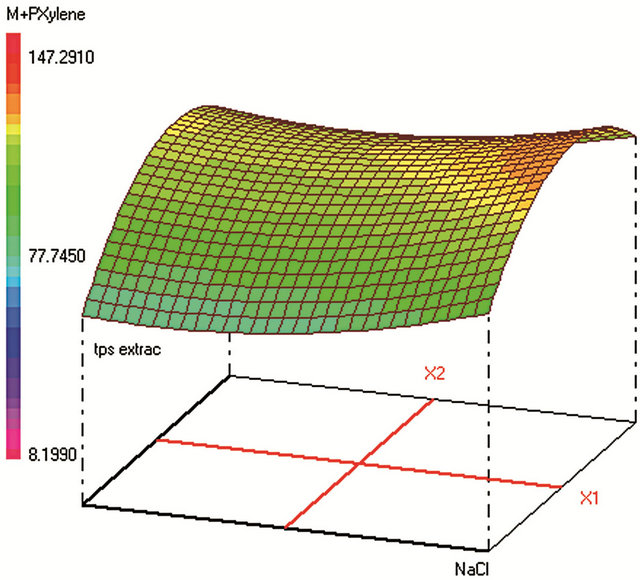 (f)
(f)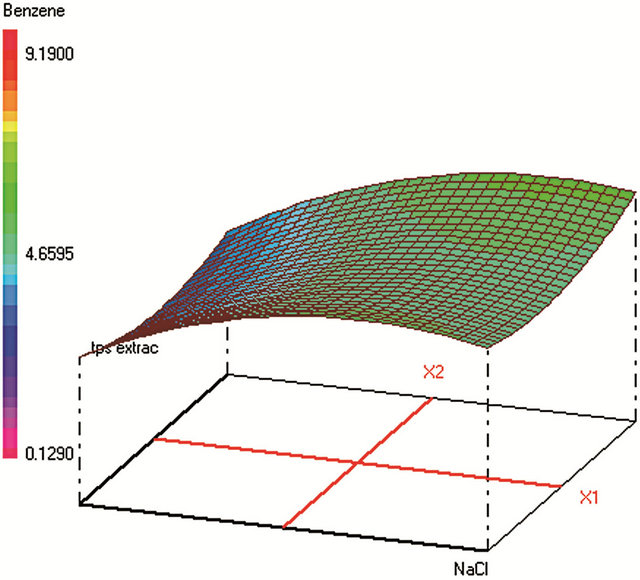 (g)
(g)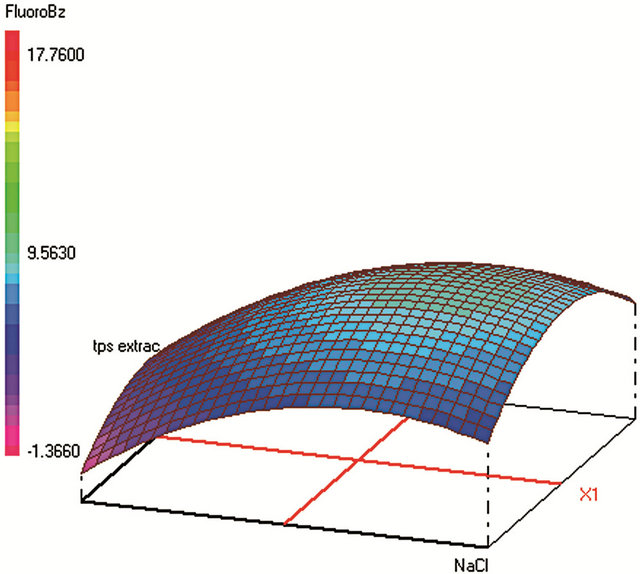 (h)
(h)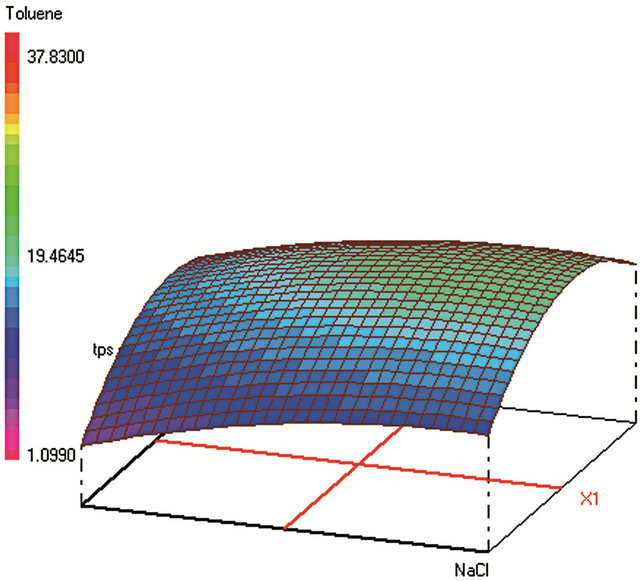 (i)
(i)
Figure 1. Response surfaces obtained by HS-SPME-GC/FID of (a) benzaldehyde; (b) o-xylene; (c) styrene; (d) m, p-xylene; (e) ethylbenzene; (f) chlorobenzene; (g) toluene; (h) fluorobenzene; (i) benzene.
Optimum HS-SPME conditions were found to be: 0.2 g·mL−1 of NaCl; extraction during 31 min at 25˚C; Headspace volume of 10 mL in a 20 mL vial. The salting-out effect was obvious in increasing the analytes extraction during an acceptable time. Heating the sample was supposed to increase the VOCs volatility and therefore their transfer to the fiber from the vapor phase. However, the results show that high temperature provokes early desorption of the analytes from the fiber coating during HSSPME extraction, mainly for the most volatile compound (such as benzene). A temperature of 25˚C was found to be optimum to extract the analytes with higher efficiency when sample volume is 10 mL in a 20 mL-vial. When the sample volume increases, the mass of analytes transferred to the vapor phase increases leading to higher adsorbed amounts on the fiber coating and therefore to a better extraction.
Global desirability of SPME (DSPME = 0.8004) value was satisfactory [42,46,47]. This function takes into consideration all of the individual desirabilities of all studied contaminants. It is a multiplication of these late functions, if any of these is none satisfactory (= 0), the
 (a)
(a)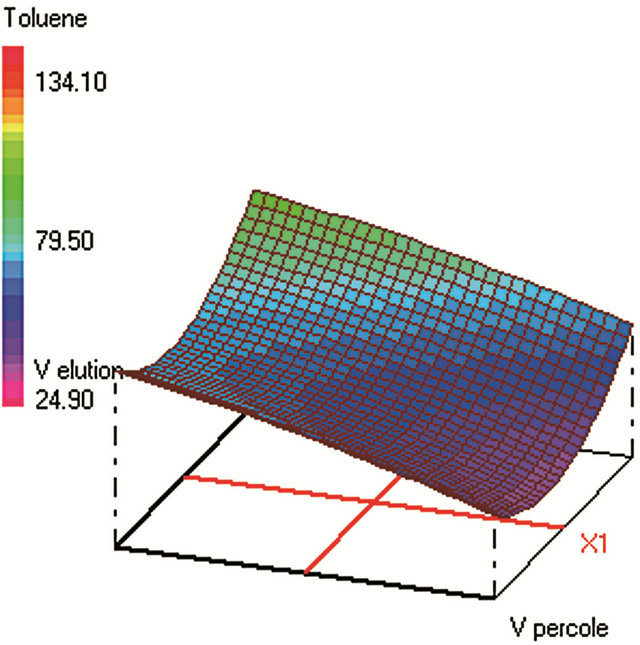 (b)
(b)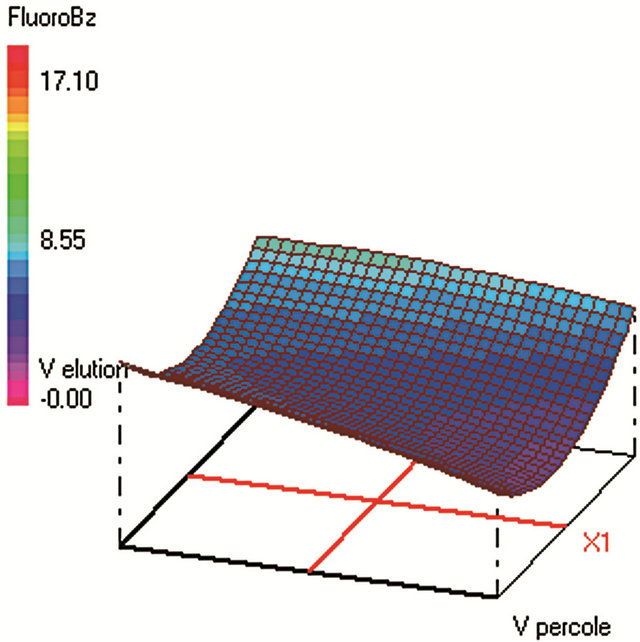 (c)
(c)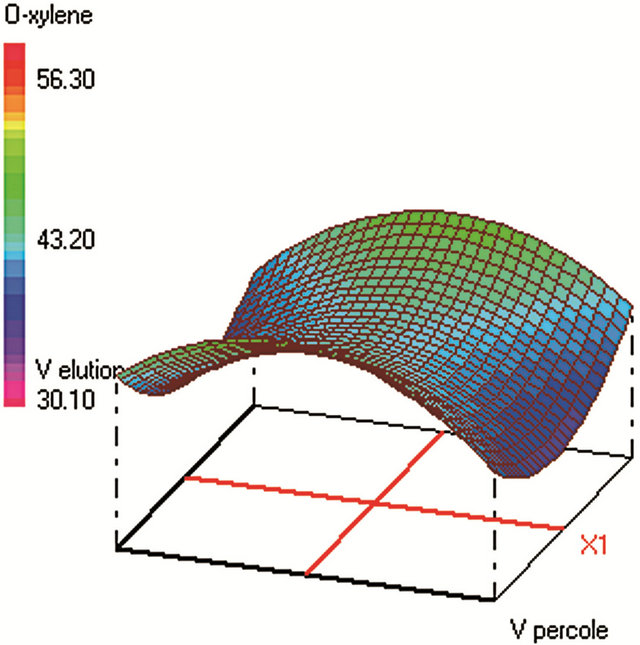 (d)
(d)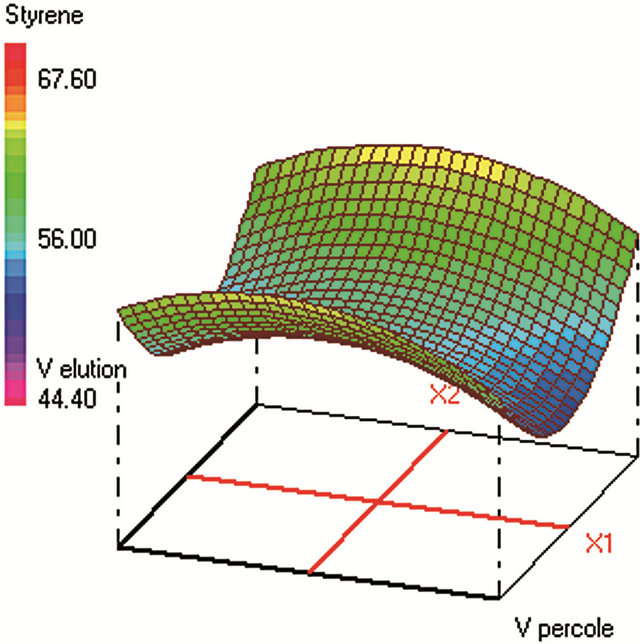 (e)
(e)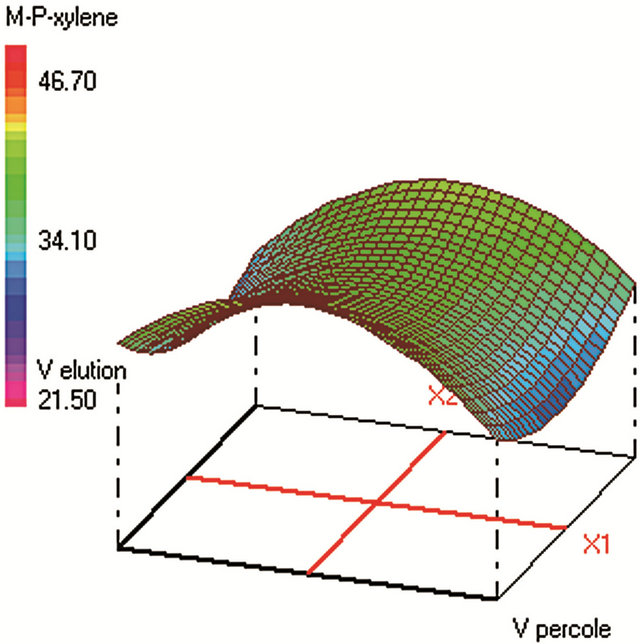 (f)
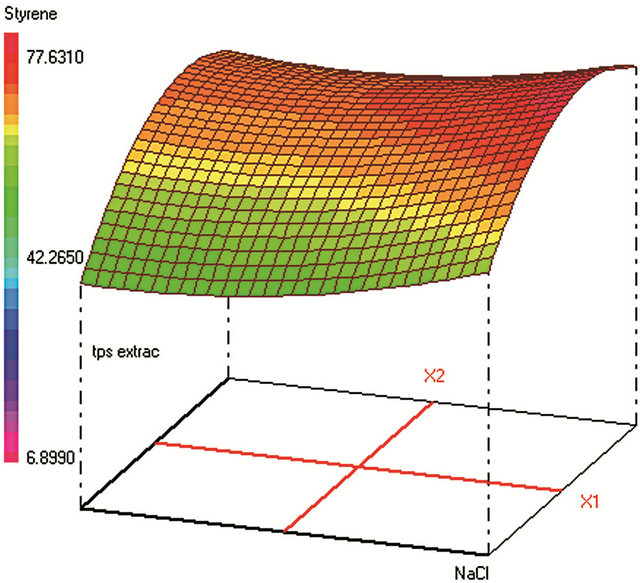
(f)
Figure 2. Response surfaces obtained by SPE-GC/FID of (a) fluorobenzene; (b) toluene; (c) ethylbenezene; (d) m/p-xylene; (e) styrene; (f) o-xylene.
Table 3. Effect of the type of coating on the repeatability of the HS-SPME-GC/FID (n = 3): mixture of VOCs standards at 10 µg·L−1 for each compound, extraction (10 min at 25˚C), salinity of 0.2 g·mL−1, headspace volume (10/20 mL).
overall desirability will be equal to zero.
3.2. Optimization of the SPE
Global desirability of SPE (DSPE = 0.9563) value was satisfactory [42,46,47]. SPE extraction efficiency was very poor for benzene, fluorobenzene and benzaldehyde which makes difficult to reach acceptable sensitivity and repeatability of the analytical method. These analytes were thus not included in the SPE optimization. The four SPE studied factors were: the sample volume, the elution volume of acetonitrile, the keeper volume in elution phase, and the percentage of the evaporation of the extract volume under nitrogen stream. The minimum and maximum values of each factor were set after preliminary experiments. The studied range of the sample volume was set between 250 and 450 mL to ensure high load of analytes within a reasonable time. The optimum sample volume was 330 mL, since higher volumes require not only more loading time, but lead also to lower yields due to: 1) an increase of the VOCs loss by evaporation during this step and 2) a higher breakthrough of the analytes from the cartridges [48].
The trapped analytes were eluted under optimum conditions: with 10 mL of acetonitrile containing 108 µL of dodecane. Sample concentration was then carried out under a stream of nitrogen until 50% of evaporation of the extract volume. The efficiency of the acetonitrile volume on the SPE yields was tested ranging from 10 to 18 mL of the eluent. Despite that high acetonitrile volume can elute any residual trapped analytes from the cartridge; the optimum volume was 10 mL (minimum volume) since highest volumes require additional time of evaporation under nitrogen stream in the subsequent step. The volatiles analytes are thus lost by evaporation at this final step, which should be kept at its minimum (50% of sample volume evaporation found as optimum). The optimum volume of the keeper in the eluent composition was 108 µL, since enough dodecane should be added to reduce the evaporation of the analytes during and after elution. However, higher keeper volume decreases the analytes solubility in the acetonitrile phase and consequently decreases the elution efficiency.
3.3. Methods Validation
3.3.1. HS-SPME-GC/FID Validation
The HS-SPME-GC/FID was valid for all the studied analytes, with good linearity expressed as r2 (>0.988), in the range between LOQ and 100 µg·L−1, fulfilling the requirements of the AFNOR NF T 90 - 210 (May 2009). The precision of the experimental procedures was assessed at five concentration levels of analytes within the linearity range (5 replicates). The results of the HS-SPME showed good intermediate repeatability with relative standard deviations (RSDr) less than 15% for all the analytes, within the acceptance criteria (Table 4) [49].
Method accuracy was determined by considering both systematic and random errors. Accuracy was thus estimated from the uncertainty measurement of the analytical assay determined from the validation data according the LGC/VAM protocol and the ISO/DTS 21748 guide [49]. The uncertainty measurement of the HS-SPME was ranging from 0.02 to 15.83.
The limits of quantification are the lowest concentration of analytes that can be determined These quantitatively with an acceptable level of precision. limits were validated following the ANOR XP T 90-210 recommendations and their values were with HS-SPME far lower than MCLs, allowing the determination of these contaminants in bottled drinking water, with respect to the US EPA and WHO regulations (Table 4).
The method recoveries were determined using spiked water samples that were extracted and analyzed by GC/ FID under the optimized conditions. The recovery values obtained ranging from 90% - 117% for all the analytes by HS-SPME in the concentration range between LOQ and 100 µg·L−1 are very satisfactory.
3.3.2. SPE-GC/FID Validation
SPE-GC/FID validation results are summarized in Table 4. This method was valid following AFNOR NF T 90- 210 (May 2009) criteria for only four analytes (ethylbenzene, m/p-xylenes, styrene, and o-xylene) with r2 > 0.998 in the range between LOQ and 250 µg·L−1. The intermediate repeatability of the SPE was also acceptable for the four valid analytes with RSDr less than 16%. The lowest uncertainty measurement of the SPE was 3.60 for styrene (Table 4).
SPE does not provide enough sensitivity for most of
Table 4. Validation of the analytical methods (AFNOR NF T 90 - 210) for the VOCs in water and their MCLs.
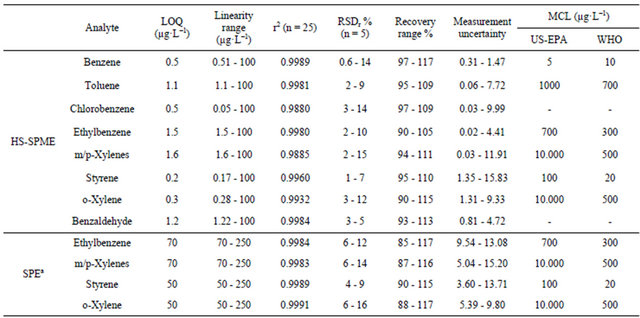
aThe SPE-GC/FID was not valid for benzene, toluene, chlorobenzene, and benzaldehyde.
the analytes. LOQ was higher than MCL for styrene among the four valid analytes, following only USEPA standards (not WHO). SPE provides wider range of recoveries than HS-SPME ranging from 85% to 117% for the valid four analytes and for higher concentration levels (≤50/70 - 250 µg·L−1≥) (Table 4).
When comparing the validation criteria of both methods and in the response to the essential need of high sensitivity to monitor traces of VOCs in bottled water, it is obvious that the SPE is less preferment than HS-SPME to be applied for VOCs screening in different bottled waters and to assess the migration of these molecules from packaging to the bottled water under several conditions of storage.
3.3.3. VOCs Background in the Blanks
Blank samples were analyzed to determine the VOCs concentrations as background levels that should be taken into account for LOQs determination as well for recoveries calculation. The main problem was that VOCs are found in blanks of ultra-pure water under our laboratory conditions. Blank chromatographic injections were made to ensure the absence of VOCs in the apparatus. Their detection in the blank chromatograms may be attributed to their presence at low levels in the ultra-pure water or due to contamination during the analytical procedural stages.
With SPE, traces of ethylbenzene, xylenes, and styrene were found in the blanks with the styrene found at the highest peak areas. With SPME, traces of almost all of the VOCs were found in the blanks with highest peak areas for toluene and m/p-xylenes. However, all compounds are, when found in the blanks, at very low amounts and not quantified. Their peak areas were subtracted from the corresponding ones in real samples.
3.4. VOCs Screening
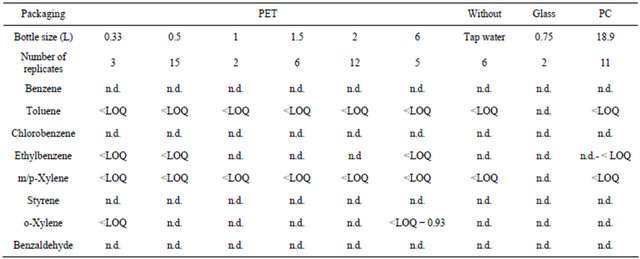
A total of 43 different PET-bottled water samples were analyzed along with 11 PC-bottled water samples to assess the contamination of waters with VOCs. Glassbottled water (n = 2) was taken as reference, and comparison was carried out with tap waters (n = 6) to assess the global environmental contamination of drinking waters with the target analytes. The results of the HS-SPME analysis (Table 5) showed no contamination with all the analytes using the glass as packaging material. Analyzed tap water samples were contaminated only by toluene and m/p-xylenes below the LOQ and therefore far below their MCL, showing the safety of the Lebanese tap waters for human health with regards to VOCs. In plastic-bottled waters, benzene, chlorobenzene, styrene and benzaldehyde were not detected in all the samples whatever the plastic packaging is (PET or PC). Toluene was detected in all the samples but all concentrations were below the LOQ, similar to tap waters; thus the HS-SPME results confirm the presence of toluene in bottled waters in the same manner as obtained previously [25,50]. The source of contamination with toluene cannot be well established, since this pollutant is widely detected in the environmental waters, and all the concentrations in bottled waters are below the LOQ making difficult the study of migration under realistic conditions.
Ethylbenzene was detected in 13 over 43 PET-bottled waters and in 10 over 11 PC-bottled ones; whereas oxylene was detected in 4 of the PET-, and in 9 of the PCbottled waters. Ethylbenzene as well as toluene, benzene, and styrene are aromatic hydrocarbons that are commonly identified in PET samples subjected to temperatures between 200˚C and 300˚C due to thermal degradation [3,51]. However, in our study, no correlation was found between the detection of the aforementioned four VOCs, since when ethylbenzene and toluene are detected in PET-bottled waters, no traces of either benzene, or styrene are detected. The high volatility of benzene might be one of the reasons that cause its loss from bottled waters, either by diffusion through the plastic pores, or by volatilization at the direct opening of the bottle. m/pxylenes are detected at concentrations below their LOQ in all PETand PC-bottled waters. P-xylene is considered as residue from the production of tetrephtalique acid or its ester, the dimethylterephtalate (raw materials required to synthesis PET). Similarly, this VOC is part of not intentionally added substances (NIAS) that result often from PET degradation during its manufacturing process [52].
Even if some bottled waters were contaminated by the studied molecules, all the concentrations were far below their MCLs, showing that the Lebanese bottled waters are safe for human consumption close to tap waters, in respect to the VOCs contamination. However, the occurrence of the aforementioned contaminants in tap waters deserves future and continuous monitoring of the unpacked waters to assess any increase in their concentrations that could be harmful for public health.
3.5. VOCs Migration Study
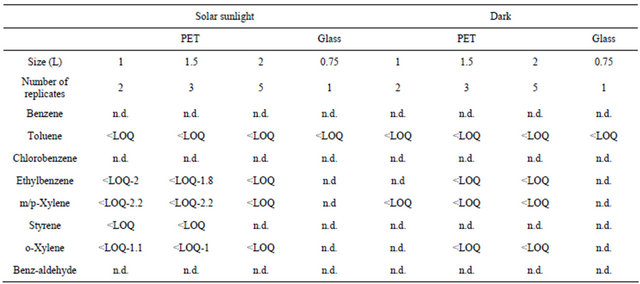
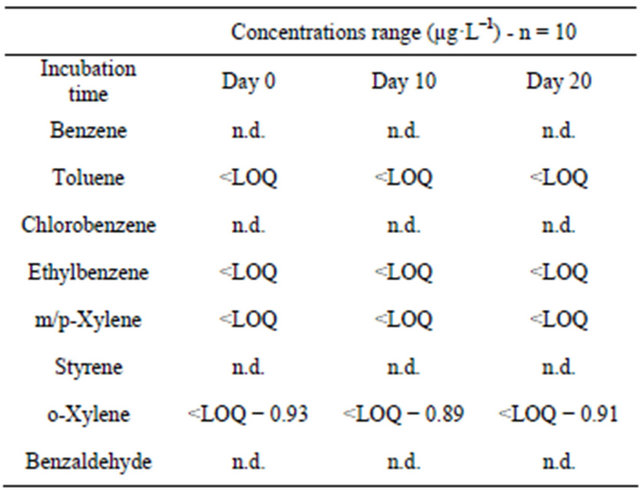
In order to assess the influence of storage conditions of bottled waters on the VOCs migration from the PET material to the mineral water, the total of 20 PET-bottled waters were analyzed after their storage during 5 months, either at room temperature in dark, or under daily sunlight. Glass bottled waters were taken as reference and were stored with the aforementioned samples, under same conditions. Benzene, cholorobenzene, and benzaldehyde were not detected in all the analyzed samples (Table 6). Toluene was found in all the samples ( Table 5. Concentrations range of VOCs (µg·L−1) in the water samples by HS-SPME-GC/FID. Table 6. VOCs concentrations (µg·L−1) in bottled waters depending on the storage conditions. Styrene detection in samples after solar exposure cannot be attributed to migration since this compound remains below LOQ. Sunlight seems to promote only ethylbenzene and xylenes migration from PET bottles, since quantifiable concentrations were determined after 5-months of samples exposure to sunlight. However, the concentrations remain far lower than the MCLs, with no considerable risks on human health. These contaminants have been previously quantified in other bottled waters at higher concentrations [25]. According to the Commission Directive 2002/72/EC, the safety of plastic materials such as PET intended to come into contact with foodstuffs (i.e. mineral water) should be assessed by means of specific migration tests. For this purpose, a total of 10 samples were analyzed freshly after collection and 10 similar samples were incubated at 40˚C during 10 days then analyzed and the results were compared. Extended period of exposure until 20 days was also studied. The results in Table 7 showed no significant and quantifiable increase in the migration of the VOCs after 10 and 20 days of storage at 40˚C. The o-xylene quantified at an average of 0.9 µg·L−1 at day 10, is expected to reach 5.4 µg·L−1 (when multiplied by a factor of six following Crank equation), after 1 year of usual storage (2002/72/EC), but still below its MCL. Similar safety of the Lebanese PET used to bottle waters in respect to VOCs migration was demonstrated in a previous article with Head space trap GC/FID [50]. 4. Conclusion The HS-SPME-GC/FID was valid (Afnor NFT 90-210 Table 7. Assessment of the migration of VOCs from PET to bottled waters when stored in the oven at 40˚C. (May 2009)) under optimized conditions: 0.2 g·mL−1 of NaCl; extraction during 31 min at 25˚C; Headspace vol ume of 10 mL in a 20 mL vial, to analyze the studied VOCs with LOQs ranging from 0.2 (styrene) to 1.6 µg·L−1 (m/p-xylenes), which are far lower than their MCLs. SPE-GC/FID showed poorer performances, even after optimization using CCD, with LOQ above 50 µg·L−1 for the validated molecules (4/8 VOCs). All analyzed samples were not contaminated with benzene, chlorobenzene, styrene and benzaldehyde, similarly to tap waters. The contamination with the other VOCs when occurs was at very low concentration levels, below the LOQ. The safety of the Lebanese drinking waters is thus proved in respect to VOCs analysis. Analysis performed on PETbottled waters stored at 40˚C for 10 and 20 consecutive days did not show any significant VOCs migration and the packaging can be considered safe at its expiry date (Directive 2002/72/EC). The exposure to sunlight during 5 months seems to promote the migration of ethylbenzene and xylenes, but their concentrations in bottled waters remain below the MCLs. 5. Acknowledgements The authors are grateful to the EDST of the Lebanese University and to the Lebanese National Council for Scientific Research (CNRS) for the financial support of this project. REFERENCES NOTES *Corresponding author.