American Journal of Analytical Chemistry
Vol. 3 No. 6 (2012) , Article ID: 20037 , 9 pages DOI:10.4236/ajac.2012.36055
Development and Validation of HPLC Method for Simultaneous Determination of Amlodipine, Valsartan, Hydrochlorothiazide in Dosage Form and Spiked Human Plasma
1Analytical Chemistry Department, Faculty of Pharmacy, Assuit University, Assuit , Egypt.
2Pharmaceutical Chemistry Department, Faculty of Pharmacy, King Abdulaziz University, Jeddah, Kingdom of Saudi Arabia
3Analytical Chemistry Department, Faculty of Pharmacy, Minia University, Minia, Egypt
4Analytical Chemistry Department, Faculty of Pharmacy, October University for Modern Sciences and Arts (MSA), 6th October City, Egypt
Email: dr_ahmed80@hotmail.com
Received March 13, 2012; revised April 17, 2012; accepted April 21, 2012
Keywords: Amlodipine Besylate; Valsartan; Hydrochlorothiazide; Reverse Phase High Performance Liquid Chromatography (HPLC)
ABSTRACT
A simple, sensitive, and specific method was developed for simultaneous determination of Amlodipine besylate (AML), Valsartan (Vals) and Hydrochlorothiazide (HCT) by high performance liquid chromatography without previous separation. Satisfactory resolution was achieved using a RP-C18 chromatographic column, Phenomenex Kinetex (150 mm × 4.6 mm i.d) and a mobile phase consisting of acetonitrile-phosphate buffer (0.05 M) with pH 2.8 in the proportion of (40/60, v/v) at a flow rate 0.8 mL/min and the wavelength detection was 227 nm. The retention time for HCT, AML and VAls was 2.26, 3.16 and 11.19 min; respectively. The described method was linear over a range of 4-28 µg /ml, 5-40 µg /ml and 1-12 µg /ml for AML, Vals and HCT; respectively. The mean percent recoveries were 99.94%, 99.96% and 99.78% for AML, Vals and HCT; respectively. F-test and t-test at 95%confidence level were used to check the intermediate precision data obtained under different experimental setups. The method could be used for analysis of combined dose tablet formulation containing AML, Vals, HCT as well as spiked human plasma.
1. Introduction
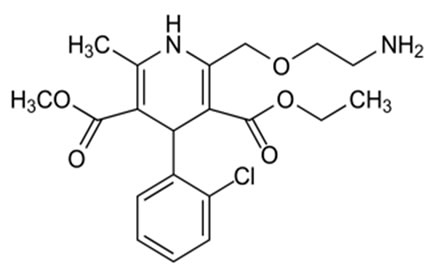
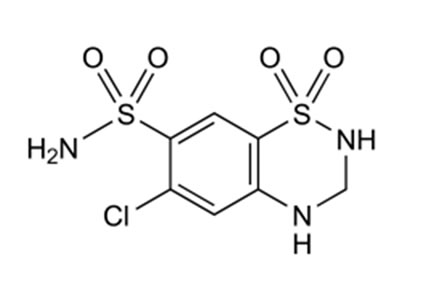
Amlodipine besylate (AML), 2-[(2-amino ethoxy)-methyl]-4-(2-cholophenyl)-1,4-dihydro-6-methyl-3,5-pyridine dicarboxylic acid 3-ethyl-5-methyl ester, benzosulfonate, is a potent dihydropyridine calcium channel blocker as an antihypertensive agent. Valsartan (Vals)N- [p-(O-1H-Tetrazol-5-ylphenyl)benzyl]-N-valeryl-L-valine, It is an angiotensin II receptor blocker and clinically is used as an antihypertensive agent. Hydrochlorothiazide (HCT),6-chloro-3,4-dihydro-2H-1,2,4-benzothiadia-zine7-sulfonamide is used as a diuretic [1,2]. AML is official in BP, Vals is official in EP and USP, whereas HCT is official in BP and EP. These three drugs are marketed as combined dose tablet formulation in the ratio of 10:160:12.5 mg (AML:Vals:HCT). Literature survey revealed that a number of methods have been reported for estimation of AML, Vals and HCT individually or in combination with other drugs. However, there is very few analytical methods reported for the simultaneous analysis of these drugs in a combined dosage formulation [3,4]. The reported methods are UV spectrophotometric [5-9], Spectrofluorimetric [10] HPLC [11-24], HPTLC [25,26], capillary electrophoresis [27-30] and electrochemical [31-34] methods.
The aim of this work was the development of simple, sensitive and accurate analytical methods for the simultaneous determination of amlodipine besylate, valsartan and hydrochlorothiazide in mixtures without the need of prior separation step. The developed method was able to determine the content of the cited drugs in commercial tablets and spiked human plasma.
2. Experimental
2.1. Materials and Reagents
• AML was kindly obtained as gift samples by Pfizer Egypt S.A.E. (Cairo, Egypt), Vals was kindly provided by Novartis Pharma S.A.E. (Cairo, Egypt) and HCT was kindly provided by Medical Union Pharmaceuticals, (Abu-sultan, Ismailia, Egypt). Exforge HCT (B.No. B8022) containing 10 mg AMLO, 160 mg Vals and 12.5 mg HCT per tablet were obtained from Swaziland manufactured by Novartis Farmaceutica, Barbera, Spain for Novartis pharma AG, Basle Switzerland.
• Acetonitril, HPLC grade (Fisher Scientific, UK).
• Potassium dihydrogen phosphate and orthophosphoric acid were of HPLC grade (Merck, Darmstadt, Germany).
• Double distilled water was used in preparation of mobile phase.
2.2. Apparatus
Agilent 1200 series HPLC, comprised of vacuum degasser, auto injector, thermostatted column compartment G1316A/G1316B, multiple wavelength detector SL, quatenary pump (Germany). Chromatographic column; Phenomenex Kinetex (150 × 4.6 mm i.d) P.N. 00F- 4462-E0 Chromatographic peaks were electronically integrated and recorded using chemstation software (Agilent Chemstation V. B.03.01, Germany).
2.3. Chromatographic Conditions
Chromatographic analysis was carried out at ambient temperature (22˚C - 25˚C).The compounds were separated isocratically with a mobile phase consisting of acetonetrile-phosphate buffer (0.05 M) with pH 2.8 ± 0.2 in the proportion of (40/60, v/v) at a flow rate 0.8 mL/min with injection volume 20 µL. The effluent was monitored spectrophotometrically at wavelength 227 nm. The mobile phase was filtered by passing through a 0.45 µm membrane filter (Millipore, Bradford, MA), and then ultrasonicated for 15 min.
2.4. Preparation of Stock Solutions
Primary stock solutions of AML, Vals and HCT were prepared daily separately by dissolving 25 mg of each in 25 mL volumetric flasks (1.0 mg/mL) in mobile. Series of working solutions of AML, Vals and HCT were prepared by the appropriate dilution of the stock solutions with same solvent to reach the concentration ranges of 4 - 28 µg /ml for AML, 5 - 40 µg /ml for Vals and 1 - 12 µg /ml for HCT.
2.5. Procedures
The standard solutions were prepared by dilution of the stock standard solution with mobile phase to reach a concentration range 4 - 28 µg/mL for AML, 5 - 40 µg /ml for Vals and 1 - 12 µg/ml for HCT. Triplicate 20 μL injections were made for each concentration and chromatographed under the condition described above. The peak area of each concentration was plotted against the corresponding concentration to obtain the calibration graph and regression equation was computed.
2.6. Preparation of Pharmaceutical Dosage Sample
The contents of twenty tablets labeled to contain 10 mg of AML, 160 mg of Vals and 12.5 mg of HCT were individually weighed, mixed and finely powdered in a mortar. Amount of the powder equivalent to one tablet content was accurately weighed, transferred into 100 ml volumetric flask and diluted with mobile phase. The sample solution was then filtered using 0.45 μm filters (Millipore, Milford, MA). The procedures were completed as mentioned above and the concentration of AML and PER was obtained from corresponding regression equations.
2.7. Preparation of Spiked Serum Sample
To 1.0 ml plasma 100 µL of each standard solution was pipetted into 5 mL tapered bottom centrifuge tube, and the volume was made up by acetonitrile. The mixture was mixed briefly, standing for 5 min at room temperature, then vortex for 3 min, finally the mixture was centrifuged at 4000 r/min for 10 min. One ml of the clear supernatant was transferred to series of 10 ml volumetric flasks, completed to volume with the mobile phase, the final concentration of the spiked serum sample containing 4 µg/mL of AML, 5 µg/mL of vals and 1 µg/mL of HCT was obtained by further dilution with mobile phase. Finally, 20 µL of the clear supernatant was injected into the liquid chromatograph.
2.8. Calibration and Linearity
Calibration curves were constructed in the ranges of 4 - 28, 5 - 40 and 1 - 12 µg/mL for AML, Vals and HCT, respectively, to encompass the expected concentrations in the measured samples. Triplicate 20 µL injections were made for each working standard solution. The peak area for each concentration was recorded and then plotted against the corresponding concentration to obtain the calibration graph.
3. Results and Discussion
In order to affect the simultaneous elution of more than one component under isocratic conditions, different chromatographic conditions (organic modifier, flow rate, and pH) have been investigated. Various stationary phases were used like C8 and C18 and phenyl column, poor and distorted peaks were observed with phenyl column while C8 and C18 gave satisfactory resolution and free from tailing. Mobile phases containing methanol alone or acetonetrile alone were found to elute the compounds unresolved. Increasing the acetonitrile concentration to more than 65% of buffer led to inadequate separation. At a lower acetonitrile concentration (<40%), separation occurred, but with excessive tailing and increased retention time. To avoid multiple peaks of reversed phase columns, the pH must be controlled with buffers, for example potassium dihydrogen phosphate.
Our objective of the chromatographic method development was to achieve a peak tailing factor <2, retention time in between 2 and 12 min, along with good resolution. This objective was obtained using mobile phase consisting of acetonitrile-phosphate buffer (0.05 M) in the proportion of (40/60, v/v) with the pH adjusted to of 2.8 ± 0.2 with orthophosphoric acid. The mobile phase composition was optimized under the described conditions, the analyte peaks were well defined, resolved and free from tailing, the tailing factors were <2 for all peaks. The elution orders were HCT (tR 2.26 min), AML (tR 3.16 min) and Vals (tR 11.19) at a flow rate of 0.8 ml/min. The optimum wavelength for detection was 227 nm at which much better detector responses for the three drugs were obtained (Figure 1). According to U.S. Pharmacopeia (USP) [1], system suitability tests are an integral part of an LC method. System suitability tests are used to verify that the column efficiency (N), selectivity factor (resolution) and reproducibility of the chromatographic system are adequate for the analysis. System suitability tests were carried out on freshly prepared standard stock solutions of AML, Vals and HCT. The system was found to be suitable as shown in Table 1.
3.1. Method Validation
3.1.1. Linearity, Detection and Quantitation Limits
Calibration curve representing the relation between the concentrations of drugs versus the peak area were constructed. Results show linear relationship in the range of 4 - 28, 5 - 40 and 1 - 12 µg /ml for AML, Vals and HCTrespectively. In triplicate run from which the linear regression equation was calculated. Correlation coefficientslope and intercept were listed in Table 2. Results indicate high sensitivity of the proposed procedures. According to ICH recommendation [35,36], the approach based on the S.D. of the response and the slope was used for determining the detection and quantitation limits.
3.1.2. Accuracy
Accuracy of the measurements was determined using the calibration standards of the three drugs, where mean percentage of 99.94, 99.96 and 99.78 for AML, Vals and HCT, respectively were obtained Table 3. Accuracy was also assessed by the recovery of added standard, five concentrations each in duplicate to know concentration of commercial tablets using the proposed HPLC procedures.
3.1.3. Precision
Injection repeatability: The RSD of drugs peak area in five triplicate injections of standard drug solution determined each day of 3 consecutive days. Intraday and Interday precision were assessed using three concentration and three replicates of each concentration. The calculated relative standard deviation values were found to be small

Figure 1. Representative chromatogram of amlodipine, valsartan and hydrochlorothiazide in pure form.
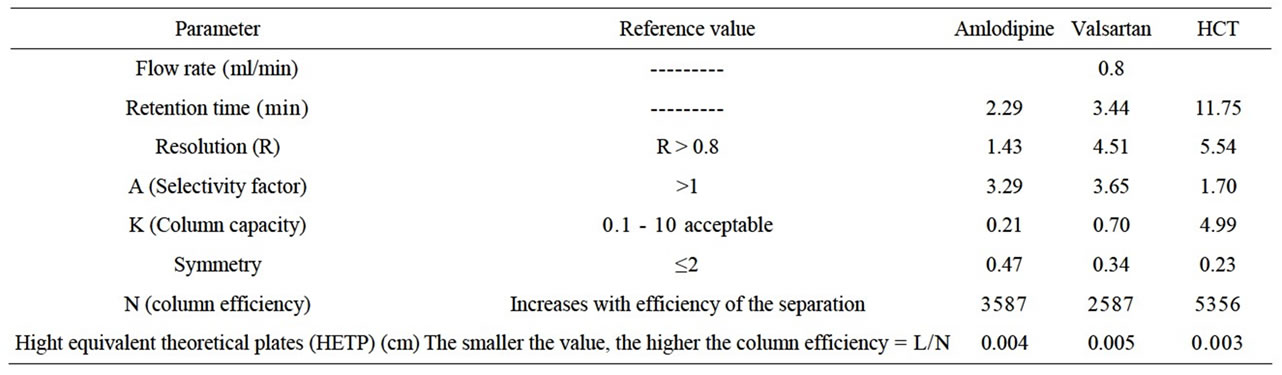
Table 1. Analytical parameters for system suitability test of HPLC method.
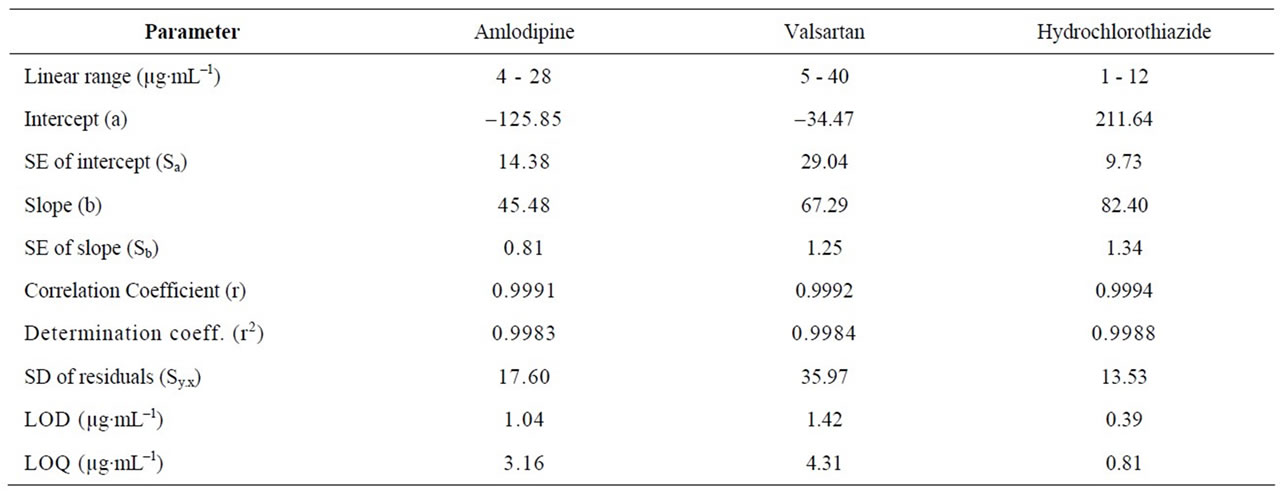
Table 2. Selected spectral data for the determination of cited drugs by the proposed HPLC method.
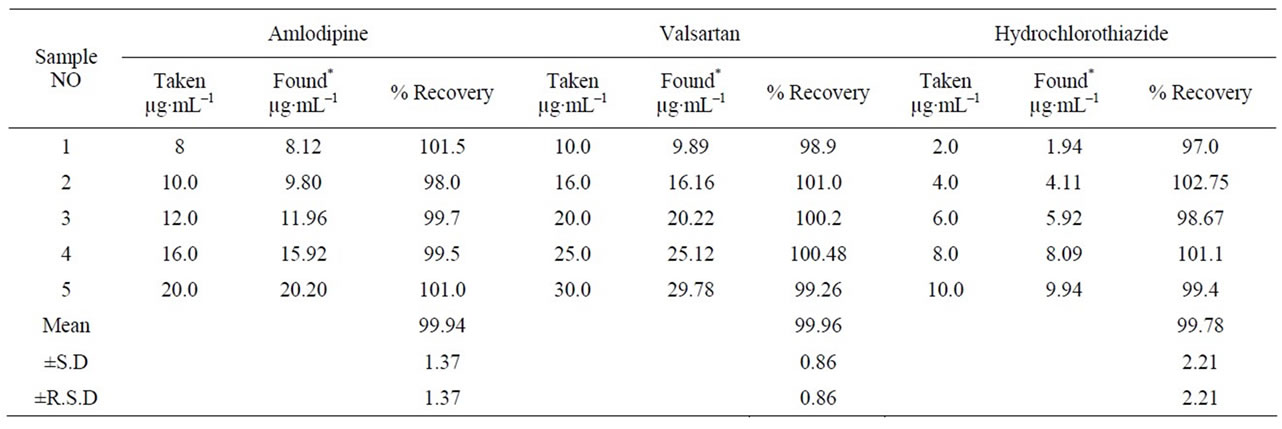
Table 3. Evaluation of the accuracy of the proposed HPLC method.

Table 4. Evaluation of the precision of the proposed HPLC method.
below 2% indicating good repeatability and reliability of the proposed method. The results and their statistical analysis were summarized in Table 4.
3.1.4. Specificity
Retention time of the peak in the chromatogram of tablets and spiked human plasma was the same as that of standard drugs without Interference from excipients, additives or biological fluid components. Accordingly, specificity of the HPLC method was evaluated by its successful application to determine drugs in their tablets with mean recovery of 99.25 ± 0.73% for Exforge HCT® tab. The results were summarized in Table 4.
3.1.5. Robustness and Ruggedness
For the evaluation of the method robustness, some parameters were interchanged such as pH, organic phase ratio of mobile phase and column oven temperature. The capacity remains unaffected by small deliberate variations. Method ruggedness was expressed as R.S.D. % of the same procedure applied by using two different instruments on different days. The results showed no statistical differences between different instruments suggesting that the developed methods were robust and HPLC method was rugged.
4. Application to Dosage
The proposed method was successfully applied for the simultaneous determination of three drugs in Exgorge HCT® tablet without interference of the excipients present and without prior separation.
The utility of the proposed method was verified by replicate estimations of the pharmaceutical preparation and results obtained are evaluated statistically Table 5.
A statistical comparison of the results obtained by the proposed method and the reported HPLC methods [37-39] is shown in Table 6. The values of the calculated t and F are less than the tabulated ones, which reveals that there is no significant difference with respect to accuracy and precision between the proposed and reported methods. Moreover, the proposed method was extended to analyze drugs in spiked human plasma (Figures 2 and 3) by simple extraction and de-proteination with acetonitrile, followed by centrifugation and the clear supernatant containing the drug was adjusted to volume by the mobile phase and analyzed directly by HPLC. Nearly non-destructive extraction was obtained as obvious from a mean % recovery of 98.19 - 98.87 from plasma, Table 7.
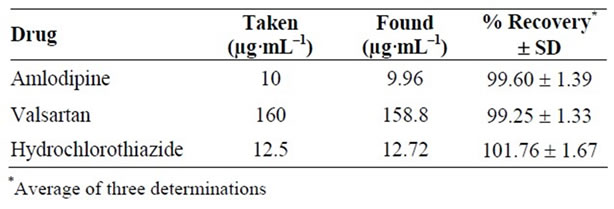
Table 5. Determination of cited drugs in their pharmaceutical preparations (Exforge HCT® Tablet) using the proposed HPLC method.
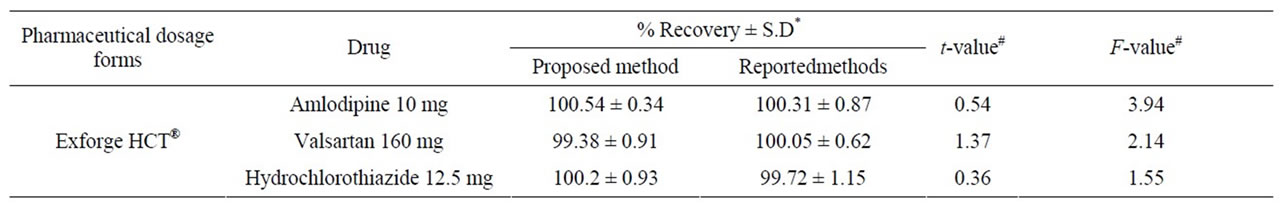
Table 6. Determination of the studied drugs in their combined tablets using the proposed method compared to reference HPLC methods.
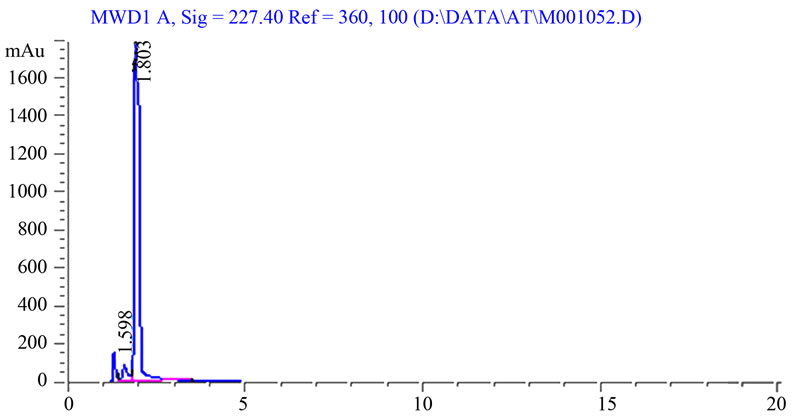
Figure 2. Blank plasma.
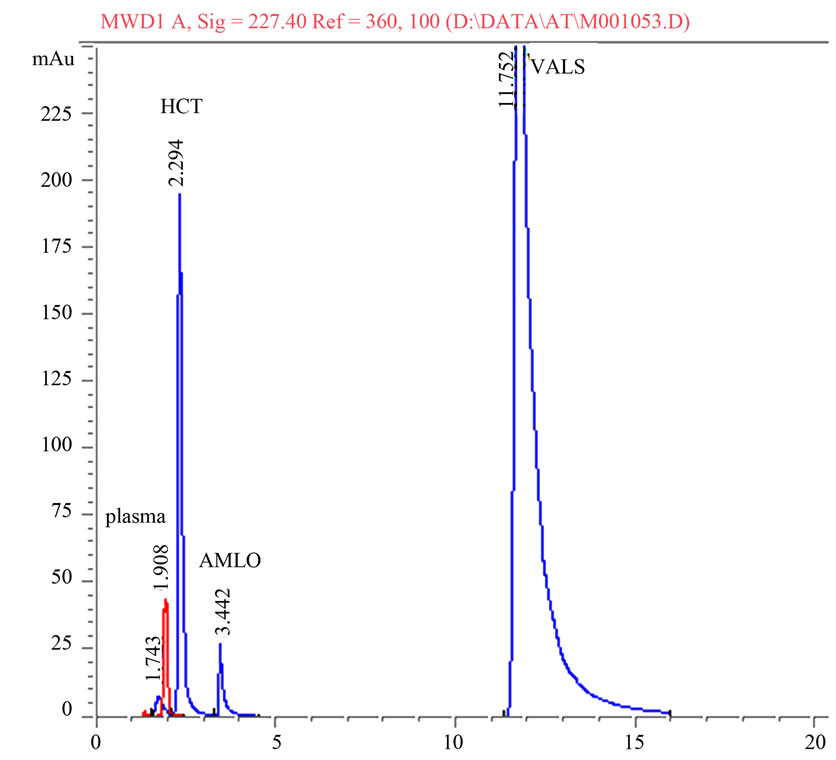
Figure 3. Representative chromatogram of amlodipine, valsartan and hydrochlorothiazide in spiked human plasma.
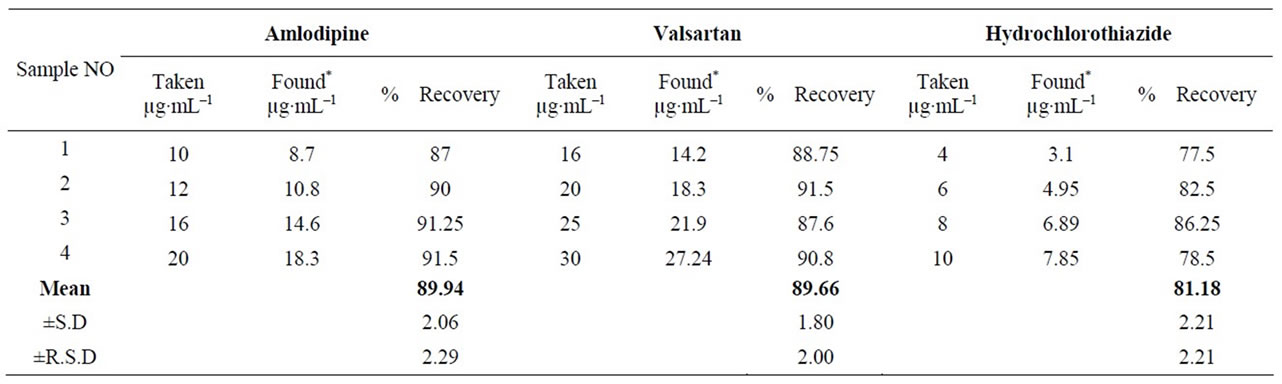
Table 7. Determination of cited drugs in spiked human plasma.
5. Conclusions
The proposed HPLC method was specific and easy to perform allowing rapid simultaneous determination of AML, Vals and HCT in tablets and human plasma. Validation of the proposed procedures was carried out according to the ICH [35,36] and USP guidelines.
6. Acknowledgements
The authors express their sincere thanks for providing necessary research facilities as this work has been supported by the bioequivalence center at October University for Modern Sciences and Arts (MSA), 6th October City, Egypt.
REFERENCES
- “The United States Pharcopoeia XXVIIII and NF XXV,” Electronic Version, American Pharmaceutical Association, Washington DC, 2007.
- A. C. Moffat, M. D. Osselton and B. Widdop, “Clarke’s Analysis of Drugs and Poisons,” 3rd Edition, Electronic version, Pharmaceutical Press, London, 2004.
- “British Pharmacopoeia, Her Majesty’s Stationary Office,” Vol. I, II, Electonic version, London, 2010.
- S. J. Varghese and T. K. Ravi, “Quantitative Simultaneous Determination of Amlodipine, Valsartan, and Hydrochlorothiazide in ‘Exforge HCT’ Tablets Using High-Performance Liquid Chromatograhy and HighPerformance Thin-layer Chromatography,” Journal of Liquid Chromatography & Related Technologies, Vol. 34, No. 12, 2011, pp. 981-994. doi:10.1080/10826076.2011.565539
- K. Anandakumar and M. Jayamariappan, “Absorption Correction Method For The Simultaeous Estimation of Amlodipine Besylate,Valsartan and Hydrochlorothiazide in Bulk and in Combined Tablet Dosage Form,” Internationa Journal of Pharmacy and Pharmaceutical Sciences, Vol. 3, No. 1, 2011, pp. 23-27.
- K. S. Lakshmi, and S. Lakshmi, “Simultaneous Spectrophotometric Determination of Valsartan and Hydrochlorothiazide by H-Point Standard Addition Method and Partial Least Squares Regression,” Acta Pharmaceutica, Vol. 61, 2011, pp. 37-50. doi:10.2478/v10007-011-0007-5
- M. Stolarczyk, A. Maslanka, J. Krzek and J. Milczarek, “Application of Derivative Spectrophotometry for Determination of Enalapril, Hydrochlorothiazide and Walsartan in Complex Pharmaceutical Preparations,” Acta Poloniae Pharmaceutica, Vol. 65, No. 3, 2008, pp. 275-281.
- K. R. Gupta, A. D. Mahapatra, A. R. Wadodkar and S. G. Wadodkar, “Simultaneous UV Spectrophotometric Determination of Valsartan and Amlodipine in Tablet,” International Journal of ChemTech Research, Vol. 2, No. 1, 2010, pp. 551-556.
- S. Tatar and S. Saglik, “Comparison of UVand Second Derivative-Spectrophotometric and LC Methods for the Determination of Valsartan in Pharmaceutical Formulation,” Journal of Pharmaceutical and Biomedical Analysis, Vol. 30, No. 2, 2002, pp. 371-375. doi:10.1016/S0731-7085(02)00360-6
- E. Satana, S. Altinay, N. G. Goger, S. A. Ozkan and Z. Senturk, “Simultaneous Determination of Valsartan and Hydrochlorothiazide in Tablets by First-Derivative Ultraviolet Spectrophotometry and LC,” Journal of Pharmaceutical and Biomedical Analysis, Vol. 25, No. 5-6, 2001, pp. 1009-1013. doi:10.1016/S0731-7085(01)00394-6
- R. Shaalan and T. S. Belal, “Simultaneous Spectro- fluorimetric Determination of Amlodipine Besylate and Valsartan in Their Combined Tablets,” Drug Testing and Analysis, Vol. 2, No. 10, 2010, pp. 489-493. doi:10.1002/dta.160
- S. B. Wankhede, K. C. Raka, S. B. Wadkar and S. S. Chitlange, “Spectrophotometric and HPLC Methods for Simultaneous Estimation of Amlodipine Besilate, Losartan Potassium and Hydrochlorothiazide in Tablets,” Indian Journal of Pharmaceutical Sciences, Vol. 72, No. 1, 2010, pp. 136-140. doi:10.4103/0250-474X.62239
- D. Kul, B. Dogan-Topal, T. Kutucu, B. Uslu and S. A. Ozkan, “High-Performance Liquid Chromatographic and First Derivative of the Ratio Spectrophotometric Determination of Amlodipine and Valsartan in Their Binary Mixtures,” Journal of AOAC International, Vol. 93, No. 3, 2010, pp. 882-890.
- X. Wei, G. Yang, L. Qi and Y. Chen, “Determination of Nicardipine and Amlodipine in Human Plasma Using On-Line Solid-Phase Extraction with a Monolithic Weak Cation-Exchange Column,” Talanta, Vol. 77, No. 3, 2009, pp. 1197-1202. doi:10.1016/j.talanta.2008.08.034
- A. V. Ramani, P. Sengupta and R. Mullangi, “Development and Validation of a Highly Sensitive and Robust LC-ESI-MS/MS Method for Simultaneous Quantitation of Simvastatin Acid, Amlodipine and Valsartan in Human Plasma: Application to a Clinical Pharmacokinetic Study,” Biomed Chromatogr, Vol. 23, No. 6, 2009, pp. 615-622. doi:10.1002/bmc.1161
- I. A. Alsarra, “High-Performance Liquid Chromatographic Method for Quantitative Determination of Amlodipine in Human Plasma and Pharmaceutical Dosage Form and Its Application to Pharmacokinetic Studies,” Journal of Chromatographic Science, Vol. 47, No. 10, 2009, pp. 863-867.
- D. N. Vora and A. A. Kadav, “Development and Validation of a Simultaneous HPLC Method for Estimation of Bisoprolol Fumarate and Amlodipine Besylate from Tablets,” Indian Journal of Pharmaceutical Sciences, Vol. 70, No. 4, 2008, pp. 542-546. doi:10.4103/0250-474X.44616
- D. A. Shah, K. K. Bhatt, R. S. Mehta, S. L. Baldania and T. R. Gandhi, “Stability Indicating RP-HPLC Estimation of Atorvastatin Calcium and Amlodipine Besylate in Pharmaceutical Formulations,” Indian Journal of Pharmaceutical Sciences, Vol. 70, No. 6, 2008, pp. 754-760. doi:10.4103/0250-474X.49117
- S. Aryal, and N. Skalko-Basnet, “Stability of Amlodipine Besylate and Atenolol in Multi-Component Tablets of Mono-Layer and Bi-Layer Types,” Acta Pharmaceutica, Vol. 58, No. 3, 2008, pp. 299-308. doi:10.2478/v10007-008-0012-5
- H. Li, Y. Wang, Y. Jiang, Y. Tang, J. Wang, L. Zhao and J. Gu, “A liquid Chromatography/Tandem Mass Spectrometry Method for the Simultaneous Quantification of Valsartan and Hydrochlorothiazide in Human Plasma,” Journal of Chromatography B, Vol. 852, No. 1-2, 2007, pp. 436-442. doi:10.1016/j.jchromb.2007.02.014
- G. Iriarte, N. Ferreiros, I. Ibarrondo, R. M. Alonso, M. I. Maguregi, L. Gonzalez and R. M. Jimenez, “Optimization via Experimental Design of an SPE-HPLC-UV-Fluorescence Method for the Determination of Valsartan and Its Metabolite in Human Plasma Samples,” Journal of Separation Science, Vol. 29, No. 15, 2006, pp. 2265-2283. doi:10.1002/jssc.200600093
- E. Francotte, A. Davatz and P. Richert, “Development and Validation of Chiral High-Performance Liquid Chromatographic Methods for the Quantitation of Valsartan and of the Tosylate of Valinebenzyl Ester,” Journal of Chromatography B: Biomedical Sciences and Applications, Vol. 686, No. 1, 1996, pp. 77-83. doi:10.1016/S0378-4347(96)00242-3
- D. F. Tian, X. L. Tian, T. Tian, Z. Y. Wang and F. K. Mo, “Simultaneous Determination of Valsartan and Hydrochlorothiazide in Tablets by RP-HPLC,” Indian Journal of Pharmaceutical Sciences, Vol. 70, No. 3, 2008, pp. 372-374. doi:10.4103/0250-474X.43006
- S. S. Chitlange, K. Bagri and D. M. Sakarkar, “Stability Indicating RP-HPLC Method for Simultaneous Estimation of Valsartan and Amlodipine in Capsule Formulation,” Asian Journal of Research in Chemistry, Vol. 7, No. 1, 2008, pp. 15-18.
- G. Iriarte, O. Gonzalez, N. Ferreiros, M. I. Maguregui, R. M. Alonso and R. M. Jimenez, “Validation of a Fast Liquid Chromatography-UV Method for the Analysis of Drugs Used in Combined Cardiovascular Therapy in Human Plasma,” Journal of Chromatography B, Vol. 877, No. 27, 2009, pp. 3045-3053. doi:10.1016/j.jchromb.2009.07.018
- N. J. Shah, B. N. Suhagia, R. R. Shah and N. M. Patel, “HPTLC Method for the Simultaneous Estimation of Valsartan and Hydrochlorothiazide in Tablet Dosage Form,” Indian Journal of Pharmaceutical Sciences, Vol. 71, No. 1, 2009,pp. 72-74. doi:10.4103/0250-474X.51967
- S. N. Meyyanathan and B. Suresh, “HPTLC Method for the Simultaneous Determination of Amlodipine and Benazepril in Their Formulations,” Journal of Chromatographic Science, Vol. 43, No. 2, 2005, pp. 73-75.
- A. O. Alnajjar, “Validation of a Capillary Electrophoresis Method for the Simultaneous Determination of Amlodipine Besylate and Valsartan in Pharmaceuticals and Human Plasma,” Journal of AOAC International, Vol. 94, No. 2, 2011, pp. 498-502.
- S. Hillaert and W. Van den Bossche, “Simultaneous Determination of Hydrochlorothiazide and Several Angiotensin-II-Receptor Antagonists by Capillary Electrophoresis,” Journal of Pharmaceutical and Biomedical Analysis, Vol. 31, No. 2, 2003, pp. 329-339. doi:10.1016/S0731-7085(02)00643-X
- S. Hillaert and W. Van den Bossche, “Optimization and Validation of a Capillary Zone Electrophoretic Method for the Analysis of Several Angiotensin-II-Receptor Antagonist,” Journal of Chromatography A, Vol. 979, No. 1-2, 2002, pp. 323-333. doi:10.1016/S0021-9673(02)01247-5
- L. Gonzalez, U. Akesolo, R. M. Jimenez and R. M. Alonso, “Application of Capillary Zone Electrophoresis to the Screening of Some Angiotensin II Receptor Antagonists,” Electrophoresis, Vol. 23, No. 2, 2002, pp. 223-229. doi:10.1002/1522-2683(200202)23:2<223::AID-ELPS223>3.0.CO;2-T
- J. Yan, W. Wang, L. Chen and S. Chen, “Electrochemical Behavior of Valsartan and Its Determination in Capsules,” Colloids Surf B Biointerfaces, Vol. 67, No. 2, 2008, pp. 205-209. doi:10.1016/j.colsurfb.2008.08.015
- A. A. Gazy, “Determination of Amlodipine Besylate by Adsorptive Square-Wave Anodic Stripping Voltammetry on Glassy Carbon Electrode in Tablets and Biological Fluid,” Talanta, Vol. 62, No. 3, 2004, pp. 575-582. doi:10.1016/j.talanta.2003.08.025
- G. Altiokka, D. Dogrukol-Ak, M. Tuncel and H. Y. Aboul-Enein, “Determination of Amlodipine in Pharmaceutical Formulations by Differential-Pulse Voltammetry with a Glassy Carbon Electrode,” Archiv der Pharmazie (Weinheim), Vol. 335, No. 2, 2002, pp. 104-108. doi:10.1002/1521-4184(200203)335:2/3<104::AID-ARDP104>3.0.CO;2-Q
- ICH Harmonized Tripartie Guidline Q2B (R1), “Validation of Analytical Proceudures: Text and Methodology,” Incorporated in November 2005. http://www.ich.org
- ICH Harmonized Tripartie Guidline Q2A, “Text on Validation of Analytical Procedures,” Incorporated in November 2005. http://www.ich.org
- K. Rao, N. Jena and M. Rao, “Development and Validation of a Specific Stability Indicating High Performance Liquid Chromatographic Method for Valsartan,” Journal of Young Pharmacists, Vol. 2, No. 2, 2010, pp. 183-189. doi:10.4103/0975-1483.63166
- A. Zarghi, S. M. Foroutan, A. Shafaati and A. Khoddam, “Validated HPLC Method for Determination of Amlodipine in Human Plasma and Its Application to Pharmacokinetic Studies,” Farmaco, Vol. 60, No. 9, 2005, pp. 789-792. doi:10.1016/j.farmac.2005.06.012
- K. B. Alton, D. Desrivieres and J. E. Patrick, “High-Performance Liquid Chromatographic Assay for Hydrochlorothiazide in Human Urine,” Journal of Chromatography, Vol. 374, No. 1, 1986, pp. 103-110.
Chemical Structures:
Amlodipine
Hydrochlorothiazide
Valsartan
