American Journal of Analytical Chemistry
Vol. 3 No. 4 (2012) , Article ID: 18427 , 5 pages DOI:10.4236/ajac.2012.34040
A 100% Water Mobile Phase HPLC-PDA Analysis of Melamine and Related Analogues
Graduate School of Human Life Science, Osaka City University, Osaka, Japan
Email: furusawa@life.osaka-cu.ac.jp
Received February 21, 2012; revised March 25, 2012; accepted April 3, 2012
Keywords: Melamine; Cyanuric Acid; Ammeline; Ammelide; High-Performance Liquid Chromatography; 100% Water Mobile Phase
ABSTRACT
This paper describes a reserved-phase high performance liquid chromatographic method for detecting melamine (MEL) and related analogues, cyanuric acid (CYA), ammeline (AML), and ammelide (AMD), using a 100% water mobile phase. Chromatographic separation was performed an Inertsil® ODS-4 (250 × 4.6 mm, 5 μm) with a water mobile phase and a photodiode-array detector. The monitoring wavelength was adjusted to 210 nm which represents an average maximum for all the analytes. The total run time was < 8 min. The method shows high stability, significant linearity and satisfactory sensitivity. The detection limits were established in the range 23 - 46 ng.mL–1. An inexpensive and harmless method for the simultaneous detection of MEL, CYA, AML, and AMD was developed and may be further applied to the quantification in foods.
1. Introduction
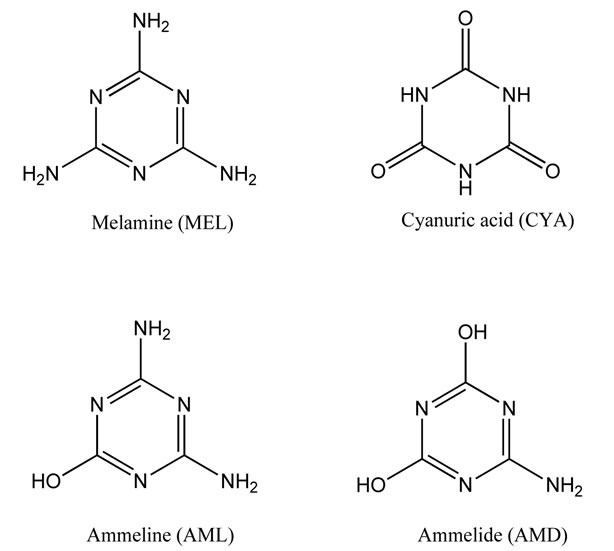
In 2007, pet foods adulterated melamine resulted in the serious illness of animals that consumed the food. The following year, there have been reports from several countries of melamine adulteration of a variety of food products, including milk and milk-derived ingredients from China [1]. It was found that pet foods and milk products were deliberately interlarded with MEL (Figure 1) to boost their total nitrogen content. The interlarded foods have apparently elevated protein content [2]. MEL used for the adulteration contains three related analogues, byproducts in the manufacturing of MEL, namely cyanuric acid (CYA), ammeline (AML), and ammelide (AMD) (Figure 1) [3].
In a follow up survey in infant formula samples purchased in Canada, the Health Canada found the four compounds in almost all infant formula products: the total of MEL-related compounds (sum of all four compounds) in all samples was below the interim standard of 0.5 μg.kg−1 for infant formula products established by Health Canada [4]. Although MEL, CYA, AML, and ADM themselves are not known to be particularly toxic, it is believed that the coexistence of MEL and related analogues cause the health problem [5].
In response to the recent expansion in the internal food trade, the development of international harmonized methods to determine chemical residues in foods is essential to guarantee equitable international trade in these foods and ensure food safety for consumers. Whether in Industrial nations or developing countries, an internal harmonized method for residue monitoring in foods is urgentlyneeded. The optimal harmonized method must be easy-to-use, economical in time and cost, and must cause no harm to the environment and analyst.

Figure 1. Chemical structures of melamine and related analogues.
For determining either MEL alone or with related analogues, previous HPLC techniques combined with UV [6], photo-diode array detector (PDA) [7], and LC-MS/ MS [8-11] have been reported. The US Food and Drug Administration issued new methods for the analysis of melamine in liquid formula, based on LC-MS/MS detection [12]. However, these methods have crucial drawbacks: 1) all of the methods consume large quantities of organic solvents in the mobile phases. Risk associated with these solvents extend beyond direct implications for the health of humans and wildlife to affect our environment and the ecosystem in which we all reside. Additionally, incineration for disposal of waste organic solvents has steadily increasing over the past ten-odd years and has spent huge amounts of money. Eliminating the use of organic solvents is an important goal in terms of environmental conservation, human health and the economy [13,14]; 2) over half of the recent methods are LC-MS/MS. The facilities that LC-MS/MS system is available are limited to part of industrial nations because these are hugely expensive, and the methodologies use complex and specific. These are unavailable in a lot of laboratories for routine analysis, particularly in developing countries.
As the first examination problem in the establishment of an international harmonized method for the residue monitoring of MEL, CYA, AML, and AMD, this paper describes a 100% water mobile phase HPLC conditions to detect the four compounds without organic solvent consumption.
2. Experimental
2.1. Chemicals and Reagents
Standards of melamine (MEL), cyanuric acid (CYA), ammeline (AML), and ammelide (AMD) and other chemicals were purchased from Wako Pure Chem. Ltd. (Osaka, Japan). Distilled water was of HPLC grade. Diethylamine was of analytical reagent grade. These standards and chemicals were greater than 99% purity.
2.2. Equipments
The HPLC system, used for method development, included a model PU-980 pump and DG-980-50-degasser (Jasco Corp., Tokyo, Japan) equipped with a model CO-810 column oven (Thosoh Corp., Tokyo, Japan), as well as a model SPD-M10AVP photodiode-array (PDA) detector (Shimadzu Scientific Instruments, Kyoto, Japan).
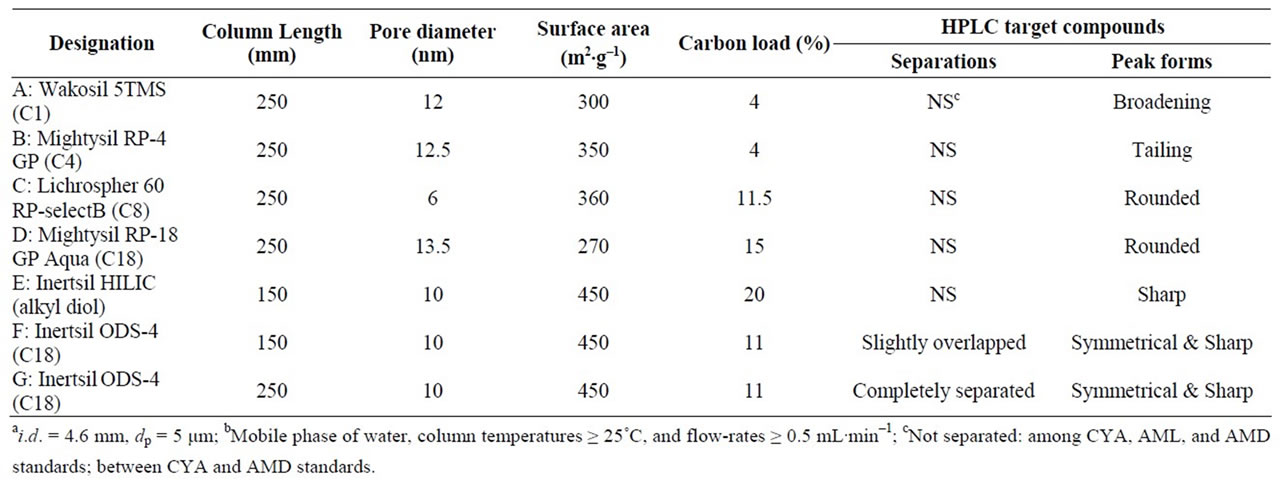
The following seven types of non-polar sorbent columns (5 μm dP) (length: 150 or 250 × 4.6 mm i.d.) for HPLC analysis were used: Column A: Wakosil® 5TMS (C1) (250 mm length) (Wako); B: Mightysil® RP-4 GP (C4) (250 mm length) (Kanto Chemical Co., Inc., Tokyo, Japn); C: Lichrospher® 60 RP-selectB (C8) (250 mm length) (Merck, Darmstadt, Germany); D: Mightysil RP-18 GP Aqua (C18) (250 mm length) (Kanto); E: Inertsil® HILIC (alkyl diol) (150 mm length) (GL Sciences, Tokyo, Japan); F: Inertsil ODS-4 (C18) (150 mm length) (GL); G: Inertsil ODS-4 (C18) (250 mm length) (GL). Table 1 lists the particle physical specifications.
2.3. Operating Conditions
The analytical column was an Inertsil® ODS-4 (octadecyl groups chemically bonded silica, C18) (250 × 4.6 mm, 5 μm dp, 450 m2.g–1 surface area, 100 Ǻ pore diameter, 1.05 mL.g–1 pore volume, 11% carbon load) column (GL Sciences) using a water mobile phase at a flow rate of 1.0 mL.min–1 at 25℃. PDA detector was operated at 190 - 300 nm: the monitoring wavelength was adjusted to 210 nm which represents an average maximum for all the analytes.

Table 1. Physical/chemical specifications of the reversed-phase columnsa used and chromatographic ML, CYA, AML, and AMD separations/peak forms obtained under the HPLC conditions examinedb.
2.4. Preparation of Stock Standards and Working Mixed Solutions
Stock standard solutions of MEL and CYA were prepared by dissolving each of MEL and CYA in water to a concentration of 10 μg.mL–1. In regard to AML and AMD, each stock standard solution was prepared by accurately weighing 5 mg, dissolving it in 20 mL of diethylamine and diluting to 500 mL with water. Working mixed standard solutions of these four compounds were prepared by suitably diluting the stock solutions with water. These solutions were kept in a refrigerator (5℃).
2.5. HPLC Validation
2.5.1. Linearity
The calibration curve was generated by plotting peak areas ranging from 50 to 5000 ng.mL–1 versus their concentrations. The linearity was assessed from the linear regression with its correlation coefficient.
2.5.2. Detection Limit and Minimum Detectable Amount
The detection limit should correspond to the concentration for which the signal-to-noise ratio. The value was defined as the lowest concentration level resulting in a peak area of three times the baseline noise.
2.5.3. Standard Solution Stability
The stability of stock solutions of the target compounds were evaluated at room temperature, 25˚C, for 24 h and 5˚C for 10 days, respectively. After completion of the storage time, the stability was tested by comparing the HPLC response with that of freshly prepared solutions. In the same manner, a working mixed standard solution (1000 ng.mL–1 of each compound) was tested.
2.5.4. Robustness
Changes of ±5% units of the flow rate (1.0 mL.min–1) and the column temperature (25˚C) were determined. The effect on the peak areas and the validations in the retention times were evaluated.
2.5.5. System Suitability Test
The HPLC system suitability was evaluated as the relative standard deviations of peak areas and retention times calculated for 20 replicate injections of a mixed standard solution (100 ng.mL–1 of each compound).
3. Results and Discussion
3.1. Optimum HPLC Conditions
In order to achieve the separation with a 100% water mobile phase, this study tested seven types of non-polar sorbent columns. The physical and chemical specifications are listed in Table 1. This study examined column temperatures (≥20˚C) and flow rates (≥0.5 mL.min–1). The seven columns were compared with regard to the separation among the four target compounds and the sharpness of the peaks peak obtained upon injection of equal amounts. The chromatographic separations and peak forms formed within the conditions ranges examined are also presented in Table 1.
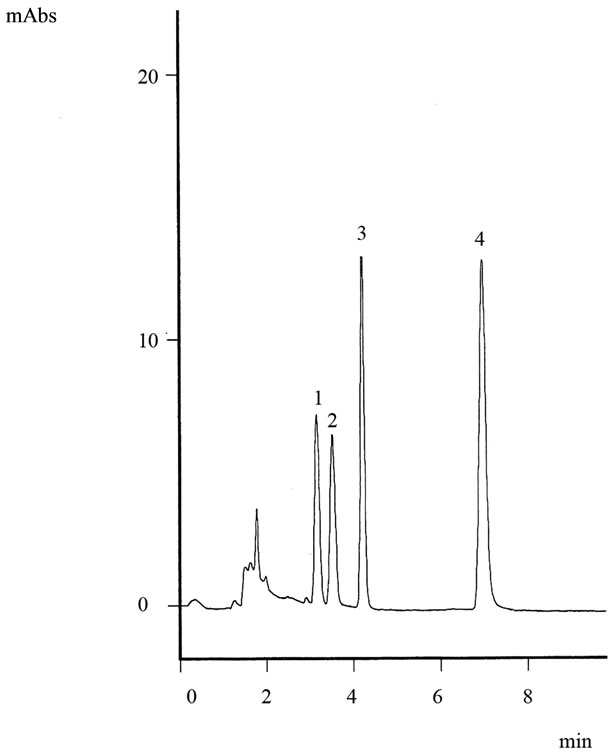
The complete separation of MEL, CYA, AML, and AMD and their symmetrical peaks were obtained by a Column G and a 100% water mobile phase with a column temperature of 25˚C and a flow rate of 1.0 mL.min–1. Figure 2 displays that the resulting chromatogram obtained from the HPLC. The four peaks are clearly distinguished <8 min (Figure 2). From the data shown in Table 1, it is difficult to prove the criterial parameter in the column with regard to the retentions of the target compounds and their peak forms.
3.2. HPLC Validation
3.2.1. Main Validation Data
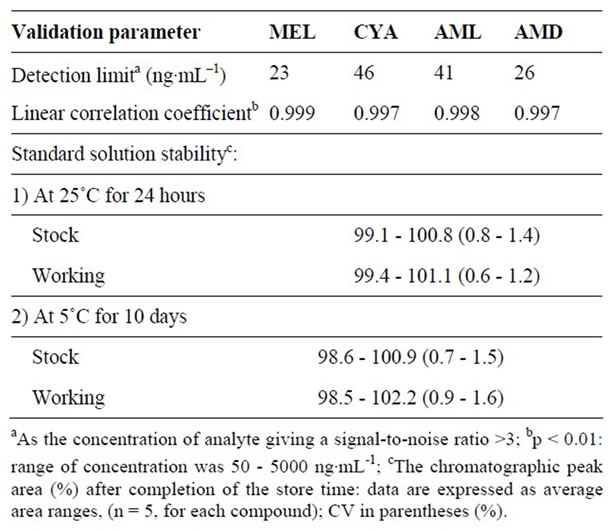
Table 2 summarizes the validation data for the main performance parameters (linearity, detection limit, minimum detectable amount, and standard solution stability). The

Figure 2. Typical chromatogram of standard mixture (500 ng.mL–1 of each compound) obtained from the HPLC system. Peaks, 1 = CYA (retention time, Rt = 3.13 min); 2 = AMD (Rt = 3.49 min); 3 = AML (Rt = 4.19 min); 4 = MEL (Rt = 6.96 min).

Table 2. Main HPLC validation data.
present standard stabilities were well within the international acceptance criteria [15].
3.2.2. Robustness
Changes of ±5% of the flow rate and the column temperature had no effect on the peak areas, whereas the variations in the retention times were obtained with the flow rate and the column temperature. Normal retention times for MEL, CYA, AML, and AMD were 6.96, 3.13, 4.19, and 3.39 min, respectively. At +5% the flow rate, the four retention times were decreased, ranging between 1.4 and 4.7% and at –5%, the times were increased ranging between 5.5 and 8.0%. By changing the column temperature by +5%, decreasing retention times obtained were 1.6% - 7.1%, however, no significant variations were observed with –5%. During these studies, all the target compounds were separated.
3.2.3. System Suitability
The system-suitability evaluation is an essential parameter of HPLC determination, and it ascertains the strictness of the system used. The values for all four compounds were estimated to be <0.4% for peak areas and <0.6% for retention times.
4. Conclusion
A breakthrough HPLC-PDA method for detecting MEL and related analogues, CYA, AML, and AMD, using a 100% water mobile phase has been successfully established. A water mobile phase method, which has never happened before, is harmlessness to the environment and to humans and has a short run time and high sensitivity. For the quantification in various foods, the proposed HPLC method will be applicable enough by performing a suitable sample preparation technique.
REFERENCES
- Health Canada, “Melamine,” 2011. http://www.hc-sc.gc.ca/fn-an/securit/chem-chim/melamine/index-eng.php#who
- World Health Organization, “Melanie and Cyanuric Acid: Toxicity, Preliminary Risk Assessment and Guidance on Levels in Food,” Updated 30 October 2008. http://www.who.int/foodsafety/fs_management/Melamine.pdf
- W. H. Tolleson, et al., “Background Paper on the Chemistry of Melamine Alone and in Combination with Related Compounds,” Health Canada, Ottawa, 2008. http://www.who.int/foodsafety/fs_management/Melamine_2.pdf
- E. Braekevelt, et al., “Determination of Melamine, Ammeline, Ammelide and Cyanuric Acid in Infant Formula purchased in Canada by Liquid Chromatography-Tandem Mass Spectrometry,” Food Additives and Contaminants, Vol. 28, No. 6, 2011, pp. 698-704. doi:10.1080/19440049.2010.545442
- US Food and Drug Administration, “Interim Melamine and Analogues Safety/Assessment Executive Summary,” 2011. http://www.fda.gov/ScienceResearch/SpecialTopics/Peer ReviewofScientificInformationandAssessments/ucm155012. htm
- G. Venkatasami and J. R. Sowa Jr., “A Rapid, Acetonitrile-Free, HPLC Method for Determination of Melamine in Infant Formula”, Analytica Chimica Acta, Vol. 665, No. 1, 2010, pp.227-230. doi:10.1016/j.aca.2010.03.037
- M. Rambla-Alegre, et al., “Development of an Analytical Methodology to Quantify Melamine in Milk Using Micellarliquid Chromatography and Validation According to EU Regulation 2002/654/EC,” Talanta, Vol. 81, No. 3, 2010, pp. 894-900. doi:10.1016/j.talanta.2010.01.034
- J. Mi, et al., “Agilent Technologies Application Note 5989- 9950EN,” 2008.
- B. N. Tran, et al., “Use of Methanol for Efficient Extraction and Analysis of Melamine and Cyanuric Acid Residues in Dairy Products and Pet Foods”, Journal of Agricultural Food Chemistry, Vol. 58, No. 1, 2010, pp. 101- 107. doi:10.1021/jf903040z
- H. Yu, et al., “Development of a High Performance Liquid Chromatography Method and a Liquid Chromatography-Tandem Mass Spectrometry Method with Pressurized Liquid Extraction for Simultaneous Quantification and Confirmation of Cyromazine, Melamine and Its Metabolites in Foods of Animal Origin,” Analytica Chimica Acta, Vol. 682, No. 1-2, 2010, pp. 48-58. doi:10.1016/j.aca.2010.09.032
- S. Tittlemier, “Background Paper on Methods for the Analysis of Melamine and Related Compounds in Foods and Animal Feeds,” World Health Organization, Ottawa, 2008. http://www.who.int/foodsafety/fs_management/Melamine_1.pdf
- US FDA Laboratory Information Bulletin No 4421. http://www.cfsan.fda.gov/~frf/lib4421.html
- P. T. Anastas and J. C. Warner, “Green Chemistry: Theory and Practice,” Oxford University Press, Oxford, 1998.
- T. Yoshimura, T. Nishinomiya, Y. Homda and M. Murabayashi, “Green Chemistry—Aim for the Zero Emission-Chemicals,” Sankyo Publishing Co. Ltd. Press, Tokyo, 2001.
- US Department of Health and Human Services Food and Drug Administration, Center for Drug Evaluation and Research, and Center for Veterinary Medicine, US Food and Drug Administration, “Guidance for Industry: Bioanalytical Mthod Validation,” 2001. http://www.fda.gov/downloads/Drugs/GuidanceComplian ceRegulatoryInformation/Guidances/ucm070107.pdf#search ='FDA

