American Journal of Industrial and Business Management
Vol.05 No.12(2015), Article ID:61963,21 pages
10.4236/ajibm.2015.512073
Comparison of Decision Making in Adopting E-Commerce between Indonesia and Chinese Taipei (Case Study in Jakarta and Taipei City)
Ben Chang Shia, Mingchih Chen, Agus David Ramdansyah, Shuyan Wang
Business Administration, Fu Jen Catholic University, Taiwan

Copyright © 2015 by authors and Scientific Research Publishing Inc.
This work is licensed under the Creative Commons Attribution International License (CC BY).
http://creativecommons.org/licenses/by/4.0/


Received 13 November 2015; accepted 14 December 2015; published 17 December 2015
ABSTRACT
The number of people using internet has increased due to advances in information technology, and the growth of electronic commerce (e-commerce) is increasingly growing. This study aims to investigate the factors that influence consumer intention to adopt e-commerce in Jakarta and Taipei. In this paper, additional variables such as trust, costs, social influences, various services, and control variables such as age, educational level, and gender of consumers become work extension of traditional model of technology acceptance (TAM) and the diffusion of innovation (DOI) models. By comparing consumers from both Jakarta and Taipei, this research is able to form a comparison model based on two different cultural settings. Data are collected from 192 Jakarta consumers and 184 Taipei consumers, and ANCOVA is employed to test the research model. The results show that trust, cost, social influence, and variety of services, perceived usefulness and trialability have significant influence to Jakarta consumer decisions to adopt e-commerce. All of variables except variety of services have significant influence to Taipei consumer decisions to adopt e-commerce. Demographic profile such as age, gender and education level have no significant influence to both cities consumers. Results from this study will be useful for online companies in formulating marketing strategy, especially for companies that will operate in Indonesian market, since Indonesia is a huge and growing market.
Keywords:
E-Commerce, Technology Acceptance Model (TAM), Consumer Behavior, ANCOVA

1. Introduction
Since its first gain prevalence in the 1990s, electronic commerce (e-commerce) has revolutionized business. Profound changes on the competitiveness and industrial structure are happening due to introduction of e- commerce. Travel and music industries are some examples of how significant changes to their business models as a result of e-commerce. Liao et al. (2006) [1] stated that over the past decade, the explosive growth of the World Wide Web (the Web), coupled with the rapid expansion of public access to these media, had bolstered the practice of doing business on-line and had attracted a great deal of attention from entrepreneurs, executives, and investors. With the growth of Information Technology, electronic commerce (e-commerce) is now seen as the new business model and platform that will have a similar, if not bigger, it will impact on the business com- munities and industries than traditional commerce.
The introduction of e-commerce to businesses brings profound changes to the competitiveness and structure of industry. Maity & Mayukhdass (2014) [2] pointed out that with technological advancements, firms were increasingly reaching out to their customers through a variety of channels such as electronic commerce, mobile commerce, and brick and mortar establishments. Therefore, the investigation in the effects of internet techno- logy on the services organizations performance with the e-commerce orientations has a great importance. The increasing volume of e-commerce in the world, using it by the economic firms and gradual acceptation of it from consumers demonstrates potential advantages of e-commerce in the economic and commercial context. Thus, there is no choice to use it in the economic and commercial activities.
However, The digital gap of e-commerce adoption among countries is widening. Nurshafiqa (2013) [3] noted that although the number of internet subscribers is increasing, actual e-commerce activities in many developing countries remain low. This means that although when consumers are using the Internet to do their activity such as listening to music, browsing, and socializing, the widespread usage of e-commerce, where consumers conduct transactions for goods or services using e-commerce, which remains low. The key question faced by telecom- munication providers is how to transfer the potential of e-commerce into financial profits. The adoption of internet technologies such as e-commerce and online banking has been studied by researchers. Studies on consumer decisions to adopt e-commerce however, remain sparce.
The present study focuses on consumer’s decisions making in adopting e-commerce. Specifically, we com- pare the perceptions of users from Jakarta city and Taipei city to help identify effective strategies for EC companies in Indonesia to attract users from wider global market. Indonesia is interesting market, where the EC market is taking off, and consumers from Taipei city are used to investigate cross-border EC. We have focused on younger students, such as university and high school students.
In sum, this study empirically describes consumers perceptions which can be used as a based to make stra- tegies in attracting consumers from developed countries to use EC to make purchases in developing countries and vice versa, which we do by shedding light on behavior differences between Indonesia and Chinese Taipei consumer’s perceptions
2. Literature Review
2.1. E-Commerce
In general terms, Lignell (2014) [4] stated that e-commerce refers to buying or ordering goods via the internet for a consumer’s personal or household’s consumption, regardless of whether the invoice for payment arrives later or the goods are paid immediately via electronic banking, credit card, electronic payment or similar. According to Helgueros (2012) [5] , business model talks about how the company makes money identifying its place on the chain value. There have been few attempts to formally define and classify Business models in e-commerce context. Mahadevan (2000) [6] pointed out that a business model in internet is a unique blend of three streams that are critical to the business. These include the value stream for the business partners and the buyers, the revenue stream, and the logistical stream. The value stream identifies the value proposition for the buyers, sellers, and the market makers and portals in an Internet context. The revenue stream is a plan for assuring revenue generation for the business. The logistical stream addresses various issues related to the design of the supply chain for the business.
E-commerce or electronics commerce business models can generally categorized in following categories:
a) Business-to-Business (B2B)
Sila (2013) [7] categorized B2B as “outside-in” resources (i.e. those resources used to manage external relationships and related to market responsiveness). Website following B2B business model sells its product to an intermediate buyer who then sells the product to the final customer. As an example, a wholesaler places an order from a company’s website and after receiving the consignment, sells the end product to final customer who comes to buy the product at wholesaler’s retail outlet.
b) Business-to Consumer (B2C)
According to Namyslowska (2013) [8] , B2C commercial practice is “any act, omission, course of conduct or representation, commercial communication including advertising and marketing, by a trader, directly connected with the promotion, sale or supply of a product to consumers. Website following B2C business model sells its product directly to a customer. A customer can view products shown on the website of business organization. The customer can choose a product and order the same. Website will send a notification to the business orga- nization via email and organization will dispatch the product/goods to the customer.
c) Consumer-to-Consumer (C2C)
C2C e-commerce opens the realm to developing new relationships and forming new interactions. Leonard (2012) [9] emphasized that these interactions do not have to occur through the traditional online C2C auctions, but can occur in other settings such as discussion forums and chat rooms, with some of those interactions ultimately leading to transactions. Website following C2C business model helps consumer to sell their assets like residential property, cars, motorcycles etc. or rent a room by publishing their information on the website. Website may or may not charge the consumer for its services. Another consumer may opt to buy the product of the first customer by viewing the post/advertisement on the website.
d) Consumer-to-Business (C2B)
In this model, Sekulovska (2012) [10] explained that individuals use Internet to sell certain products or services to organizations or businesses. A consumer approaches website showing multiple business organi- zations for a particular service. Consumer places an estimate of amount he/she wants to spend for a particular service. For example, comparison of interest rates of personal loan/car loan provided by various banks via website. Business organization who fulfills the consumer's requirement within specified budget approaches the customer and provides its services.
In addition, there are several other internet business models that refer to electronic commerce. Business to Business to Consumer (B2B2C). It is Electronic commerce model where business supplies. Business-to-Gov- ernment (B2G). B2G model is a variant of B2B model. Such websites are used by government to trade and exchange information with various business organizations. Such websites are accredited by the government and provide a medium to businesses to submit application forms to the government. Government-to-Business (G2B), Government uses G2B model website to approach business organizations. Such websites support auctions, tenders and application submission functionalities. Government-to-Citizen (G2C) Government uses G2C model website to approach citizen as its customers in general. Such websites support auctions of vehicles, machinery or any other material. Such website also provides services like registration for birth, marriage or death certificates. Main objectives of G2C website are to reduce average time for fulfilling people requests for various government services (Table 1).
2.2. E-Commerce in Indonesia and Chinese Taipei
2.2.1. E-Commerce in Indonesia
E-commerce in Indonesia is more or less certainly related to the development of e-commerce in developed countries. By way of spending thousands of innovations presented by the merchants, citizens increasingly facili- tated got the goods they want easily, quickly, and safely. Darwis (2013) [11] indicated that developed countries and developing countries are now directly bound to the system of international economic interdependence and most countries have at least one national asset needed by other countries. But the question is, is it the same conditions with the acceptance of e-commerce in Indonesia?

Table 1. Different models of e-commerce.
Over the last 10 years the merchants and retainer IT business in Indonesia continues to increase the ability of each in terms of convenience and innovative transactions. People who were previously unable to purchase products online, facilitated by a wide selection of products. Then People who previously had to contact the merchant in order to buy a product, later simply done by filling in a specific form, and the product can thank society without even picking up the phone.
The development of e-commerce in Indonesia, which continued to climb is closely related to the carrying capacity of the IT world itself. The existence of Warnet (warung internet or internet cafe) a type of business that leases Internet services to the public and several factors such as the cheapening of the price of Internet access, rental costs are getting cheaper hosting, high internet user forums, networking social and readiness banks provide internet banking service, to the easy development are important factors. Medyawati et al. (2014) [12] showed that some of the government banks, private banks and local government banks in Indonesia are known to have e-Banking facilities including internet banking. However, is it true the e-commerce market in Indonesia can absorb all the superior features as the system of buying and selling is done as a “purely by the system?” Due to this absorption capability, then the e-commerce market in Indonesia can really run well for replacing the conventional way of shopping that still used.
Internet users in Indonesia still have to undergo adjustment with the Internet boom of e-commerce. In other words, prospective buyers still need online transactions education in order to be absolutely sure to spend their money online that presents ease and safe. As shown in Figure 1, which shows the trust factor becomes the biggest problem in online transactions. In fact, the number of online sellers and buyers in Indonesia are increasing over time. This assumption can certainly be another measure of the potential of e-commerce in Indonesia that still leaves a huge opportunity. With the market of internet users 4.6 million people in 2013, the merchant does not only need to introduce a system of e-commerce on-line prospective buyers, but also attract potential buyers offline through promotion and education markets. The challenge is whether society is ready to run the e-com- merce in Indonesia.
E-commerce in Indonesia can be very rapid. If we look at the data released by the Ministry of Communications and Information Technology, e-commerce market in Indonesia in 2013 reach Rp 130 trillion, or in other words it grows almost doubled compared to the previous year to reach Rp 69 trillion. Frost & Sullivan research in Indonesia Indonesian Telecom-Go Online stating that revenue e-commerce transactions mentioned in Indonesia reached USD 120 million in 2010 and will increase to $ 650 million in 2015. Meanwhile, research and Daily Social Veritrans estimates the market share of e-commerce based on public reports and customer is USD 0.6 billion to USD 1.2 billion. And e-commerce spending an annual average is USD 256 and the new 6.5% of Internet users who transact online.
The graph above shows a comparison between total population growth and total internet users in Indonesia from 2000 to 2014. The data was taken from APJII and BPS Indonesia in 2015. Population and Internet users has increased from year to year. With number of Internet users in Indonesia just reached 88.1 million people in 2014 which constitute 34.9% of total population, this number is expected continue to increase. The potential for e-commerce business in Indonesia will be enormous in the coming years.
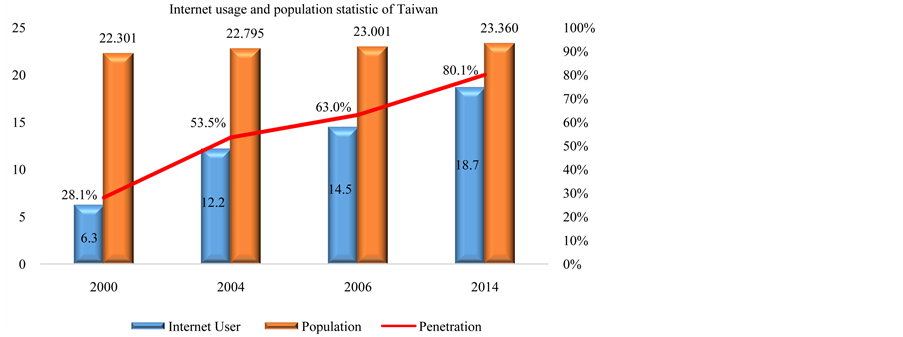
Figure 1. Comparison the total internet users and population in Taiwan 2000-2014. source: http://www.internetworldstats.com.
Based on reports from detiknet, Indonesia sales generated through e-commerce business in 2013 increased 71.3% compared to the year 2012, grew rapidly from $ 1.04 billion or USD 10.2 billion to USD 1.79 billion or USD 17, 72 trillion. Cantilever of sales growth in e-commerce can not be separated from the growing number of people who transact online. If we look back at Figure 2, we can see the trend of an increasing number of online shopper. In 2011, the number of online shoppers approximately 4.6% of the total internet users. Meanwhile, in 2012, rose to 5.2% and this percentage continues to rise to 6.16% in 2013.
2.2.2. E-Commerce in Taiwan
Unlike to Indonesia, Chinese Taipei is one of the most heavily computerized societies in the world. For example, reports from both the Economist Intelligence Unit (EIU) and IBM Institute for Business Value (IBV) in 2009 ranked Chinese Taipei as sixteenth in the world and second in Asia in terms of ereadiness. Although according to Chien et al. (2012) [13] the birth rate and population growth rate have been decreasing rapidly in recent years. Tsai & Cheng (2012) [14] reported that since 1993, when Taiwan was recognized as an aging society, the proportion of the population aged over 65 years has been rising, reaching 10.7% at the end of 2010, the rapid development of the Internet, different forms of e-commerce have been developed. Wu 2004) [15] found that the number of people who have never used the Internet for shopping is gradually decreasing every year in Taiwan. The industries in Taiwan, however, show a different stage of adopting Web technology. Liao et al. (2006) [1] showed that the finance, electronics, cosmetics, transportation, insurance, aerospace and medical industries have a high percentage of companies (more than 88%) with web sites. Ramanathan et al. (2012) [16] indicated that adoption in people in Taiwan SMEs has also been influenced by various other factors such as relative advantage, complexity, and government’s policies. In travel sector, Huang (2006) [17] found that partner selection positively affects the performance of strategic alliances. B2B ecommerce strategy alliances indeed improve e-travel agencies’ performances.
2.3. Factor Affecting Adoption of E-Commerce and Hypotheses Development
This study based on the literature review, which includes variables trust, cost, social influence, variety of services, perceived of usefulness, perceived ease to use, and triability. Issues such as security and privacy play an important role in influencing consumer’s trust in adopting e-commerce. Although users are assured by various encryptions, and anti-virus tools when conducting their transactions online via computers, security tools for e-commerce remain a relatively new concept to users. Consumers also have to face the uncertainty of conducting transactions on e-commerce without having face-to-face contact with a shop, or having seen the physical products. As such, it also would be interesting to investigate if costs play such a role in affecting consumer decisions to adopt e-commerce. E-commerce is also susceptible to social influence. Consumers might purchase and use certain devices because of the trend or influence from the media and friends. Lastly, as the decisions to adopt e-commerce lie with consumers, it would be important to include demographic profiles of users as control variables to determine if they have any influence on adoption decisions.
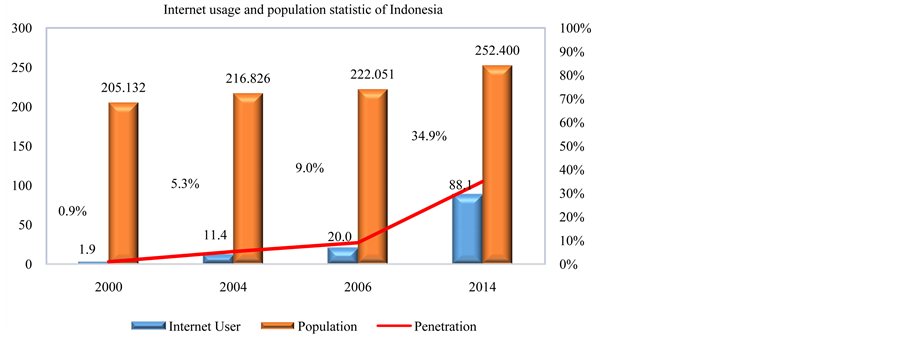
Figure 2. Comparison the total internet users and population in Indonesia 2000-2014. Source: APJII and statistic beareu agency of Indonesia, 2015.
2.3.1. Trust
Many scholars have argued that trust is a prerequisite for successful commerce because according to Kim et al. (2008) [18] consumers are hesitant to make purchases unless they trust the seller. Trust may be defined as whether users are willing to become vulnerable to the e-commerce providers after considering their characteris- tics (e.g. security, brand name). Trust has been studied in existing e-commerce. However, in this research, the aim is to examine whether users are willing to take the risks of trusting e-commerce, even though it involves uncertainties such as the security and privacy risks, and the lack of face-to face interactions with the e- commerce providers. As e-commerce transactions involve transferring data in a wireless environment, users are exposed to higher security and privacy risks. Traditional financial service companies (banks, processors, and card associations) clearly have an advantage from controlling the existing banking and payments infrastructure. The extent to which they can strategically extend their products and services in a way that maintains the customer’s trust in their services be key to their success. A foundational element of that trust is the security of the products and services.
Susanto & Zo (2011) [19] added that besides trust, the e-commerce success is also related to security and privacy, commitment, and loyalty which has become important to the successful penetration in online commerce and e-banking. Slyke et al. (2010) [20] revealed that trust on e-commerce can be influenced by the culture of the consumers. Eid (2011) [21] found that trust plays an important role in influencing organizations’ B2C adoption. Given that it is not possible to completely eliminate the risks of security and privacy in e-commerce, the question to be asked here is whether consumers are willing to take the risk and trust e-commerce providers. Rosydi & Marjan (2013) [22] stated that as risk and uncertainty are always involved in online purchasing, developing confidence level of the trusting parties is important because any of them may be subjected to the violation of trust during the transactions. Pennanen (2011) [23] found that interpersonal e-trustworthiness is more important than institutional etrustworthiness in consumers’ e-trust building. According to Seer et al. (2012) [24] literature study, one of the possible causes of low e-commerce adoption is trust. Table 2 below shows in details.
Furthermore Abyad (2011) [25] stated that both building trust and improving technological safety will play a major role in allowing e-commerce to reach its full potential. Wang & Benbasat (2008) [26] revealed that in the early stages of trust formation, four positive reasons (i.e. knowledge-based, interactive, calculative, and dis- positional) are associated with higher trust and two negative reasons (i.e. calculative and interactive) are associated with lower trust. Their study demonstrate some distinctive features of trust formation with respect to decision support technologies. Based on their study of trust fraud of e-commerce, Zhang et al. (2013) [27] propose a number of directions for improvements to the current trust models. It includes the following para- meters:
Table 2. Possible main causes of low e-commerce adoption.
Source: International Conference “Marketing―from information to decision” 5th edition 2012.
Transaction amount weight. Various transaction amounts should be treated differently in the trust calcu- lation;
Time decay coefficient. Trust should reflect sellers’ recent trading activities;
Trust factors. These include quality, service and shipping speed, which should be considered and treated differently according to the buyer’s opinions.
Further, Koon et al. (2012) [28] stated that buyers’ trust in suppliers is critical in all commerce, but par- ticularly e-commerce, due to more pronounced information asymmetry, where buyers have incomplete in- formation about suppliers. Based on Kim And Izak BenbaSat (2009) [29] study, customers are more influenced by the content of trust-assuring arguments when the price of a product is relatively high than when it is relatively low. Therefore this study hypothesizes that:
H1a: Trust has a significant relationship with Jakarta consumer decisions to adopt e-commerce;
H1b: Trust has a significant relationship with Taipei consumer decisions to adopt e-commerce.
2.3.2. Cost
E-commerce brings many advantages for everyone, including the company, customers and communities as a whole. One of the advantages is that companies get the opportunity to quickly and inexpensively explore markets in the world, on order to create competitive products for these markets. Kikovska & Georgievska (2013) [30] emphasized that by joining the e-commerce, companies reduce communication costs, the costs for collecting information, promotion costs, labour costs (they need less employees) etc. Time and space distance, once a barrier in the form of costs and trade limitation, is immeasurably reduced today. Li & Xie (2012) [31] found that small and medium firms tend to take e-commerce as a source to acquire competitive advantages, while large ones tend to take it as a way to simplify firm operation and lower costs.
Greater potential in business e-commerce have encouraged companies to move from traditional method to the online business worldwide. Alam et al. (2011) [32] argued that companies have much greater incentive to adopt e-commerce than consumers because it offered many benefi ts to companies such as massive cost saving in transaction costs, improved effi ciency and strategic fl exibility by developing more dynamic and fl exible rela- tionships with key business partners.
In markets, extensive searches, price comparison, and a focus on one-off transactions with the lowest-cost supplier are considered superior. Technology is regarded as a means of rationalizing market transactions, thus reducing overall cost. As a result, according to Koch & Ulrike Schultze (2011) [33] trading parties tend to enter into explicitly negotiated, short-term agreements. (Galbreth et al. 2005) [34] noted the existence of lower product prices for buyers, in addition to cost savings for both buyers and sellers. The price savings that buyers can achieve as a result of these network effects in an e-marketplace have been estimated at 5 to 10 percent.
Customers rely on information offered by firms, such as advertising, to lower their search costs. When a multiproduct firm lacks the capability to inform customers about the variety of products it offers and to explain how its offerings will fulfill customers’complementary needs, customers may continue to purchase some from products that vendor and purchase complementary products from competitors that do inform them about their product offerings. Brush et al. (2012) [35] showed that e-commerce can save customer`s search cost, it is the time and effort spent by customers to find products that meet their needs and wants.
In general, Chen (2012) [36] found that not only may lower price benefits motivate consumers to participate in online group buying activities, but convenient cost concerns also trigger them to join. The high level of competition characterising the rapid prototyping service market requires competitive prices, fast quotation times and high quality products. One of the objectives of a company selling on-line is to increase its share of the market until it reaches production saturation capacity. Angelo & Stefano (2010) [37] argued that the market reference for a company, which sells on-line, may reach international levels without a major increase in costs. A rapid prototyping service is an activity that works well on the web. The product specification may be formulated using a geometric model defined by a file that can easily surf the net even at great distances. The distribution network of shipping is characterised by an international dimension, capillary coverage of territory, fast delivery and relatively.
According to Cohen & Kallirroi (2006) [38] , the cost/performance benefits of ecommerce can beategorized in four (4) groups. The first group relates to the reduction of external and internal communication expenses, the second to the revenues generated either from current business or from new initiatives, the third to the tangible benefits, such as reduced costs and more flexible working practices, and the final group refers to intangible benefits such as enhanced competitive positioning and enhanced customer relationships. Vander Meer et al. (2012) [39] stated that by online applications in ecommerce, caching information significantly reduces the customer’s cost. The literature study by Blasco et al. (2010) [40] provides empirical evidence of how costs are a key determinant in e-consumer loyalty, and have a moderating effect on customer loyalty through satisfaction. Therefore there is a need to examine if cost factors affect consumers in general. Therefore this study hypo- thesizes that:
H2a: Cost has a significant relationship with Jakarta consumer decisions to adopt e-commerce;
H2b: Cost has a significant relationship with Taipei consumer decisions to adopt e-commerce.
2.3.3. Social Influence
We define social influence as the “degree to which an individual believed that others thought they should use electronic commerce services”. When making a purchase decision, social influence plays an important role. Mahadeo (2009) [41] divided Social influence into external and interpersonal. The first includes mass media reports, expert opinions, and other nonpersonal information, while the other includes word-of-mouth from friends, colleagues, and superiors.
Once a consumer has defined a list of required features, he can use those to start searching for the right product. But browsing, searching, and buying a product on E-commerce websites is often a time consuming and frustrating task for consumers. Silverman et al. (2001) [42] revealed that over 80% of web shoppers have at some point left e-commerce websites without finding what they want. Purchasing decisions are often strongly influenced by people who the consumer knows and trusts.
Ratten 2010) [43] implied that people often learn by observing others in their social group use a new technology. Consumers did not just talk about retailer social media networks, they also took to social media to express their views and opinions on the shopping experience and the items they purchased. The sentiment for reviews of retailers and their products was nearly five times more positive than negative. Shin (2013) [44] stated that social commerce (s-commerce) is a new form of electronic commerce that involves using social media, an online media that supports social interaction and user contributions, to assist in the online buying and selling of products and services. Mazman et al. (2009) [45] defined social influence with 3 different forms in his theory: 1. Compliance: when an individual accepts influence because he hopes to achieve a favorable reaction from another person or group (social approval/disapproval from others). 2. Identification: when an individual accepts influence because he wants to establish or maintain a satisfying self defining relationship with others. 3. Internalization: when an individual accepts influence because it is congruent with her value system.
Consumers use social media to share news about deals, in store and online shopping experiences and more. The following are some results about social influence in e-commerce from various sources:
Consumers are 71% more likely to make a purchase based on social media referrals (Hubspot);
74% of consumers rely on social networks to guide purchase decisions (SproutSocial);
66.4% of shoppers update their Facebook status to tell friends about best offers and finds (Crowdtap);
58% of Facebook users expect offers, events or promotions when they become fans (Hubspot);
55% of Twitter users discuss gift ideas on Twitter (Twitter );
47.7% of shoppers say that Pinterest content has inspired holiday gift purchases (Crowdtap);
66% of 2012 Black Friday purchases were the result of a social media interaction (Mr Youth );
79% of consumers like a Facebook company page because it offers discounts and incentives TWEET (Forbes);
81% of US respondents indicated that friends’ social media posts directly influenced their purchase decision (Forbes);
32.5% of women say they’re influenced by special offers on Facebook vs 29% on Twitter (Business 2 Community);
78% of respondents said that companies’ social media posts impact their purchases (Forbes);
According to a 2013 study done by Syncapse, 42% of users Like a brand on Facebook to get a coupon or discount .
From information above, many online shoppers tend to wait for the opinions of early adopters before making a purchase decision to reduce the risk of buying a new product. Web-based social communities, actively fostered by e-commerce companies, allow consumers to share their personal experiences by writing reviews, rating reviews, and chatting among trusting members. They drive the volume of traffic to retail sites and become a starting point for Web shoppers. e-commerce companies have recently started to capture data on the social interaction between consumers in their websites, with the potential objective of understanding and leveraging social influence in customers’ purchase decision making to improve customer relationship management and increase sales.
The type of decision making that consumers use to purchase a product/service does not necessarily remain constant. For instance, if a routinely purchased product no longer satisfies, consumers may practice limited or extensive decision making to switch to another brand. E-commerce has dramatic effect on consumer decision making. Narwal & Kant (2014) [46] saw that social networks emerge since many websites help a consumer to take final purchase decision by sharing reviews written by previous customers and evaluated by potential customers. Many online shoppers tend to wait for early adopters’ opinions before making a purchase decision to reduce the risk of buying a new product. Therefore the following hypothesis is proposed:
H3a: Social influence has a significant relationship with Jakarta consumer decisions to adopt e-commerce;
H3b: Social influence has a significant relationship with Taipei consumer decisions to adopt e-commerce.
2.3.4. Variety of Service
In recent years, e-commerce technologies have dramatically changed the nature of services and service delivery systems. As a result, applications of traditional entry-mode strategies for service businesses are no longer adequate. High quality service is an integral part of any successful enterprise, but providing it can be a challenge for online enterprise, especially when customers are complaining about each other. In order to succeed in e-commerce companies are trying to distinguish themselves by offering better services through their websites or third party service providers. Service quality in general and e-service quality in particular will be critical drivers of strategic advantage companies. The intense competition between service businesses has led them to look for profitable ways to differentiate themselves when compared to others. Srinivasa & Gopal (2013) [47] emphasized that a key strategy which facilitates businesses to differentiate with others is the quality of service provided by them.
Many companies are establishing Web sites so that both existing and future customers can interact with the firm through another venue. Customers can obtain product information, make purchases, or resolve customer service problems. Klinger (2003) [48] stated that businesses can more efficiently and effectively service their customers through e-commerce and in turn customers return the favor through increased customer satisfaction, repeat purchases, and overall brand loyalty. In previous empirical research, management can adjust fewer variables on the delivery side than on the return side. In e-commerce, one leniency variable that exists for both deliveries and returns is whether customers pay for shipping or the company entirely subsidizes it. Lantz & Hjort (2013) [49] proposed a basic price theory which suggests that if a service is free, it will generally have a higher demand than if it were not free. If this theory holds, then free deliveries should correspond to higher sales, and free returns should correspond to both higher sales and increased returns. However, Ekeledo & Sivakumar (2004) [50] found that globalization has different implications for different types of services and is affected by the process involved in creating and delivering the service.
Organizations provide services to their subscribers which allow them to interact with and teach others, engage in discussions, and create common-interest resource web pages. Etzion & Pang (2014) [51] showed that a firm can benefit from the technological ability to offer the service, and from an increase in the strength of network effects or in the market size of the service, only when the value customers derive from the direct functionalities (those that do not rely on the network) of the service are sufficiently high. Marketing tasks such as advertising, order taking, billing and bill collection, prospecting for customers, and some customer services can take place online. Technologies now allow certain service processes to be administered from a distance.
Based on the trust-transfer principle, Turel et al. (2008) [52] stated that consumers may use trust in the human customer representative as a basis on which they form trust perceptions regarding the service provider that he or she represents. That is, users can “transfer” trust from the entity with which they interact directly (the customer support representative) to a lesser known entity.
In terms of providing higher value added services such as conducting e-banking activities, good distribution, purchasing on and advertisements remains limited, specialy in developing country. This challenge in e-com- merce lies with the facts that users might not be willing to pay to use e-commerce due to the lack of services. Application developers on the other hand, might not be willing to invest in developing applications if there are not enough users. So the key question to e-commerce providers and application developers therefore is that if more services are being offered, would users be more willing to use them, or are they still hindered by other factors. Therefore the following hypothesis is proposed:
H4a: Variety of services has a significant relationship with Jakarta consumer decisions to adopt e-commerce;
H4b: Variety of services has a significant relationship with Taipei consumer decisions to adopt e-commerce.
2.3.5. Perceived Usefulness
Davis (1989) [53] proposed the Technology Acceptance Model (TAM) which suggests that consumers’ be- havioral intentions are determined by their attitude towards the technology adoption, which is jointly determined by two beliefs: (1) perceived usefulness (PU) and (2) perceived ease of use (PEOU). PU is defined as the individual’s perception that using a particular system would enhance or improve job performance. PEOU refers to the individual’s perception that using a particular system would be free of cognitive effort. TAM further proposes that PU is influenced by PEOU and external variables.
Luo & Lee (2011) [54] found that perceived usefulness was not only play a key role in predicting customers’ attitudes toward online shopping and purchasing intention, but also in the moderating role of the perceptions of international travelers of e-service quality and service satisfaction for consumers who have used e-traveling services. These are not much different from the results of research conducted by Brown & Jayakody (2009) [55] which shows that online shopper satisfaction is directly influenced by service quality and perceived usefulness, whilst perceived usefulness is directly influenced by trust and information quality. Furthermore, Yen & Tsai (2011) [56] showed that satisfaction and perceived usefulness are significant predictors of continuance intention of online shopper.
Ortega and Martinez (2013) [57] stated that the perceived usefulness could be one of the key drivers of its acceptance and general diffusion. However, in their study, Lim et al. (2008) [58] uncover that perceived usefulness has nonsignificant direct effects on e-commerce. The same case found by Wang (2008) [59] that online shopper intention taps a wider range of needs, costs and benefits of information technology (IT) use than perceived usefulness. It would therefore be worthwhile to investigate if perceived usefulness has an influence on Jakarta and Taipei consumer adoption decision:
H5a: Perceived usefulness has a significant relationship with Jakarta consumer decisions to adopt e-com- merce;
H5b: Perceived usefulness has a significant relationship with Taipei consumer decisions to adopt e-commerce.
2.3.6. Perceived Ease of Use
In the TAM model, perceived ease of use is one of the original variables found similar to perceived usefulness. Educational levels, or age groups will make different for users in the perceived ease of use of e-commerce. Although one may argue that e-commerce applications should therefore have a simple interface, sometimes this might be done at the expense of features and functionalities. E-commerce’s advantage also involves personalizing the services to the users. The perceived ease of use has been studied in past technologies such as mobile gaming by Hsu & Lu (2004) [60] , 3G by Chong et al. (2010) [61] , World Wide Web by Lederer et al. (2000) [62] , and Online Banking by Cheng et al. (2006) [63] . Besides the application features which might affect the perceived ease of use, physical features of devices such as how to use the applications, or difficulty in keying data, can also serve as a constraint to the decision to adopte-commerce. In this connection, the following hypotheses are proposed:
H6a: Perceived ease of use has a significant relationship with Jakarta consumer decisions to adopt e-com- merce;
H6b: Perceived ease of use has a significant relationship with Taipei consumer decisions to adopt e-com merce.
2.3.7. Trialability
Trialability refers to whether users given free trials are more likely to accept a new technology. Hsuan et al. 2011) [64] found that it is one of the best predictors of Diffusion of innovations (DOI) theory. Stewart (2012) [65] stated that trialability was a necessary condition for translation of initial intent to adopt to actual adoption. Tan & Teo (2000) [66] found that trialability is a signficiant determinant of internet commerce adoption. Likewise, Brown et al. (2003) [67] also found that trialability is able to influence the adoption of e-banking.
However, Murphy (2005) [68] found that trialability is dependent on access to a high-speed connection and equipment, multiple partners, development of technical expertise, and support. Offering free trials to users also means that e-commerce providers will have to bear the initial costs. This is therefore a risk that a e-commerce provider needs to take into consideration. Chong et al. (2010) [61] in their study however, found that consumers are not influenced by the free trials given to them. Given the inconsistencies in past studies and that e-commerce has different characteristics from other technologies, this study hypothesizes that:
H7a: Trialability has a significant relationship with Jakarta consumer decisions to adopt e-commerce;
H7b:Trialability has a significant relationship with Taipei consumer decisions to adopt e-commerce.
2.4. Control Variables
One advantage of e-commerce is its ability to personalize services to users. Studies such as those from Chong et al. (2010) [61] , (Wei et al. (2009) [69] and Dai & Palvia (2008) [70] have often conducted their surveys on younger users, who are university students. Tan & Teo (2000) [66] found that demographic variables such as age, educational levels, and gender have a significant influence on Internet usage activities in Singapore. This study will therefore include the age and educational level of the users as control variables.
2.5. Research Model
Based on the literature review, a research model is developed as shown in Figure 3. The model shows that the adoption factors (e.g. trust, cost, social influence, variety of services, perceived usefulness, perceived ease of use, and trialability) have a significant influence on consumer decisions to adopt e-commerce. The model also adds the control variables of gender, age and education level.
3. Methodology
3.1. Sample and Procedure
A survey questionnaire was developed to test the hypotheses in this study. The type of sampling was Purposive/Judgemnet sampling (the respondent who familiar with e-commerce). The survey was also translated by a language instructor to ensure that the wording used in the surveys (e.g. Chinese, bahasa Indonesia and English survey) were consistent and back-translation was also adopted to ensure linguistic equivalence of different language versions of the questionnaire. Data was collected by online and offline in Jakarta and Taipei. A total of 192 surveys were collected from the Jakarta consumers, and 184 surveys were collected from Taipei consumers. Table 3 summarizes the demographic profile of the respondents.
Table 3. Demographic profile.
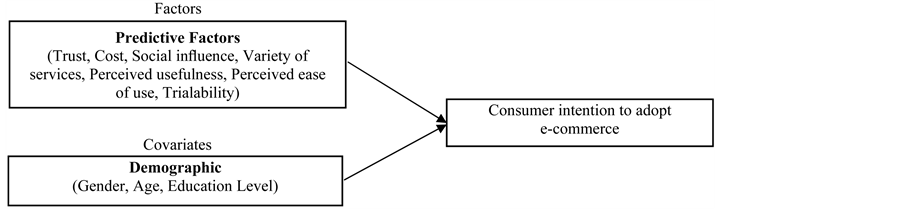
Figure 3. Research model.
3.2. Variable Measurement
Consistent with previous technology adoption studies, Wei et al. (2009) [69] , the independent and dependent variables used in this study are derived from the existing literature. 24 items were used to measure the 7 independent variables in this study, and 2 questions were used to measure the dependent variables. Besides the demographic profiles, all items were measured on a 5 point Likert Scale ranging from 1 (strong disagree) to 5 (strongly agree).
3.3. Scale Reliability and Factor Analysis
The reliability of the questionnaire was tested using Cronbach’s alpha. The reliability coefficients (α) for both data sets (e.g. Jakarta and Taipei) are shown in Table 4. The reliability coefficient (α) of all independent variables are above 0.70, thus based on Nunnally (1978) [71] , Hair et al. (2006) [72] , it confirms that the items used to measure the constructs are reliable.
In order to test the validity of the constructs, factor analysis is applied. The model consists of variables from TAM, as well as additional new variables that are catered towards e-commerce adoption. Furthermore, some of the items adapted were not studied in Jakarta and Taipei. Therefore, exploratory factor analysis is applied instead of confirmatory factor analysis. Principal component analysis is chosen to evaluate if the items are linked to their underlying factors. Table 5 shows the results of the factor analysis.
Factor loading of 0.50 was used as a cut-off point as suggested by Hair et al. (2006) [72] . Factors which have eigenvalues of less than one are considered insignificant and are therefore disregarded as suggested by Chong & Ooi (2008) [73] . Based on Table 5, all items have a factor loading of more than 0.50, thus confirming that these constructs are unidimensional and factorially distinct, and the items used to operationalize the constructs are all loaded onto a single factor as suggested by Teo (2001) [74] .
4. Result
4.1. Test of Normality
Normality of data was tested using Q-Q plot. There must be a normal distribution of the DV in the population. In the event that a distribution that is nonnormal (e.g. skewed or kurtotic) and sample sizes are small, p-values may be invalid.
From Figure 4 and Figure 5, all the dependent variables points in both cities in approximately lie on a line, thus ensuring that Y variable is normally distributed.
4.2. Test of Multicollinearity
Multicollinearity of data was tested using VIF and Tolerance. Table 6 shows that all the independent variables have VIF values of less than 10, and Tolerance values of more than 0.10, thus ensuring that the data did not suffer from multicollinearity. The dependent variable also has skewness and kurtosis values between −1.0 and +1.0, thus ensuring that the data used in the study is normally distributed.
4.3. Test of Homogeneity of Variance
To assess the equality of variances for a variable calculated for two or more groups, analysis Levene’s test is
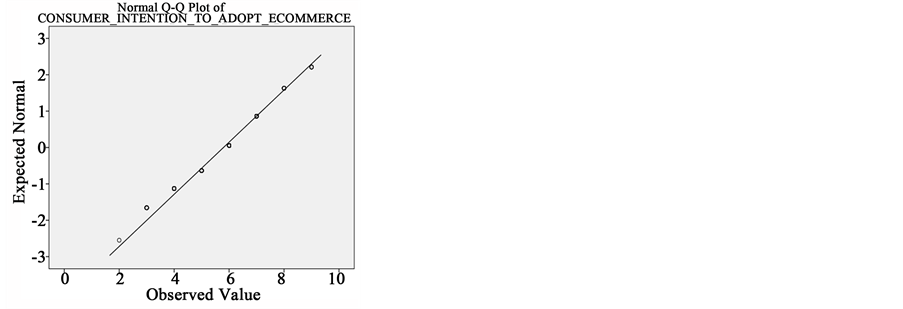
Figure 4. Jakarta Q-Q plot.
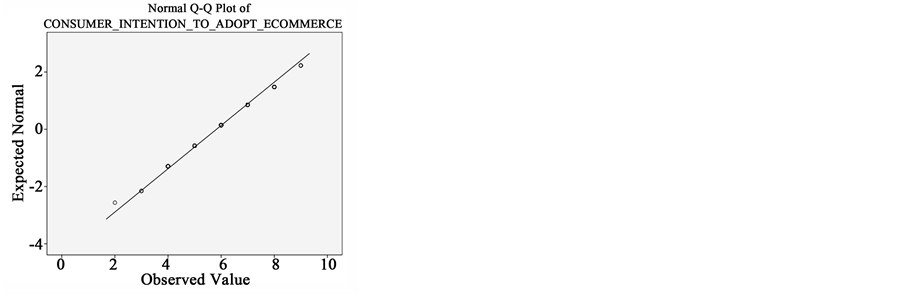
Figure 5. Taipei Q-Q plot.
Table 4. Reliability analysis.
Table 5. Factor analysis.
Table 6. Multicollinearity analysis.
used. Some common statistical procedures assume that variances of the populations from which different samples are drawn are equal. Levene’s test assesses this assumption. The variances of the Dependent variables must be equal for all levels of the independent variables and covariates. It tests the null hypothesis that the population variances are equal or homogeneity of variance or homoscedasticity. If the resulting P-value of Levene’s test is less than some significance level (typically 0.05), the obtained differences in sample variances are unlikely to have occurred based on random sampling from a population with equal variances. Thus, according to Jeyaraj et al. (2006) [75] the null hypothesis of equal variances is rejected and it is concluded that there is a difference between the variances in the population.
From Table 7, we can see that the sig. value for Jakarta is 0.041 and 0.000 for Taipei. Since those value less than 0.05, we assume that variances of the Dependent variables are equal for all levels of the independent variables and covariates.
4.4. Intercorrelation Matrix
An intercorrelation matrix for the demographic profiles of the consumers and the internet activities are presented in the next sections.
4.4.1. Intercorrelation Matrix for Jakarta Consumers
Based on Table 8, it is shown that age and educational level are positively correlated (r = 0.064). This implies that people who are older in this samples have higher educational levels. The results show that people with higher educational levels tend to use more e-commerce activities such as purchasing products and services (r = 0.087). An interesting result shows that those with lower educational levels tend to use e-commerce for checking or posting advertisements (r = −0.81). In terms of gender, males tend to use internet for e-banking (r =0.40), whereas females on the other hand, are more likely to use internet for Checking or posting advertisements (r = −0.90) and for purchasing products/service (r = −0.045). In terms of age, younger users are more likely to use e-commerce to check or post advertisements (r = −0.052) and entertainment purpose such as downloading ring tones, games and music (r = −0.057).
4.4.2. Intercorrelation Matrix for Taipei Consumers
Based on Table 9, similar to Jakarta consumer, Taipei consumers who are older have higher educational levels (r = 0.75). The result shows that consumers who are older are more likely to purchase products or services through e-commerce (r = 0.71), and are also more likely to use mobile banking (r = 0.54). In terms of educational level, those who have higher level of education are more likely to use location based services (r = 0.041) and purchasing products/services (r = 0.032) using e-commerce.
Table 7. Homogeneity of variance analysis.
Tests the null hypothesis that the error variance of the dependent variable is equal across groups. Design: Intercept + Trust + Cost + Social Influence + Variety of Services + Perceived Usefulness + Perceived Ease Of Use + Trialability + Sex + Age + Education.
Table 8. Intercorrelation matrix for Jakarta consumers.
Notes: *P < 0.05, **P < 0.01.
Table 9. Intercorrelations for Taipei consumers.
Notes: *P < 0.05, **P < 0.01.
5. Hypotheses Testing
Analysis of Variance (ANCOVA) was used to test the hypotheses in this research. The method is suitable as it allows examination of the effects of the control variables and the independent variables separately. Multicollinearity of data was tested using VIF and Tolerance. All the independent variables have VIF values of less than 10, and Tolerance values of more than 0.10, thus ensuring that the data did not suffer from multicollinearity. The dependent variable also has skewness and kurtosis values between −1.0 and +1.0, thus ensuring that the data used in the study is normally distributed.
Based on Table 10, demographic profiles such as gender, age, and education in both cities have no significant relationship since their sig.level are >0.05. In contrast, all of variables in this study have a significant relationship 70.1% of Jakarta consumers, and 88.2% of Taipei consumer to adopt e-commerce (as indicated by the adjusted R2 value). The result shows that demographic profiles do not affect either Jakarta or Taipei consumer decisions to adopt e-commerce.
Table 10. Tests of between-subjects effects.
Notes: *P < 0.05, **P < 0.01.
To make Indonesian consumer adopt the e-commerce, almost every factor matters to them including trust, cost, social influence, variety of services, perceived usefulness, and trialability. They have significant relationship in adoption decision of Jakarta consumers since they have sig. level <0.05, while Perceived ease of use has no significant relationship (0.766). It suggest that Jakarta consumers concern to all variables, but they have different concern in perceived ease of use which that variable is come from the original TAM model. Cost is the strongest variable that can influence consumer in adopting e-commerce which Partial Eta Squared value 0.363. It suggests that 36.3% of intention to adopt e-commerce is affected by cost. Perceived usefulness contributes 21.7% in adopting e-commerce since its Partial Eta Squared value is 0.217, therefore H1a, H2a, H3a, H4a, H5a and H7a are supported while H6a is rejected.
Similar to Jakarta consumers, cost and perceived usefulness have a significant relationship with intention to adopt e-commerce of Taipei consumers beside trust, social influence, and Perceived ease, while variety of services has no significant relationship. Therefore, H1b, H2b, and H3b, H5b, H6b, and H7b are supported while H4b are rejected.
6. Discussion
This study proposes an e-commerce adoption model that was tested in both Jakarta and Taipei. Sila (2013) [7] in his study on e-commerce adoption stated that future studies should test the effects of a wider range of factors and contextual variables on EC adoption. Our results indicate that either at Jakarta or Taipei, demographic profile does not have a significant impact on intentions to purchase goods or services online, both directly and through e-commerce beliefs. The results show that in Jakarta, Perceived ease of use has no significant rela- tionship to adopting e-commerce. This is a surprising finding as it is thought that new users are more open to new technologies. Similar result in both cities suggest that cost and Perceived usefulness are factors affecting the adoption of e-commerce in both cities, one explanation could be that users in both cities concern about the cost and benefit they gain.
In both Jakarta and Taipei, variety of services, and trialability have no significant relationships with consumer intention to adopt e-commerce. These two variables are derived from the TAM and DOI models. As stated by Jeyaraj et al. (2006) [75] , these variables are good predictors of IT usage in past studies. Although e-commerce is a relatively new business model in Indonesia, consumers are no strangers to online shopping model. However, perceived ease of use is not a significant factor for Jakarta consumers. As discussed earlier, there are 33.9% internet user of about 240 Million Indonesia Population, and there are currently 80% internet user of about 23 Million Taipei Population. Consumers from these two countries are familiar with internet, and are quite comfortable interacting with e-commerce. As such, whether the technology is easy to use will not influence their adoption decision. These users also have a good understanding of what e-commerce can offer, and thus will not be attracted to use e-commerce based on the perceived usefulness or being given free trials.
This research found that social factors such as trust and social influence play a significant role in e-commerce adoption by both Jakarta and Taipei consumers. The result shows that when it comes to trust, both Jakarta and Taipei users are generally concerned about the security and privacy offered by e-commerce, and do not trust transactions that lack physical contact. This is consistent with suggestions by Slyke et al. (2010) [20] , Wang & Benbasat (2008) [26] that trust has emerged as an important issue in online environments, it seems that Jakarta and Taipei consumers are less likely to take risks. E-commerce is a relatively new technology especially in Jakarta, and therefore more efforts are needed to increase consumers’ trust, which will increase e-commerce adoption.
Social influence is also a significant relationship to Jakarta and Taipei consumer intention to adopt e-commerce. This finding is interesting as it suggests that consumers are far more likely to be influenced by trends, mass media, and peers when it comes to using e-commerce. Two variable which are different between Jakarta and Taipei consumers are variety of services and perceived ease of use. Taipei consumers are more likely to use e-commerce if there are more services, while for Jakarta consumers, this is not their main concern. This finding is interesting as it suggests that Taipei users are not satisfied with the services and applications available to them, and increasing services and applications will attract them to adopt e-commerce. In Jakarta, consumers seem to be content with the current number of e-commerce services available to them. Perceived ease of use is not a significant factor for Jakarta consumer, it is considering that e-commerce is a new thing for consumers Jakarta than in Taipei.
There are several limitations in this study. Firstly, the study is restricted to comparing Jakarta and Taipei consumers. Future studies can extend this scope to include consumers from other countries. A comparison between various developing and developed countries will improve the generality of the model. Secondly, as e-commerce is relatively new in Indonesia, this study has the intention of measuring e-commerce adoption. Future studies can consider measuring the diffusion of e-commerce across time, and investigate if the adoption factors change at various stages of consumer diffusion of e-commerce. Lastly, there is a possibility that additional adoption factors have not been included in this model, such as self efficacy and perceived enjoyment for example, and these can be included in future research models.
7. Conclusion and Implications
This research investigates the factors that can influence the adoption of e-commerce among Jakarta and Taipei consumers. The results suggest that one of variables in TAM which is perceived ease of use is not able to predict e-commerce adoption decisions of Jakarta consumer. Instead, factors such as trust, cost, social influence, and perceived usefulness have a significant relationship with consumer decisions to adopt e-commerce in both cities.
This study offers several implications. Firstly, this is one of the few studies to offer a comparative study in e-commerce adoption in two internet using growing regions. Instead of comparing developed and developing regions as in most existing studies, this study focuses on developing regions where internet and infrastructure are quite different in advanced and the e-commerce adoption keeps growing in both regions. Unlike developed regions such as Chinese Taipei, developing countries’ e-commerce industries like Indonesia are in a different situation especially in infrastructure. The result allows enabling telecommunication and online companies to develop strategies that are appropriate to consumers from developing regions.
Secondly, the research extends the traditional TAM and DOI model, and includes new variables such as trust, social influence, variety of services, and cost to influence consumer decisions to adopt e-commerce. The results show that traditional variables found in TAM and DOI are not sufficient to predict e-commerce adoption. Instead, e-commerce developers should focus on cultural elements such as trust and social influence when targeting Jakarta and Taipei consumers. Various strategies are also needed to improve consumer trust in e-commerce. E-commerce providers should improve the security and privacy features of their systems. Online companies should also change the perceptions of their consumers by emphasizing the safety features offered by their applications. This can involve marketing campaigns to educate consumers, or in creating awareness among them. The platform for on-line purchasing and payment should be user-friendly. In addition, prompt delivery should be affected once an order is made, and after-sales services should also be friendly.
Thirdly, the study shows that variety of services has no significant influence to Taipei consumers in adopting e-commerce. It is likely that for Taipei consumers, they are willing to pay for e-commerce, given the current of variety of services. It is contrary to Jakarta consumers, therefore e-commerce providers should do more efforts by offering a greater variety of applications and services. Fourthly, the result shows that both Jakarta and Taipei consumers are price conscious when it comes to e-commerce. Service providers should therefore develop creative promotional and pricing strategies (e.g. cost reduction) to attract price-conscious customers.
Lastly, the results also show that demographic profiles of users in general, are not good predictors of e- commerce adoptions. This research has contributed to the existing literature by including different demographic variables together with the adoption factors to predict e-commerce adoption in Jakarta and Taipei. The result shows very similar findings in terms of consumers from both Jakarta and Taipei.
In conclusion, we want to emphasize that rapid growth of the market share of e-commerce in Indonesia is beyond a reasonable doubt. With the number of Internet users reached 88.1 million people or about 35% of the total population in 2014, Indonesia e-commerce market was a very tempting gold mine for some people who could see the potential in the future. This growth is supported by the e-commerce transaction value also continues to increase.
Cite this paper
BenChang Shia,MingchihChen,Agus DavidRamdansyah,ShuyanWang, (2015) Comparison of Decision Making in Adopting E-Commerce between Indonesia and Chinese Taipei (Case Study in Jakarta and Taipei City). American Journal of Industrial and Business Management,05,748-768. doi: 10.4236/ajibm.2015.512073
References
- 1. Liao, C.C., To, P.-L. and Shih, M.-L. (2006) Website Practices: A Comparison between the Top 1000 Companies in the US and Taiwan. International Journal of Information Management, 26, 196-211.
http://dx.doi.org/10.1016/j.ijinfomgt.2006.02.007 - 2. Maity, M. and Dass, M. (2014) Consumer Decision-Making across Modern and Traditional Channels: E-Commerce, M-Commerce, In-Store. Decision Support Systems, 61, 34-46.
http://dx.doi.org/10.1016/j.dss.2014.01.008 - 3. Zamri, N.B. and Idris, I. (2013) The Effects of Attitude, Social Influences and Perceived Behavioral Control on Intention to Purchase Online Shopping Apparels in Malaysia: Case Study on Zalora. 3rd International Conference on Management, Penang, 10-11 June 2013, 137.
- 4. Lignell, A. (2014) Older Consumers’ Adoption of Online Shopping. Master’s Thesis, Lappeenranta University of Technology, School of Business, International Marketing Management, Lappeenranta, 15.
- 5. Helgueros, Y. (2012) E-Business Models as a Tool to Increase México Small and Medium Size Enterprises’ Sales. Global Journal of Business Research, 6, 119-126.
- 6. Mahadevan, B. (2000) Business Models for Internet-Based E-Commerce: An Anatomy. California Management Review, 42, 55-69.
http://dx.doi.org/10.2307/41166053 - 7. Sila, I. (2013) Factors Affecting the Adoption of B2B E-Commerce Technologies. Electronic Commerce Research, 13, 199-236.
http://dx.doi.org/10.1007/s10660-013-9110-7 - 8. Namyslowska, M. (2013) To B2C or Not to B2C. Some Reflections on the Regulation of Unfair Commercial Practices from a Polish Perspective. Journal of Consumer Policy, 36, 329-342.
http://dx.doi.org/10.1007/s10603-013-9229-x - 9. Leonard, L.N.K. (2012) Attitude Influencers in C2C E-Commerce: Buying and Selling. Journal of Computer Information Systems, 52, 11-17.
- 10. Sekulovska, M. (2012) Business Models for E-Insurance and Conditions in Republic of Macedonia. Procedia—Social and Behavioral Sciences, 44, 163-168.
http://dx.doi.org/10.1016/j.sbspro.2012.05.016 - 11. Darwis, Y. (2013) Communication Media (E-Commerce) as a Supporting Factor in Indonesia’s Fashion Industry in the International Business Competition. The International Journal of Organizational Innovation, 5, 206-220.
- 12. Medyawati, H., Kuspriatni, L., Sugiarti, R. and, Yunanto, M. (2014) Quality of Website Services at Government Banks, National Private Banks and Local Government Banks in Indonesia: Customer Perspective Approach. Journal of Internet Banking and Commerce, 19, 3.
- 13. Chien, S.-H., Chen, Y.-H. and Hsu, C.-Y. (2012) Exploring the Impact of Trust and Relational Embeddedness in E-Marketplaces: An Empirical Study in Taiwan. Industrial Marketing Management, 41, 460-468.
http://dx.doi.org/10.1016/j.indmarman.2011.05.001 - 14. Tsai, Y.-C. and Cheng, Y.-T. (2012) Analyzing Key Performance Indicators (KPIs) for E-Commerce and Internet Marketing of Elderly Products: A Review. Archives of Gerontology and Geriatrics, 55, 126-132.
http://dx.doi.org/10.1016/j.archger.2011.05.024 - 15. Wu, J.-J. (2004) Influence of Market Orientation and Strategy on Travelindustry Performance: An Empirical Study of E-Commerce in Taiwan. Tourism Management, 25, 357-365.
http://dx.doi.org/10.1016/S0261-5177(03)00144-4 - 16. Ramanathan, R., Ramanathan, U. and Hsiao, H.-L. (2012) The Impact of E-Commerce on Taiwanese SMEs: Marketing and Operations Effects. International Journal of Production Economics, 140, 934-943.
http://dx.doi.org/10.1016/j.ijpe.2012.07.017 - 17. Huang, L. (2006) Building up a B2B E-Commerce Strategic Alliance Model under an Uncertain Environment for Taiwan’s Travel Agencies. Tourism Management, 27, 1308-1320.
http://dx.doi.org/10.1016/j.tourman.2005.06.005 - 18. Kim, D.J., Ferrin, D.L. and Rao, H.R. (2008) A Trust-Based Consumer Decision-Making Model in Electronic Commerce: The Role of Trust, Perceived Risk, and Their Antecedents. Decision Support Systems, 44, 544-564.
http://dx.doi.org/10.1016/j.dss.2007.07.001 - 19. Susanto, A. and Zo, H. (2011) Factors Influencing Users’ Acceptance in Internet Banking Success: Proposing a Unified Model. 2nd International Conference on Networking and Information Technology IPCSIT, 17, 44-51.
- 20. Van Slyke, C., Lou, H., Belanger, F. and Sridhar, V. (2010) The Influence of Culture on Consumer-Oriented Electronic Commerce Adoption. Journal of Electronic Commerce Research, 11, 30-40.
- 21. Eid, M.I. (2011) Determinants of E Commerce Customer Satisfaction, Trust, and Loyalty in Saudi Arabia. Journal of Electronic Commerce Research, 12, 78-93.
- 22. Muhammad, M.R. and Muhammad, M. (2013) Building Trust in E-Commerce: A Proposed Shari’ah Compliant Model. Journal of Internet Banking and Commerce, 18, 1-13.
- 23. Pennanen, K. (2011) Is Interpersonal and Institutional E-Trustworthiness Equally Important in Consumer E-Trust Development? Implications for Consumers’ E-Trust Building Behaviours. Journal of Consumer Behaviour, 10, 233-244.
http://dx.doi.org/10.1002/cb.322 - 24. Seer, L., Berács, J. and Pop, M.D. (2012) The Possible Causes of Low E-Commerce Adoption in Romania- Conceptualization of Trust Effect with Regard to Low Level of Technology Acceptance. 5th International Conference “Marketing—From Information to Decision”, Cluj-Napoca, 441-454.
- 25. Abyad, A. (2011) Consumer Trust in E-Commerce. Middle East Journal of Business, 6, 3-6.
http://dx.doi.org/10.5742/MEJB.2011.63068 - 26. Wang, W.Q. and Benbasat, I. (2008) Attributions of Trust in Decision Support Technologies: A Study of Recommendation Agents for E-Commerce. Journal of Management Information Systems, 24, 249-273.
http://dx.doi.org/10.2753/MIS0742-1222240410 - 27. Zhang, Y., Bian, J. and Zhu, W.X. (2013) Trust Fraud: A Crucial Challenge for China’s E-Commerce Market. Electronic Commerce Research and Applications, 12, 299-308.
http://dx.doi.org/10.1016/j.elerap.2012.11.005 - 28. Koh, T.K., Fichman, M. and Kraut, R.E. (2012) Trust across Borders: Buyer-Supplier Trust in Global Business-to-Business E-Commerce. Journal of the Association for Information Systems, 13, 886-922.
- 29. Kim, D.M. and BenbaSat, I. (2009) Trust-Assuring Arguments in B2CE-Commerce: Impact of Content, Source, and Price on Trust. Journal of Management Information Systems, 26, 175-206.
http://dx.doi.org/10.2753/MIS0742-1222260306 - 30. Kikovska-Georgievska, S. (2013) E-Commerce-Challenge for Sustainable Development of Companies. Journal of Sustainable Development, 4, 71.
- 31. Li, P.X. and Xie, W. (2012) A Strategic Framework for Determining E-Commerce Adoption. Journal of Technology Management in China, 7, 22-35.
http://dx.doi.org/10.1108/17468771211207321 - 32. Alam, S.S., Ali, M.Y. and Jani, M.F.M. (2011) An Empirical Study of Factors Affecting Electronic Commerce Adoption among SMEs in Malaysia. Journal of Business Economics and Management, 12, 375-399.
http://dx.doi.org/10.3846/16111699.2011.576749 - 33. Koch, H. and Schultze, U. (2011) Stuck in the Conflicted Middle: A Rolet Heoretic Perspective on B2B E-Market-places. MIS Quarterly, 35, 123-146.
- 34. Galbreth, M.R., March, S.T., Scudder, G.D. and Shor, M. (2005) A Game-Theoretic Model of E-Marketplace Participation Growth. Journal of Management Information Systems, 22, 295-319.
- 35. Brush, T.H., Dangol, R. and O’brien, J.P. (2012) Customer Capabilities, Switching Costs, and Bank Performance. Strategic Management Journal, 33, 1499-1515.
http://dx.doi.org/10.1002/smj.1990 - 36. Chen, C.-P. (2012) Online Group Buying Behavior in CC2B E-Commerce: Understanding Consumer Motivations. Journal of Internet Commerce, 11, 254-270.
http://dx.doi.org/10.1080/15332861.2012.729465 - 37. di Angelo, L. and di Stefano, P. (2010) Parametric Cost Analysis for Web-Based E-Commerce of Layer Manufactured Objects. International Journal of Production Research, 48, 2127-2140.
http://dx.doi.org/10.1080/00207540802183653 - 38. Cohen, S. and Kallirroi, G. (2006) E-Commerce Investments from an SME Perspective: Costs, Benefits and Processes. Electronic Journal of Information Systems Evaluation, 9, 45-46.
- 39. VanderMeer, D., Dutta, K. and Datta, A. (2012) A Cost-Based Database Request DistributionTechnique for Online E-Commerce Applications. MIS Quarterly, 36, 479-507.
- 40. Fuentes-Blasco, M., Saura, I.-G., Berenguer-Contri, G. and Velazquez, B.M. (2010) Measuring the Antecedents of E-Loyalty and the Effect of Switching. The Service Industries Journal, 30, 1837-1852.
http://dx.doi.org/10.1080/02642060802626774 - 41. Mahadeo, J.D. (2009) Towards an Understanding of the Factors Influencing the Acceptance and Diffusion of E-Government Services. Electronic Journal of e-Government, 7, 391-402.
- 42. Silverman, B.G., Bachann, M. and Akharas, K.A. (2001) Implications of Buyer Decision Theory for Design of Ecommerce Websites. International Journal of Human-Computer Studies, 55, 815-844.
http://dx.doi.org/10.1006/ijhc.2001.0500 - 43. Ratten, V. (2010) Social Cognitive Theory and the Adoption of E-Book Devices. International Journal of e-Business Management, 4, 3-16.
- 44. Shin, D.-H. (2013) User Experience in Social Commerce: In Friends We Trust. Behaviour & Information Technology, 32, 52-67.
http://dx.doi.org/10.1080/0144929X.2012.692167 - 45. Mazman, S.G., Usluel, Y.K. and Çevik, V. (2009) Social Influence in the Adoption Process and Usage of Innovation: Gender Differences. World Academy of Science, Engineering and Technology, 3, 31-34.
- 46. Narwal, M. and Kant, R. (2014) Role of E-Commerce in Consumer Decision Making. International Journal Of Research in Business Management, 2, 77-88.
- 47. Rao, A.S. and Rao, V.G. (2013) Service Quality in E-Commerce and Strategic Advantage: An Empirical Assessment. The IUP Journal of Business Strategy, 10, 50-66.
- 48. Klinger, M.B. (2003) Managing Risk in E-Business Initiatives. EBS Review.
- 49. Lantz, B. and Hjort, K. (2013) Real E-Customer Behavioural Responses to Free Delivery and Free Returns. Electronic Commerce Research, 13, 183-198.
http://dx.doi.org/10.1007/s10660-013-9125-0 - 50. Ekeledo, I. and Sivakumar, K. (2004) The Impact of E-Commerce on Entry-Mode Strategies of Service Firms: A Conceptual Framework and Research Propositions. Journal of International Marketing, 12, 46-70.
http://dx.doi.org/10.1509/jimk.12.4.46.53212 - 51. Etzion, H. and Pang, M.-S. (2014) Complementary Online Services in Competitive Markets: Maintaining Profitability in the Presence of Network Effects. MIS Quarterly, 38, 231-248.
- 52. Turel, O., Yuan, Y. and Connelly, C.E. (2008) In Justice We Trust: Predicting User Acceptance of E-Customer Services. Journal of Management Information Systems, 24, 123-151.
http://dx.doi.org/10.2753/MIS0742-1222240405 - 53. Davis, F.D. (1989) Perceived Usefulness, Perceived Ease of Use, and User Acceptance of Information Technology. MIS Quarterly, 13, 319-340.
http://dx.doi.org/10.2307/249008 - 54. Luo, S.-F. and Lee, T.-Z. (2011) The Influence of Trust and Usefulness on Customer Perceptions of E-Service Quality. Social Behavior and Personality, 39, 825-837.
http://dx.doi.org/10.2224/sbp.2011.39.6.825 - 55. Brown, I. and Jayakody, R. (2009) B2C E-Commerce Success: A Test and Validation of a Revised Conceptual Model. The Electronic Journal Information Systems Evaluation, 12, 129-148.
- 56. Yen, Y.-R. and Tsai, B.-Y. (2011) Exploring the Influential Factors toward the Continuance Intention of On-Line Books Purchase. The International Journal of Organizational Innovation, 3, 140-157.
- 57. Hernandez-Ortega, B. and Jimenez-Martinez, J. (2013) Performance of E-Invoicing in Spanish Firms. Information Systems and e-Business Management, 11, 457-480.
http://dx.doi.org/10.1007/s10257-012-0203-y - 58. Lim, K.-S., Lim, J.-S. and Heinrichs, J.H. (2008) Testing an Integrated Model of E-Shopping Web Site Usage. Journal of Internet Commerce, 7, 291-312.
http://dx.doi.org/10.1080/15332860802250336 - 59. Wang, Y.-S. (2008) Assessing E-Commerce Systems Success: A Respecification and Validation of the DeLone and McLean Model of IS Success. Information Systems Journal, 18, 529-557.
http://dx.doi.org/10.1111/j.1365-2575.2007.00268.x - 60. Hsu, C.L. and Lu, H.P. (2004) Why Do People Play On-Line Games? An Extended TAM with Social Influences and Flow Experience. Information Management, 41, 853-868.
http://dx.doi.org/10.1016/j.im.2003.08.014 - 61. Chong, A.Y.L., Darmawan, N., Ooi, K.B. and Lin, B. (2010) Adoption of 3G Services among Malaysian Consumers: An Empirical Analysis. International Journal of Mobile Communications, 8, 129-149.
http://dx.doi.org/10.1504/IJMC.2010.031444 - 62. Lederer, A.L., Maupin, D.J., Sena, M.P. and Zhuang, Y. (2000) The Technology Acceptance Model and the World Wide Web. Decision Support Systems, 29, 269-282.
http://dx.doi.org/10.1016/S0167-9236(00)00076-2 - 63. Cheng, T., Lam, D.Y.C. and Yeung, A.C.L. (2006) Adoption of Internet Banking: An Empirical Study in Hong Kong. Decision Support Systems, 42, 1558-1572.
http://dx.doi.org/10.1016/j.dss.2006.01.002 - 64. Lee, Y.-H., Hsieh, Y.-C. and Hsu, C.-N. (2011) Adding Innovation Diffusion Theory to the Technology Acceptance Model: Supporting Employees’ Intentions to Use E-Learning Systems. International Forum of Educational Technology & Society (IFETS), 14, 124-137.
- 65. Stewart, T. (2012) Editorial. Behaviour & Information Technology, 31, 811-813.
http://dx.doi.org/10.1080/0144929X.2012.716254 - 66. Tan, M. and Teo, T.S.H. (2000) Factors Influencing the Adoption of Internet Banking. Journal of the Association for Information Systems, 1, 1-44.
- 67. Brown, I., Cajee, Z., Davies, D. and Stroebel, S. (2003) Cell Phone Banking: Predictors of Adoption in South Africa—An Exploratory Study. International Journal of Information Management, 23, 381-394.
http://dx.doi.org/10.1016/S0268-4012(03)00065-3 - 68. Murphy, E. (2005) Issues in the Adoption of Broadband-Enabled Learning. British Journal of Educational Technology, 36, 525-536.
http://dx.doi.org/10.1111/j.1467-8535.2005.00490.x - 69. Wei, T.T., Marthandan, G., Chong, A.Y.L., Ooi, K.B. and Arumugam, S. (2009) What Drives Malaysian M-Commerce Adoption? An Empirical Analysis. Industrial Management & Data Systems, 109, 370-388.
http://dx.doi.org/10.1108/02635570910939399 - 70. Dai, H. and Palvia, P. (2008) Factors Affecting Mobile Commerce Adoption: A Cross-Cultural Study in China and the United States. The DATA BASE for Advances in Information Systems, 40, 43-61.
http://dx.doi.org/10.1145/1644953.1644958 - 71. Nunnally, J. (1978) Psychometric Theory. McGraw-Hill, NewYork.
- 72. Hair, J., Black, W., Babin, B., Anderson, R. and Tatham, R. (2006) Multivariate Data Analysis. Prentice Hall, Upper Saddle River.
- 73. Chong, A.Y.L. and Ooi, K.B. (2008) Adoption of Interorganizational System Standards in Supply Chains: An Empirical Analysis of RosettaNet Standards. Industrial Management & Data Systems, 108, 529-547.
http://dx.doi.org/10.1108/02635570810868371 - 74. Teo, T.S.H. (2001) Demographic and Motivation Variables Associated with Internet Usage Activities. Internet Research, 11, 125-137.
http://dx.doi.org/10.1108/10662240110695089 - 75. Jeyaraj, A., Rottman, J.W. and Lacity, M.C. (2006) A Review of the Predictors, Linkages, and Biases in IT Innovation Adoption Research. Journal of Information Technology, 21, 1-23.
http://dx.doi.org/10.1057/palgrave.jit.2000056