American Journal of Industrial and Business Management
Vol.4 No.9(2014), Article ID:49707,8 pages
DOI:10.4236/ajibm.2014.49053
Comparison of Alberta Industrial and Pipeline Projects and US Projects Performance
Elias Ikpe, Jatinder Kumar, George Jergeas
Department of Civil Engineering, University of Calgary, Alberta, Canada
Email: eliasikpe@yahoo.com, Jksingla76@gmail.com, jergeas@ucalgary.ca
Copyright © 2014 by authors and Scientific Research Publishing Inc.
This work is licensed under the Creative Commons Attribution International License (CC BY).
http://creativecommons.org/licenses/by/4.0/


Received 2 July 2014; revised 1 August 2014; accepted 2 September 2014
Abstract
Project performance issues are major concerns in Alberta. This paper compares the projects executed in Alberta and US projects. The paper analyses the projects performance in Alberta and compares it with US projects with a view to improve project performance in Alberta. 17 participating companies in Alberta provided the previous projects data and COAA/CII database provided the US data for the analysis. A qualitative research methodology was also employed in investigating the Alberta project performance. Interviews were conducted with industry practitioners, which contained open-ended questions. The research found that in comparison, the Alberta projects showed higher average cost and schedule growth than the US projects and the US based projects were more productive in erecting structural steel than Alberta projects. This method has the potential to contribute to a reduction in cost and schedule overruns, and improves project performance. It is concluded that comparison of projects executed in Alberta and US projects can provide a guide to companies to improve performance in Alberta.
Keywords: Alberta and US Projects, Comparison, Performance and Improvement, Schedule, Cost and Performance

1. Introduction
Alberta industrial and pipeline projects are divided into five types, which include upstream and downstream oil and gas, natural gas, pipeline and well site projects. The benchmarking of these projects in Alberta began in 2006, and 1993 in US for performance improvement [1] . This paper discusses the benchmarking system, COAA benchmarking program, project performance and productivity metrics and data miner. It also presents the statistical techniques used to analyze projects residing in the COAA/CII databases and compares cost, schedule growth and construction structural steel productivity in the Alberta projects and US projects.
The paper further examines project performance from cost, schedule and construction productivity metrics, concerning the execution of capital projects in Alberta and US projects. The use of these metrics is necessary to compare project data collected in Alberta and by CII in the US In the comparison, projects executed in Alberta have significantly higher average cost and schedule growth than US projects. The construction structural steel productivity comparison shows that the US based projects are more productive in erecting structural steel than the Alberta projects. The paper provides new insights to the results of projects executed in Alberta and the US projects performance.
2. Background
Construction industry contributes significantly to Alberta economy and employs more than 300,000 people [2] . The sector is made up of 26,400 businesses that together generate annual revenues of $78 billion and comprised 10.0% of Alberta’s gross domestic product (GDP) in 2012 [3] . The Alberta oil which is part of the industry production is projected to triple to 3 million of barrels a day by 2015 [4] . However, this dramatic amount of growth has also brought its challenges. Increasing pressures on capital projects have been created due to significant worldwide cost escalations and labour shortages. This has led to the creation of many perceptions regarding the potential loss of productivity or excessive indirect costs and cost overruns. [5] identified complexity associated with the delivery of construction projects in the oil and gas sector in Alberta as due to geographic location, weather condition, size of projects and contractual arrangement. Using benchmarking system for improving project performance can reduce the cost overruns.
Benchmarking is regarded as one of the simplest tools for effective performance improvement [6] . It is defined as the continuous and systematic process of measuring performance [7] . In addition, it is primarily used at the project level to help participants identify gaps in their work processes [8] . Furthermore, it provides sets of external comparisons to its peer group that can be used to establish improvement goals and objectively understand what “best in class” performance means [9] . However, reluctance to benchmarking impedes growth, knowledge transfer, cost effective solutions and use of knowledge to improve process performance [10] . Benchmarking will be successful to improve project performance if consistent methods of measuring performance are developed and used [9] .
2.1. COAA Benchmarking Program
The COAA benchmarking program began in 2006 with CII to explore the performance and productivity concerning the execution of capital projects in Alberta, which is known as phase 1 research. Following the completion of phase 1 of the Benchmarking system in 2009, COAA analyzed the results of the benchmarking activities and determined that there was a need to expand performance measurements tailored to projects in Alberta. As a result, COAA embarked on phase 2 developments in 2010 to expand and extend the system and enhanced data analysis for a better performance. The U of C team was invited to conduct research into specific areas of the benchmarking system with the goal of identifying enhancements, additions and modification to add value for users of the benchmarking system to improve project performance.
2.2. COAA Project Performance and Productivity Metrics
This section introduces the metrics used in this research, provides an explanation of interpretation of data miner and overview of statistical terms used in conducting the analyses. The use of these metrics was necessary to ensure the compatibility of comparisons between project data collected in Alberta and by CII in the US.
2.3. Project Performance Metrics
Project cost and schedule performance metrics evaluate the amount of variation from planned cost and schedule estimates at sanction [1] . Known as phase cost and schedule factors, these metrics portray the proportion of total project time and money expended during each phase of the project. Formula used for cost and schedule project performance metrics is shown in Table 1 below.

2.4. Construction Productivity Metrics
Construction Productivity metrics are defined by CII as actual direct work hours required to install a unit quantity and are captured for significant work activities for the following disciplines: Concrete, Structural Steel, Piping, Electrical, Instrumentation, Equipment, Module installation, Insulation, Scaffolding. This calculation can be seen in Equation (1) [1] .
 (1)
(1)
2.5. Data Miner
The COAA/CII data miner in Figure 1 is a user-defined format. The user starts by selecting a primary metric of interest and a quartile chart appears in color and participants compare their projects both with other similar projects in the same region (i.e. Alberta), and also similar projects in other regions. This was done to compare COAA projects to projects in other countries/regions and to promote cross learning. This chart includes all projects in the combined COAA and CII database containing the specific metric. Then, the user can begin a process of “filtering” the comparison cohort.
3. Research Methodology
Qualitative methodology is considered to be the most appropriate strategy in the context of this study for collecting data on Alberta capital project performance. [11] described the qualitative research approach as an enquiry process of comprehending a social or human problem phenomenon based on building a complex holistic picture formed with words, reporting detailed views of informants and conducted in a natural setting. [12] -[15] further described qualitative methodology as explanatory in nature with the principal aim of trying to unearth answers to how and why Questions. The method can be used to better understand and gain new perspectives on projects executed in Alberta and compare it to the US projects in the CII/COAA database. The quantitative approach was not adopted because it would not be sufficient in this case with limited number of oil and gas projects in Alberta.
3.1. Data Collection
Data were collected from the COAA/CII database for analysis. In the COAA database, 17 industry partners entered and completed 59 projects from 73 initiated projects while CII database has over 1317 projects. The data concerning cost, schedule, and construction productivity on the 59 projects in the COAA data base and over 1317 projects in the CII database were used. In addition, semi-structured interviews were conducted on Alberta projects. Interviews were conducted with 17 (seventeen) benchmarking managers, benchmarking associates, estimators, project control analysts, engineers. The interview was structured, open-ended, and was conducted face to face with experts in the construction industry and oil and gas fields.
3.2. Research Findings
This section presents statistical techniques and used Box and whisker plots, to analyze projects residing in the COAA/CII databases. The box and whisker plots also incorporate a variety of test statistics including analysis of variance (ANOVA) techniques, depending on the number of comparison groups and distribution of sample variances [16] . Figure 2 provides an example of a Box and Whisker plot and associated terminology.
Mean refers to the arithmetic average of a set of values, which is the sum of the variable value divided by the number of samples.

Figure 1. Screenshot of COAA data miner. Source: COAA (2009).
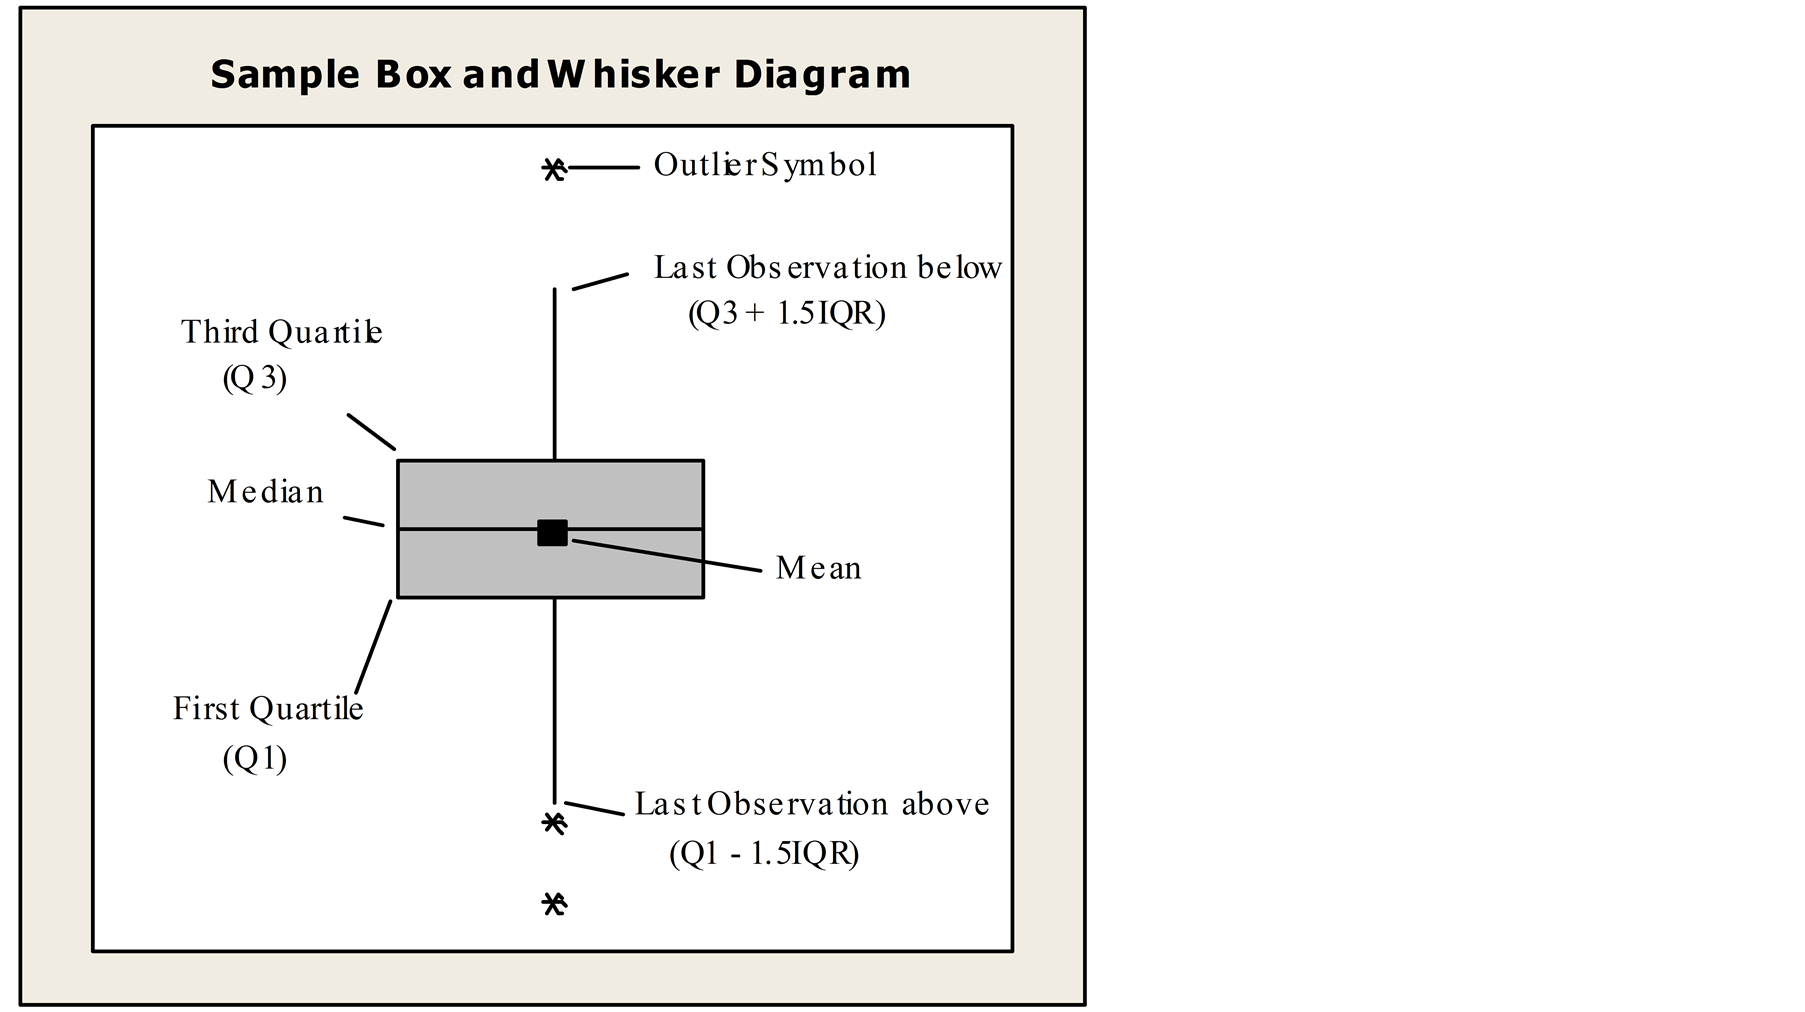
Figure 2. Whisker box diagram. Source: COAA (2009).
Median is the number separating the higher half of a sample from the lower half. Median is equivalent to the second quartile (Q2).
First Quartile (Q1) is also called as the 25th percentile or lower quartile, which refers to the threshold below which 25% of the samples have observed value(s).
Third Quartile (Q3) indicates the 75th percentile and delineates the highest 25% of data.
Interquartile Range (IQR) refers to the range between the first quartile and the third quartile.
Correlation (r) measures the strength of the linear relationship between variables (metrics) ranging from −1 to 1. The magnitude close to −1 and to +1 indicates that a strong negative or positive relationship is observed between the two variables. In this study, r < 0.3 is defined as low correlation, between 0.3 and 0.5 is considered to have a moderate amount of correlation, while r > 0.5 is considered to have a high degree of correlation.
The Coefficient of Determination (R2) is the most frequently quoted measure representing the goodness of linear fit of the least square regression line. R2 can be interpreted as the percentage of variation of the response variable explained by the regression line with the independent variable as the only explanatory variable. The better fit the line possesses, the closer R2 should be to 1.
Significant Value (p) is defined as the probability of making a decision to reject the null hypothesis when the null hypothesis is actually true. Usually, social science research accepts any probability value below 0.05 as being statistically meaningful. Consequently, any probability value below 0.05 is regarded as indicative of genuine effect [15] .
3.3. Comparison of Schedule Growth US & Alberta
Figure 3 below compares the project schedule growth in US and projects executed in Alberta. Results show higher average schedule growth for the Alberta projects than US. On average, Alberta projects experienced 12.1% project schedule growth, while US projects experienced 5.7% schedule growth, respectively.
Alberta projects schedule growth varies from −33% to 58% while US projects schedule growth varies from −22% to 37%. So Alberta projects have wider variation than US projects.
3.4. Comparison of Cost Growth US & Alberta
Figure 4 compares the project cost growth in US and projects executed in Alberta. Results show significantly higher average cost growth for the Alberta projects than US. On average, Alberta projects experienced 6.3% project cost growth, while US projects experienced 0.7% cost growth, respectively.

Figure 3. Schedule growth comparison between US & Alberta (p = 0.078).
Alberta projects cost growth varies from −40% to 48% while US projects cost growth varies from −35% to 30%. So Alberta projects have wider variation than US projects.
3.5. Construction Structural Steel Productivity Comparison between US & Alberta
Figure 5 compares the construction structural steel productivity in US and projects executed in Alberta. Results show that US-based projects are more productive in erecting structural steel than Alberta projects are (47.32 WH/MT versus 55.21 WH/MT).
US projects construction structural steel productivity varies from 10% to 98% while Alberta projects construction structural steel productivity varies from 5% to 95%. So US projects have wider variation than Alberta projects.
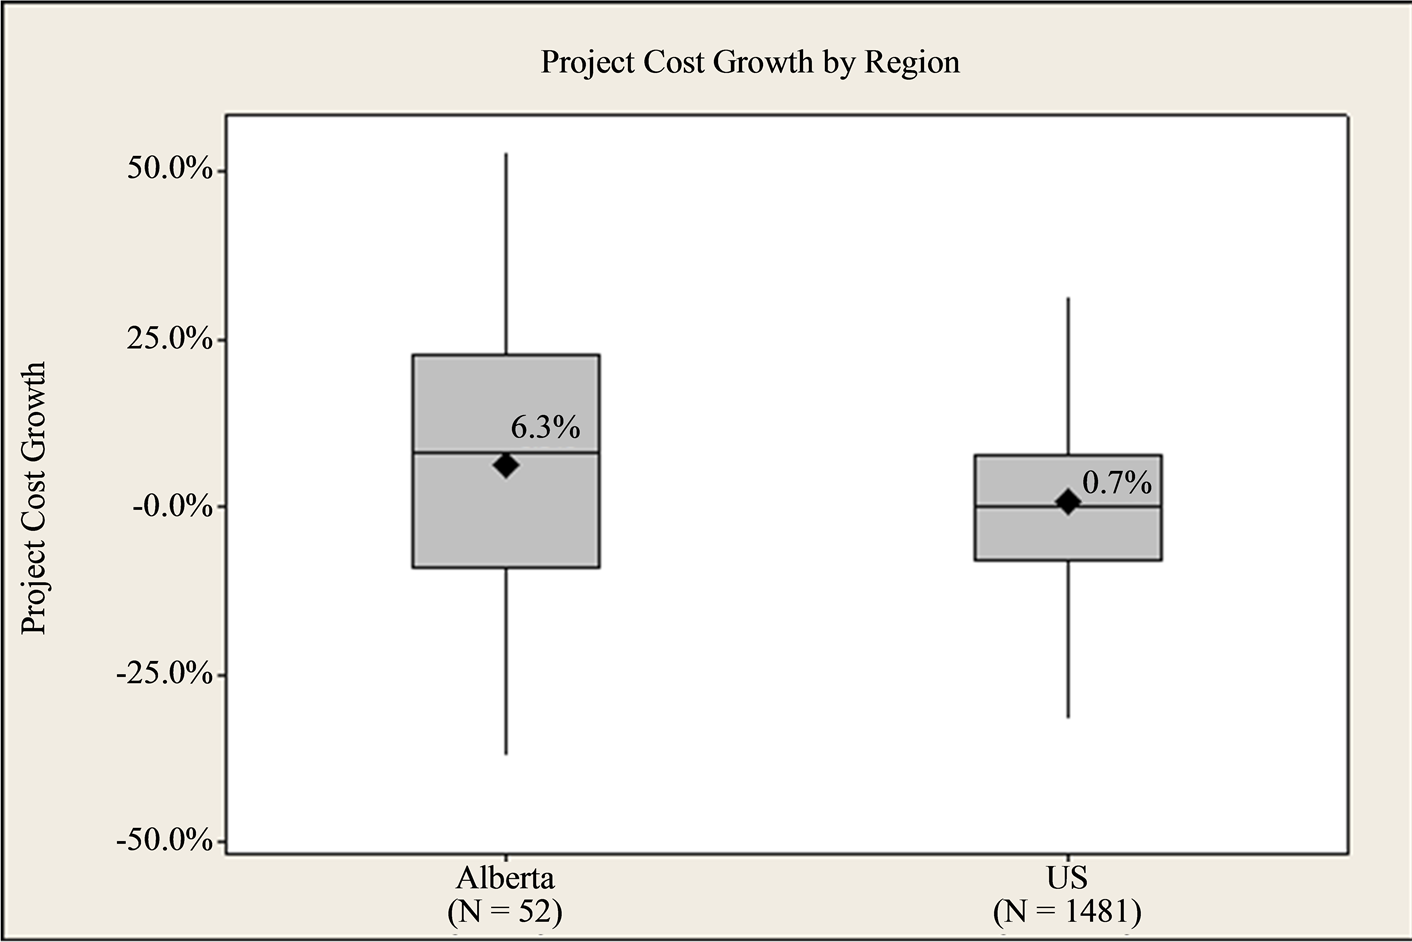
Figure 4. Cost growth comparison between US & Alberta (p = 0.043).
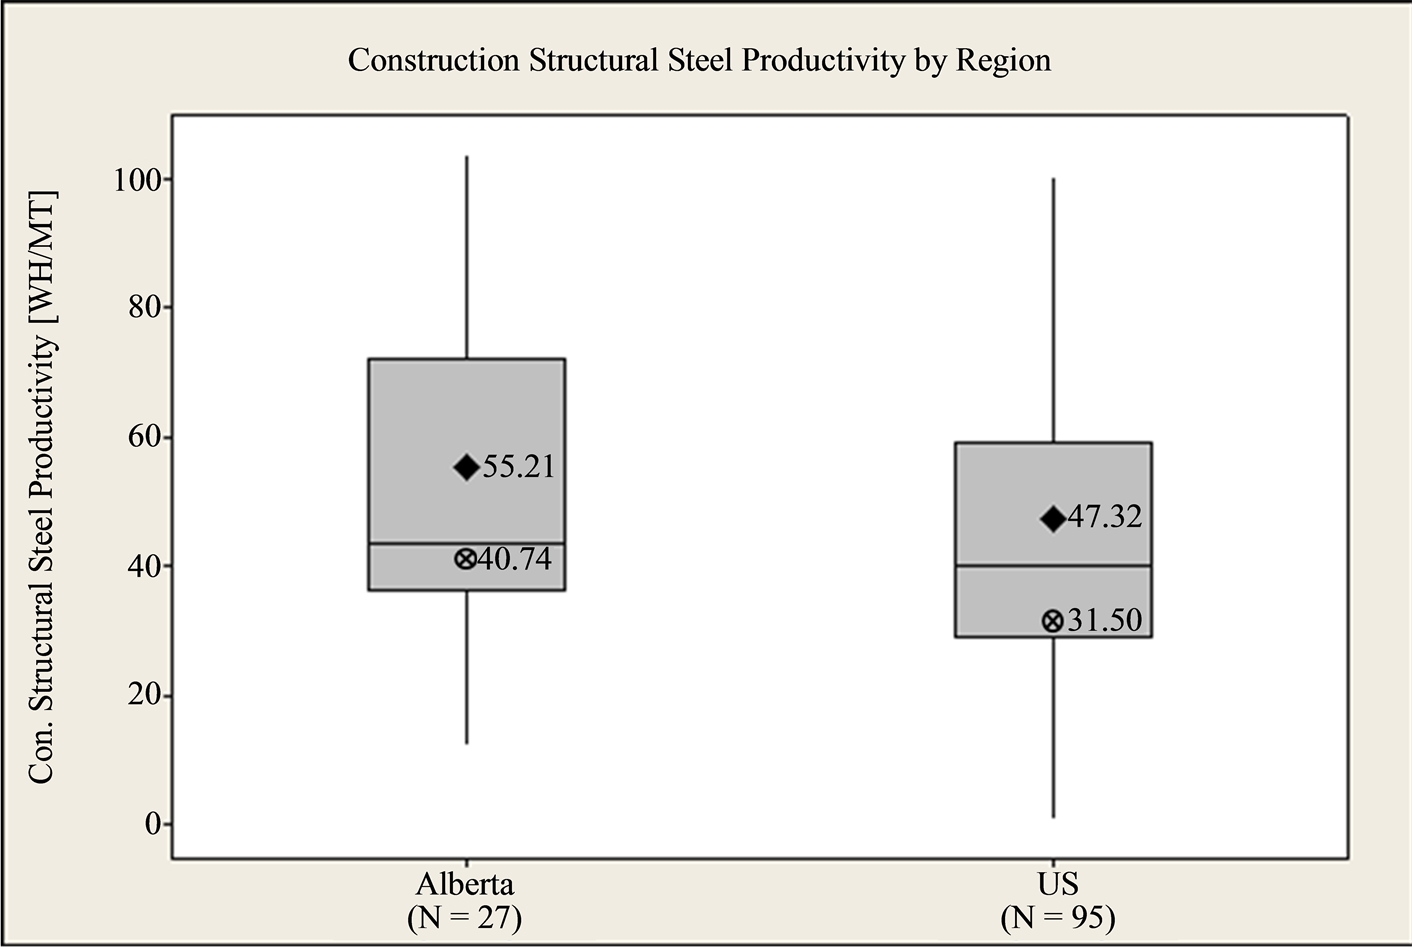
Figure 5. Construction structural steel productivity comparison between US & Alberta.
4. Discussions of the Results
Although, the development of capital projects in Alberta were compounded by extremes experienced related to such things as labor availability, harsh weather conditions, and remote project locations amongst others. Yet, this research was able to objectively quantify the performance of projects executed in Alberta and compares it to the US projects. A number of comparisons were made between Alberta and comparable US projects. Interestingly, Projects executed in Alberta shows a significantly higher average schedule performance than US projects. This means that Alberta projects experienced more project schedule growth, while US projects experienced less schedule growth. Projects executed in Alberta show higher average cost performance than the US projects. Alberta projects experienced more project cost growth, while the US projects experienced less project cost growth, respectively. These projects also demonstrate that a much wider range of cost and schedule performance exists as well. In contrary, the result also shows that US-based projects are more productive in erecting structural steel than Alberta projects. This is consistence with [5] finding that due to geographic location, weather conditions and size of the projects, there is complexity associated with the delivery of construction projects in the oil and gas sector in Alberta. Perhaps this may indicate that the Alberta industrial and pipeline companies need to accelerate their development of capital projects in area of construction structural steel productivity. The implied belief was that productivity in Alberta needs attention for its capital projects.
5. Conclusions
The developments of Alberta capital projects were compounded by extremes experienced in Alberta related to such things as labor availability, harsh weather conditions and remote project locations amongst others. The research was able to measure performance of these capital projects executed in Alberta and compared with US projects. It focused on cost, schedule and structural steel construction productivity.
In comparison, the project schedule growth in US and projects executed in Alberta shows significantly higher average schedule growth for the Alberta projects than US. The Alberta projects experienced 12.1% project schedule growth, while the US projects experienced 5.7% schedule growth. The project cost growth in the US and projects executed in Alberta show higher average cost growth for the Alberta projects than US. Alberta projects experience 6.3% project cost growth, while the US projects experience 0.7% cost growth, respectively. The construction structural steel productivity in the US and projects executed in Alberta show that the US-based projects are more productive in erecting structural steel than Alberta projects (47.32 WH/MT versus 55.21 WH/MT respectively). The paper chronicles the efforts made by owners, contractors and other stakeholders in their delivery of capital projects in Alberta and US.
Acknowledgements
The authors would like to thank Natural Sciences and Engineering Research Council of Canada (NSERC), Construction Owners Association of Alberta (COAA), Construction Industry Institute (CII) and COAA contributing members for providing financial support, data and guidance.
References
- COAA (2009) Alberta Report #1 Construction Owners Association of Alberta. http://www.coaa.ab.ca
- Alberta Finance and Enterprise (AFE) (2008) Highlights of the Highlights of the Alberta Economy. http://www.albertacanada.com/statpub
- Alberta Industry (2012).
http://www.albertacanada.com/business/industries/ec-about-the-industry.aspx - Dunbar, R., Strogran, M., Chan, P. and Chan, K.S. (2004) Oil Sands Supply Outlook: Potential Supply and Costs of Crude Bitumen and Synthetic Oil in Canada 2003-2017, Canadian Energy Research Inst., Calgary.
- Jergeas, G.F. (2009) Improving Construction Productivity on Alberta Oil and Gas Capital Projects. Report to Alberta Finance and Enterprise Project Report, Alberta.
- Lee, Y.P., et al. (2006) Understanding Factors for Benchmarking Adoption: New Evidence from Malaysia. Bechmarking: An International Journal, 13, 548-565.
- Nasir, H., Dorji, U., Attalla, M., Rankin, J., Fayek, A.R. and Haas, C. (2008) Studies in Construction Performance Benchmarking. Proceedings of Annual Conference of the Canadian Society for Civil Engineering, Québec City, 10-13 June 2008, 136-145.
- Brunso, T.P. and Siddiqi, K.M. (2003) Using Benchmarks and Metrics to Evaluate Project Delivery of Environmental Restoration Program. Journal of Construction Engineering and Management, 129, 119-130.
- Mohamed, S. (1996) Benchmarking and Improving Construction Productivity. Benchmarking for Quality Management & Technology, 3, 50-58. http://dx.doi.org/10.1108/14635779610149151
- Williams, J., Brown, C. and Springer, A. (2012) Overcoming Benchmarking Reluctance: A Literature Review. Bechmarking: An International Journal, 19, 255-276.
- Lincoln, Y.S. and Guba, E.G (2000) Paradigmatic Controversies, Contradictions, and Emerging Confluences. In: Denzin, N.K. and Lincoln, Y.S., Eds., Handbook of Qualitative Research, 2nd Edition, Sage Publications Ltd., Thousand Oaks, 163-188.
- Patton, M.Q. (1990) Qualitative Evaluation and Research Techniques, 2nd Edition, Sage Publication, Thousand Oaks.
- Walker, D.H.T. (1997) Choosing an Appropriate Research Methodology. Journal of Construction Management and Economics, 15, 149-159. http://dx.doi.org/10.1080/01446199700000003
- Creswell, J.W. (2003) Research Design: Qualitative, Quantitative and Mixed Method Approaches. Sage Publication, Thousand Oaks.
- Field, A. (2005) Discovering Statistics Using SPSS. 2nd Edition, Sage Publications, Thousand Oaks.
- Agresti, A. and Finlay, B. (1999) Statistical Methods for the Social Sciences. 3rd Edition, Prentice Hall Inc., Upper Saddle River.