Open Journal of Respiratory Diseases
Vol.07 No.02(2017), Article ID:76455,15 pages
10.4236/ojrd.2017.72008
Effect of Induced Anxiety on Respiratory Resistance Using Virtual Reality Simulation
Matthew Bohensky, Arthur T. Johnson, Jafar Vossoughi*
Fischell Department of Bioengineering University of Maryland, College Park, MD, USA

Copyright © 2017 by authors and Scientific Research Publishing Inc.
This work is licensed under the Creative Commons Attribution International License (CC BY 4.0).
http://creativecommons.org/licenses/by/4.0/


Received: March 8, 2017; Accepted: May 23, 2017; Published: May 26, 2017
ABSTRACT
Background: The purpose of this research was to identify significant changes to respiratory resistance resulting from anxiety inducing simulations presented through the medium of virtual reality (VR) goggles. The tested hypothesis was that a virtual reality simulation would produce anxiety in the wearer, and, with it, a statistically significant change in subject respiratory resistance. It was also suggested that there may be a significant difference in the levels of respiratory resistance responses of males and females. The Oculus Rift DK2 VR goggles with video software designed for the Rift were used to induce anxiety in the wearers. Methods: Respiratory resistances in both inhalation and exhalation directions were measured with the Airflow Perturbation Device (APD), a medical instrument used noninvasively. Two groups of subjects were tested: the test group watched a simulation deemed to be anxiety inducing, and the Control group watched a simulation determined to be non-anxiety inducing. Anxiety levels and respiratory resistance were measured before and during the simulation with two anxiety measures, the State Trait Anxiety Inventory (STAI) and the Subjective Units of Distress Scale (SUDS). Results: Statistically significant increases in anxiety level and respiratory resistance were found in the Test group, but no significant differences in anxiety and respiratory resistance levels were found in the control group. Anxiety affected both breathing phases similarly. For the gender hypothesis, we found that one of the tests used to measure anxiety, (the SUDS difference) was statistically significant, while the other test and the difference in respiratory resistance were not statistically significant. Conclusion: Results from this experiment show that anxiety level can be a significant contributor to the physiological measurement of respiratory resistance, and this can have implications for pulmonary function test environments and the psychological conditions of the patients being tested.
Keywords:
Respiratory Resistance, Pulmonology, Breathing Irregularity, Anxiety, Virtual Reality, Airway Resistance, Airflow Perturbation Device, Exposure Therapy, Fear-Induced Stimulation

1. Introduction
Respiratory resistance is a measurement of clinical and physiological interest. Increased respiratory resistance is clinically related to an assortment of respiratory diseases such as asthma, bronchitis, pneumonia, emphysema and other obstructive respiratory disorders. Resistance measurement is useful in evaluating the severity of respiratory diseases, respiratory effects of bronchoconstrictive and bronchodilatory drugs, as well as airborne contaminants and naturally occurring particulates [1] [2] .
The airflow perturbation device (APD) is a medical instrument developed for noninvasive measurement of respiratory resistance that includes airways, lung tissue, and chest wall components [1] [2] [3] [4] . It is quite simple to use, and has advantages for measurements on small children, unconscious or uncooperative patients, in the home, and on animals. The APD works by measuring mouth air pressure and flow while a rotating segmented wheel periodically perturbs, or decreases, airflow, and increases mouth pressure. The ratio of the mouth pressure perturbation magnitude to the flow perturbation magnitude yields the measured respiratory resistance. Separate resistance values for inhalation and exhalation are obtained, and these can be correlated with lung volume and flow. Specialized breathing maneuvers are not necessary. Respiratory resistance is normally measured through the mouth, with a nose clip to direct all airflow to the measuring device. An oronasal mask can be used to obtain the combined mouth and nose resistance [2] [5] , or can be used to measure only nose resistance if the mouth is closed. Data collected by the APD are analyzed in real time and displayed as averages of approximately 100 perturbations. APD measured resistances have been correlated to resistances measured by spirometry [6] , body plethysmograph [1] [6] , esophageal balloon [7] [8] , and impulse oscillometry [9] , although the first three of these do not measure all of the components of respiratory resistance. Population averages of respiratory resistances as measured by the APD have been determined for thousands of subjects [10] .
Attempting to produce anxiety through virtual reality (VR) is a common part of exposure therapy. Exposure therapy, which is used in various forms to treat anxiety and post traumatic stress disorder (PTSD), uses a fear inducing stimulus in order to break the subject’s anxious response to a specific situation, such as a fear of heights or of spiders. Gerardi et al. [11] wrote that “Short-term virtual reality exposure treatment of PTSD in an Operation Iraqi Freedom veteran resulted in a substantial drop in the patient’s self-reported PTSD symptoms.” These authors successfully used a form of VR called “Virtual Iraq” to elicit an anxious response from veterans suffering from PTSD. A form of virtual reality was even used to elicit an anxious response from a Vietnam War veteran patient for the purposes of exposure therapy [12] . While the technology used then was not comparable to current VR technologies, the concept remains the same. There have been various other attempts to use VR to treat anxiety disorders such as acrophobia [13] and anxiety related to terror attacks [14] .
Anxiety can be accompanied by a range of persistent fear reactions that include pounding heart, cardiac palpitations, exaggerated startle, breathing irregularities, sweaty palms and tense muscles [15] . Respiratory correlates of anxiety include hyperventilation [15] [16] or a freeze response, where the subject may breathe in a shallow manner [17] . Anxiety can therefore produce a variety of responses, depending upon the subjects and their individual psychological reactions.
This study was intended to document quantitative correlations between the physiological changes to breathing, specifically respiratory resistance as measured by the APD, and cognitive changes, as perceived by the subject through their completion of a State Trait Anxiety Inventory (STAI) questionnaire. The STAI is used to assess the two types of state (how are you feeling right now?) and trait (how anxious are you in general?) anxieties. It is a commonly used scale that was able to determine the state of all subjects’ anxiety levels after the simulation and compare them to pre-testing anxiety levels. See the Appendix for the trait anxiety questionnaire; the state anxiety questions are the same. The STAI form has 20 questions, 10 of these are positive in mood, and 10 questions are negative. Each response can be given a score of 1 to 4, depending on the level of the response, with 1 corresponding to “not at all” and 4 corresponding to “very much so”. When determining the final overall STAI anxiety score from the answers given by the taker of the test, a “4” response for a positive mood question was assigned a value of 0, whereas a “1” response was assigned a value of 3. For the negative mood questions, a “4” response was assigned a value of 3, and a “1” response was assigned a value of 0. Overall STAI anxiety responses range on a scale of 0 - 30 with a zero indicating the location on the scale where the subject would appear to exhibit no anxiety whatsoever to 30 corresponding to a very anxious condition. Internal consistency coefficients for the STAI questionnaire have ranged from 0.86 to 0.95 [18] .
The Subjective Units of Distress Scale (SUDS) is a one question subjective anxiety level scale [19] , which rates anxiety level on a scale of 0 (totally relaxed) to 10 (maximum stress). While not as comprehensive as the 20 question STAI, it has the advantage of rapid self-reporting of anxiety level. SUDS was chosen to compliment the STAI form, and data from the two forms were expected to be highly correlated.
The Oculus Rift DK2 designed by 2015 Oculus VR LLC (Menlo Park, CA), was used as the method of inducing anxiety. The Oculus Rift DK2 is a VR headset designed primarily for programmers and software developers as a way of developing more VR software. There are many programs readily available that are fully integrated with the Oculus Rift DK2. For the simulation used in this study intended to produce anxiety, the horror movie 11:57 by Sid Lee Collective (Montreal, Canada) was chosen. 11:57 is a short virtual reality Halloween horror film made for the Oculus Rift and other mobile devices, and is available from the Internet at http://1157.pm/.
The hypothesis to be tested in this experiment was that subjects viewing the virtual reality simulation intended to induce anxiety would indeed become anxious and produce a statistically significant change in respiratory resistance. It was also suggested that there possibly could be a significant difference in the levels of respiratory resistance responses of subjects based on their genders.
2. Methods
Individuals ages 18 and above without regard for sex, race, ethnic origin, religion, or any social or economic qualifications and also without any known severe existing anxiety related condition were eligible to participate in this study. All of the participants were currently enrolled college students, and within two years of the age of twenty. Subjects were recruited by word of mouth and given no monetary incentive to participate. The protocol for this study was approved by the University of Maryland Institutional Review Board. The study was conducted from October 2015 to December 2015.
The experiment itself used the Oculus Rift DK2 (Menlo Park CA) as a VR headset. Software used with the Rift for the anxiety inducing simulation was produced by the Sid Lee Collective (Montreal Canada) entitled “11:57”. The simulation for the control (no anxiety induced) portion of the experiment was personally recorded by the lead author (Bohensky) and consisted of video footage from a handheld camera being carried for approximately three minutes in the proximity of Niagara Falls, N.Y., and focused completely on the falls. The video was taken with the camera rotating slowly to focus on various areas of the falls. Use of the Rift requires the use of a computer, which in this case was a Dell (Round Rock, TX) Inspiron 15, 3000 series.
Thirty volunteer human test subjects were tested and divided into two groups. The “Test” group contained fifteen subjects, and the “Control” group also contained fifteen subjects. The experimental procedure was explained in full to the individuals taking part in the experiment. Test subjects were asked if they completely understood the experiment and whether they had any outstanding medical condition that they believed might interfere with their participation, any known anxiety related conditions, or any experience with virtual reality. This was done by filling out a “Health History Questionnaire” as well as a “SUDS” form (attached). Any subjects with relevant outstanding medical conditions were removed from the experiment, such as a subject with a known anxiety related or respiratory disorder (one subject confessing to a certain level of anxiety was excluded from testing). All subjects with no outstanding relevant medical conditions then signed a form indicating their consent to take part in the experiment. Subjects then took two minutes to relax in a sitting position. After two minutes, subjects were requested to breathe into the APD using their own personal new mouth filter for three respiratory resistance measurements, each lasting approximately one minute, thereby establishing a personal baseline measurement in a relaxed state. The subjects were given the SUDS question to answer at this time, but were not given the STAI until after the test session was complete; this saved some subject testing time. The Oculus Rift DK2 was wiped down with alcohol wipes between subjects. Subjects unfamiliar with VR were given two minutes to acclimate themselves to the rift using the Oculus demo simulation of a person sitting in a chair. Individuals in the “Control” group then used the Rift for an ordinary simulation that was deemed to be non-frightening. Individuals in the “Test” group took part in what was deemed a frightening/anxiety causing simulation. The subjects were asked to breathe into the APD continuously for the length of the simulation, to collect a large data set of subject breathing during the simulation. Both movies were 3.5 minutes in length, and effectively allowed the collection of two, one minute respiratory resistance measurements. The data from each subject were recorded and compared to that subject’s initial baseline respiratory resistance average. Subjects were also asked to take a survey to accurately measure their anxiety levels using STAI forms (attached) after being exposed to the aforementioned simulations, to correlate the level of state anxiety caused by the simulation and the resulting physiological changes. Finally, subjects were asked to once again fill out the SUDS form and indicate if their level of anxiety had changed from when they assessed it before the simulation. Subjects filled out the STAI only after they had completed the simulation, but filled out the SUDs form both before and after the simulation. The SUDS form was intended to compare the level of anxiety induced by the simulation, and the STAI form to document the level of anxiety achieved after the simulation and compared to standard anxiety levels. The data were analyzed using a two-tailed paired-T test, with a p value of 0.05 to compare the subjects’ initial results with their post-treatment results, as well as to compare the results of the different groups in an effort to determine:
a) anxiety level induced by VR technologies, if any; and
b) correlations between respiratory resistances during inhalation and exhalation and anxiety level, as judged by STAI forms; and
c) magnitudes of these changes.
The study took approximately 20 - 25 minutes per subject.
Experimental data to be analyzed included: the SUDS difference (i.e. the relative difference in anxiety levels before and after the simulation), the anxiety score based on the STAI forms as a second method of anxiety level verification, and the average difference between the experimental and baseline results in subject breathing resistance during inhalation, exhalation, and an average of the two.
3. Results
Demographic data and the mean baseline respiratory resistance for each group are shown in Table 1. Half the subjects were female, and half were male. The baseline resistance in the Test group was slightly higher than the baseline resis-

Table 1. Table of demographics. (Entries are means ± standard deviations and (ranges)).
tance in the Control group. Physical condition and height varied considerably in both groups.
To check on the equality of these two groups before the anxiety was induced, each of the numerical measures was subjected to a statistical test for significance. No measures except inhalation resistance were found to be statistically significantly different. Inhalation resistance difference was borderline significant statistically. The all-important average resistance, the measure that was compared after the treatment was applied, was essentially the same for both groups. Statistical analysis was used to compare any two data sets displayed in the tables with two sample t tests (assuming unequal variance).
A comparison of the STAI values and the SUDS difference was made to assure that both were consistently measuring induced anxiety. The comparison produced a notable positive correlation (Figure 1).
The mean post-treatment STAI value for the Test group was 16.13 (moderately anxious), while the mean post-treatment STAI score for the Control group was 8.20 (somewhat anxious). The mean SUDS pre- and post-treatment difference for the Control group was −0.13 (less anxious than before the treatment), while the SUDS difference score for the Test group was 2.03 (considerably more anxious).
In Table 2 are found T-test values, means and variances for Test vs Control groups for differences in SUDS, STAI, and average respiratory resistance. The SUDS difference between the two groups yielded a T statistic of 5.35 and a critical value of 2.05, making the comparison statistically significant. The T statistic for the STAI measurement comparing the two groups was 3.31 and the T critical was 2.05, making that comparison statistically significant, as well. Both reject the null hypothesis and confirm that the Test group demonstrated a significant increase of anxiety compared to the Control group. The results proved that the test simulation with the Oculus rift induced anxiety in the Test group but not in the Control group.
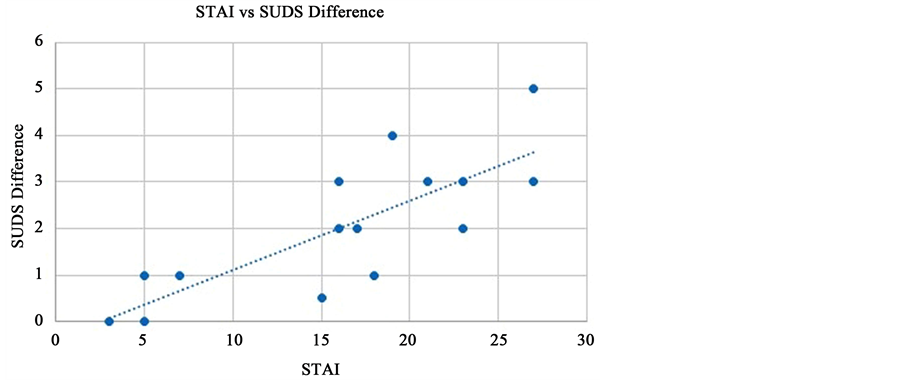
Figure 1. SUDS difference compared to STAI experimental values. The data suggest a linear trend (R2 = 0.6357).
Table 2. T-test values, means and standard deviations for test and control groups comparing suds score changes, Stai score changes, and average respiratory resistance changes before and after virtual reality treatment.
*This result is statistically significant. All resistance values are given in cmH2O∙sec/L.
The data in Table 2 also indicate that there was a statistically significant difference in post-treatment average respiratory resistance between the Test and Control groups despite no statistical difference between the two groups before the treatment. The Test group had a large increase in respiratory resistance of 0.731/3.22 = 23% after anxiety was induced, whereas the Control group had a modest post-treatment increase of 0.089/2.73 = 3.3%. Thus, it was demonstrated that VR induced anxiety can affect respiratory resistance measurements.
In Figure 2 are shown the average respiratory resistance differences for all of the subjects in both groups as related to STAI score. As shown in the figure, Test group subjects had larger resistance changes than did subjects in the Control group. A couple of subjects in the Test group even had smaller resistances after the simulation than before.
Further illumination of the results from this experiment can come from illustrating the percentage of the original baseline resistance that was changed in each individual with the STAI score of that subject (Figure 3). Because large differences in respiratory resistance may only be a small percentage of the total re-
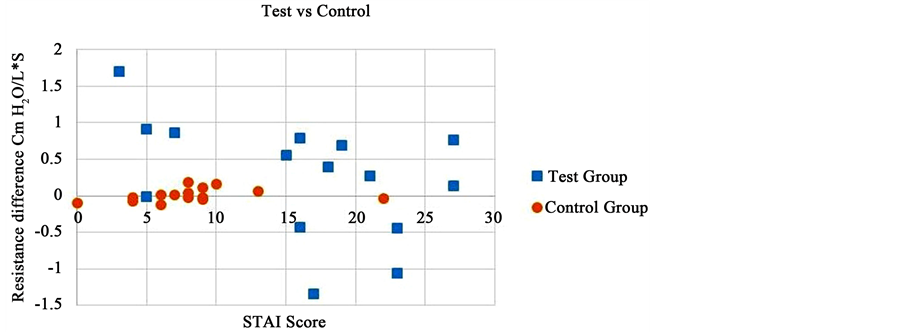
Figure 2. Average respiratory resistance differences among subjects of the two groups.
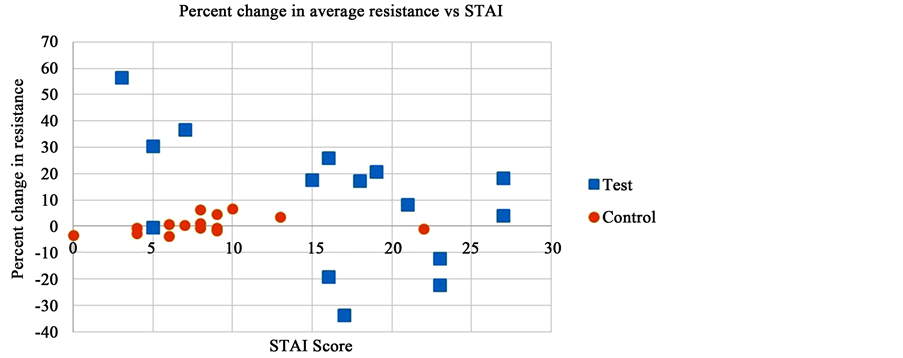
Figure 3. Relative changes in average respiratory resistance as affected by STAI score for the Test and Control groups. Test group data are noticeably more spread than are Control group data.
sistance if the subject has a high baseline resistance, and vice versa, the data were normalized to highlight relative resistance changes.
In order to investigate whether resistance changes were manifested mostly in the inhalation direction, the exhalation direction, or both, these resistances were graphed separately for both groups (Figure 4 and Figure 5), illustrating an important advantage of respiratory resistance measurements made with the APD. From the appearance of the graphs, anxiety-induced changes in respiratory resistance were exhibited nearly equally in both directions.
Another area examined is the male versus female reactions in the Test group. The resulting T tests revealed that we could not reject the null hypothesis for the pre- to post-treatment STAI anxiety measures, or for the differences in respiratory resistance (Table 3). There was, however, a statistically significant difference in the SUDS score comparing the pretreatment condition to the posttreatment condition. Figure 6 shows the percentage changes of average respiratory resistance for both genders in the Test group as related to differences in STAI score before and after treatment.
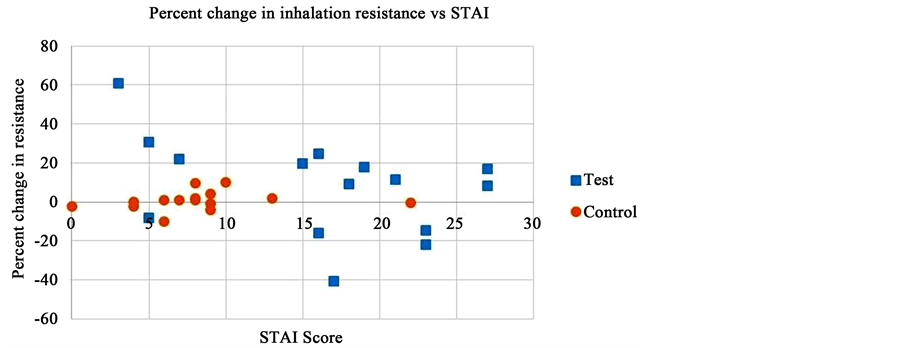
Figure 4. Relative changes in respiratory resistance in the inhalation direction as affected by STAI score for the test and control groups.
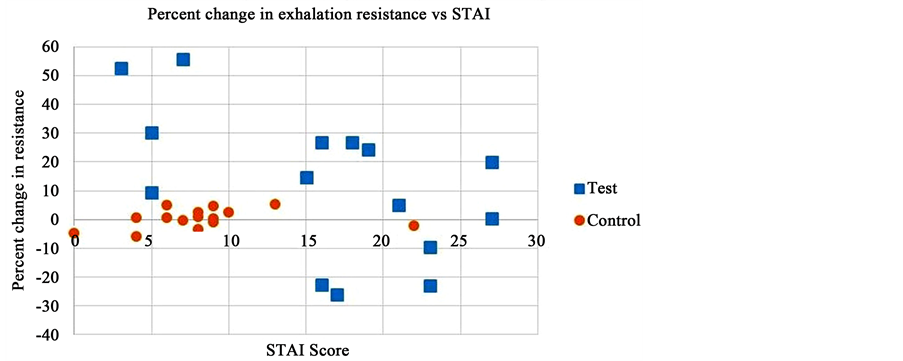
Figure 5. Relative changes in respiratory resistance in the exhalation direction as affected by STAI score for the Test and Control groups.
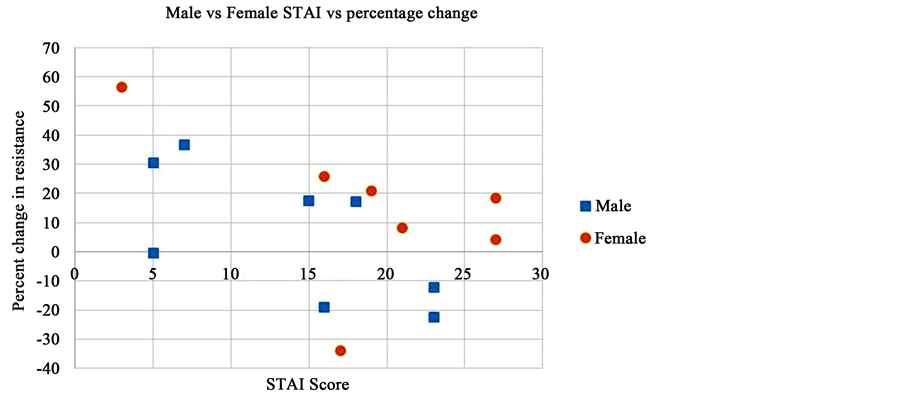
Figure 6. Comparison of male vs female STAI rank with percentage change in average resistance data. Males tend to be lower, but the spread is too large to draw definite conclusions.
Table 3. T-test values, means, and standard deviations for test group male vs female: pre- and post-treatment SUDS differences, STAI differences, and average respiratory resistance differences.
*This result is statistically significant. All resistance values are given in cmH2O∙sec/L.
4. Discussion
The foremost objective of this research project was to establish and analyze the changes in the level of subject anxiety, and correlate these changes with the changes in respiratory resistance, as measured by the APD. We have shown that VR can induce anxiety in people, and that respiratory resistance increases as a result. Previous research demonstrated a natural variation from time to time in respiratory resistance as measured by the APD of roughly 10% - 12% of the mean value [20] . The respiratory resistance increase elicited by anxiety in the present experiment was about 23%, which should be easily distinguishable from the natural variation. This rise in respiratory resistance is significant, being almost exactly the same percent increase as measured between no congestion and moderate congestion conditions [21] , and so would definitely be felt by those undergoing the increase.
It has been shown previously [22] [23] [24] that respiration, including respiratory resistance, is affected by anxiety level. This is most important for asthmatics, in whom the causative agent for anxiety may be increased resistance to breathing; the resulting panic can subsequently cause a higher resistance that then results in more panic. The two, resistance and anxiety, thus go hand-in- hand. We have shown in nonasthmatics that an increase in resistance can be expected during anxiety episodes, and this change can be in the neighborhood of 25% of the value existing before the episode. Additionally, the increase occurs in both inhalation and exhalation directions.
It was interesting that some subjects experienced a noticeable increase in respiratory resistance in both their inhalation and exhalation values, whereas others experienced a noticeable decrease in their resistances. This may be due to different psychological reactions to the experiment. Respiratory resistance may have increased due to hyperventilation (respiratory resistance has long been known to increase with faster flow rate [10] ), which can be attributed to a fight or flight response. Conversely, a decrease in respiratory resistance may be indicative of shallow breathing that may result from a freeze response where the subject seems frozen from fear.
There appeared to be a seeming paradox that appears between the data in Figure 3 and the overall significant resistance difference between the Test and Control groups. As shown in Figure 3, the subjects reporting less anxiety seemed to have the largest percentage changes in resistance, but this would not have been expected from the resistance comparison between the two groups that shows that higher anxieties relate to larger resistances. We have no easy explanation for this paradox. However, data in Figure 2 shows that absolute, not percentage, resistance differences do not appear to have the same inverse relationship between resistance and anxiety level. This would imply that the subjects with the lowest baseline resistances had the largest relative resistance changes, and, also, that they had the lowest levels of anxiety. To try to explain this paradox, we checked with several of the subjects who had the largest percentage changes in resistance but low anxiety scores. They said that they were startled by the simulation, but were not anxious about it, and so gave low anxiety scores.
This experiment established that current VR headsets provide a significant level of immersion, and can influence our subconscious behavior. This influence may even occur without our being aware, as suggested by some individuals in the test group who exhibited a change in respiratory resistance without exhibiting a change in their perceived anxiety level, as measured by the difference on the SUDS scale.
It is possible that the finding that many subjects rated their anxieties differently was a prime contributor to the wide spread of the data from the Test group. The relatively large standard deviation in the measurements may have also obfuscated the appearance of a clear trend. It is also worth noting that the experiment showed no statistically significant difference between males and females with regard to the difference in respiratory resistance or measured anxiety levels using the STAI form. There was a significant difference between males and females with regard to the SUDS difference. This suggests that men and women exhibit similar levels of anxiety and subconsciously respond in a similar fashion. It is possible that such a difference exists, but due to the small sample size and large standard deviations, the null hypothesis could not be rejected.
Results from this experiment can have implications in the future when respiratory resistance becomes a routine physiological measurement in emergency medicine, especially when the patient is in shock or has had a traumatic experience and is unwilling or unable to speak. The APD, as a non-invasive and quick procedure, has potential for medical use aboard ambulances, in hospital emergency rooms, or on the battlefield to determine if emergency respiratory treatment is indicated. If a patient’s failure to respond is due to anxiety or other physiological causes, her or his resistance measurement could be much higher than population norms, resulting in either unnecessary or excessive treatment being given. By showing that respiratory resistance is directly correlated to anxiety level, breathing difficulty can be expected when anxiety is present, and that breathing difficulty can add to the anxiety already present. Just as blood pressure may increase just due to the act of measuring it in a doctor’s office (the so-called “white coat hypertension”), the same could apparently be true for respiratory resistance if the measurement itself induces anxiety in the patient.
At the very least, we have shown that respiratory resistances can be influenced by virtual reality. Given that VR goggles and other apparatus should become much more common in the future, this result of our experiments may someday be a useful one for research or clinical practice. We cannot know for sure what kinds of tests might be useful in the future, but this one should be easily implemented.
5. Conclusions
We were able to prove that respiratory resistance was affected by anxiety level, although most subjects increased their resistance levels and a few decreased them. Nearly all subjects in the test group invariably experienced significant variations from their baseline respiratory resistance levels during anxiety inducing simulations.
Subject sex was not determined to be a statistically significant factor in this study. However, it is possible that a larger sample of test subjects could yield different results.
Cite this paper
Bohensky, M., Johnson, A.T. and Vossoughi, J. (2017) Effect of Induced Anxiety on Respiratory Resistance Using Virtual Reality Simulation. Open Journal of Respiratory Diseases, 7, 68-82. https://doi.org/10.4236/ojrd.2017.72008
References
- 1. Lausted, C.G. and Johnson, A.T. (1999) Respiratory Resistance Measured by an Airflow Perturbation Device. Physiological Measurement, 20, 21-35.
https://doi.org/10.1088/0967-3334/20/1/002 - 2. Lopresti, E.R., Johnson, A.T., Koh, F.C., Scott Jr., W.H., Jamshidi, S. and Silverman, N.K. (2008) Testing Limits to Airflow Perturbation Device (APD) Measurements. BioMedical Engineering OnLine, 7, 28. https://doi.org/10.1186/1475-925x-7-28
- 3. Silverman, N.K. and Johnson, A.T. (2005) Design for a Stand-Alone Airflow Perturbation Device. International Journal of Medical Implants and Devices, 3, 139-148.
- 4. Johnson, A.T., Scott, W.H., Russek-Cohen, E., Koh, F.C., Silverman, N.K. and Coyne, K.M. (2007) Resistance Values Obtained with the Airflow Perturbation Device. International Journal of Medical Implants and Devices, 2, 45-58.
- 5. Wong. L.S. and Johnson, A.T. (2004) Decrease of Resistance to Airflow with Nasal Strips as Measured with the Airflow Perturbation Device. BioMedical Engineering OnLine, 3, 38-44.
https://doi.org/10.1186/1475-925X-3-38>www.biomedical-engineering-online.com/content/3/1/38
https://doi.org/10.1186/1475-925X-3-38 - 6. Haque, T., Vossoughi, J., Johnson, A.T., Bell-Farrell, W., Fitzgerald, T. and Scharf, S.M. (2013) Resistance Measured by Airflow Perturbation Compared with Standard Pulmonary Measures. Open Journal of Respiratory Diseases, 3, 63-67.
https://doi.org/10.4236/ojrd.2013.32010 - 7. Coursey, D.C., Scharf, S.M. and Johnson, A.T. (2010) Comparing Pulmonary Resistance Measured with an Esophageal Balloon to Resistance Measurements with an Airflow Perturbation Device. Physiological Measurement, 31, 921-934.
https://doi.org/10.1088/0967-3334/31/7/004 - 8. Coursey, D.C., Scharf, S.M. and Johnson, A.T. (2011) Comparison of Expiratory Isovolume Pressure-Flow Curves with Stop-Flow versus the Esophageal Balloon Method. Respiratory Care, 56, 969-975. https://doi.org/10.4187/respcare.01037
- 9. Pan, J., Saltos, A., Smith, D., Johnson, A. and Vossoughi, J. (2013) Comparison of Respiratory Resistance Measurements Made with an Airflow Perturbation Device with Those from Impulse Oscillometry. Journal of Medical Engineering, 2013, Article ID: 165782.
https://doi.org/10.1155/2013/165782 - 10. Johnson, A.T. (2007) Biomechanics and Exercise Physiology: Quantitative Modeling. Taylor and Francis, Boca Raton, FL. https://doi.org/10.1201/b15850
- 11. Gerardi, M., Rothbaum, B.O., Ressler, K., Heekin, M. and Rizzo, A. (2008) Virtual Reality Exposure Therapy Using a Virtual Iraq: Case Report. Journal of Traumatic Stress, 21, 209-213.
https://doi.org/10.1002/jts.20331 - 12. Gerardi, M., Cukor, J., Difede, J., Rizzo, A. and Rothbaum, B.O. (2010) Virtual Reality Exposure Therapy for Post-Traumatic Stress Disorder and Other Anxiety Disorders. Current Psychiatry Reports, 12, 298-305. https://doi.org/10.1007/s11920-010-0128-4
- 13. Rothbaum, B.O., Hodges, L.F., Kooper, R., Opdyke, D., Williford, J.S. and North, M. (1995) Virtual Reality Graded Exposure in the Treatment of Acrophobia: A Case Report. Behavior Therapy, 26, 547-554.
- 14. Difede, J., Cukor, J., Jayasinghe, N., Patt, I., Jedel, S., Spielman, L., Giosan, C. and Hoffman, H. (2006) Virtual Reality Exposure Therapy for the Treatment of Posttraumatic Stress Disorder Following September 11, 2001. The Journal of Clinical Psychiatry, 67, 1682-1689.
- 15. Lang, P.J. and McTeague, L.M. (2009) The Anxiety Disorder Spectrum Fear Imagery, Physiological Reactivity, and Differential Diagnosis. Anxiety, Stress, & Coping, 22, 5-25.
https://doi.org/10.1080/10615800802478247 - 16. Dratcu, L. (2000) Panic, Hyperventilation and Perpetuation of Anxiety. Progress in Neuro-Psychopharmacology & Biological Psychiatry, 24, 1069-1089.
- 17. Lopes, F., Azevedo, T.M., Imbiriba, L.A., Freire, R.C., Valenca, A.M., Caldirola, D., Perna, G., Volchan, E. and Nardi, A.E. (2009) Freezing Reaction in Panic Disorder Patients Associated with Anticipatory Anxiety. Depression and Anxiety, 26, 917-921.
https://doi.org/10.1002/da.20593 - 18. Spielberger, C.D. (1989) State-Trait Anxiety Inventory: Bibliography. Consulting Psychologists Press, Palo Alto, CA.
- 19. Tanner, B. (2012) Validity of Global Physical and Emotional SUDS. Applied Psychophysiology and Biofeedback, 37, 31-34. https://doi.org/10.1007/s10484-011-9174-x
- 20. Johnson, A.T., Jones, S.C., Pan, J.J. and Vossoughi, J. (2012) Variation of Respiratory Resistance Suggests Optimization of Airway Caliber. IEEE Transactions on Biomedical Engineering, 59, 2355-2361. https://doi.org/10.1109/TBME.2012.2204055
- 21. Awowale, A., Johnson, A. and Vossoughi, J. (2015) Influence of Nasal Congestion on Respiratory Resistance Values. Journal of Pulmonary & Respiratory Medicine, 5, 228-230.
- 22. Ritz, T.I., Steptoe, A., DeWilde, S. and Costa, M. (2000) Emotions and Stress Increase Respiratory Resistance in Asthma. Psychosomatic Medicine, 62, 401-412.
- 23. Katon, W.J., Richardson, L., Lozano, P. and McCauley, E. (2004) The Relationship of Asthma and Anxiety Disorders. Psychosomatic Medicine, 66, 349-355.
- 24. Perna, G., Ieva, A., Caldirola, D., Bertani, A. and Bellodi, L. (2002) Respiration in Children at Risk for Panic Disorder. Archives of General Psychiatry, 59, 185-186.
https://doi.org/10.1001/archpsyc.59.2.185.
Appendix A
Self-Evaluation Questionnaire
Developed by C.D. Spiellberger, R. L. Gorsuch and R. Lushene
STAI FORM Y-2
Name__________________________________________ Date____________
Directions: A number of statements which people have used to describe themselves are given below. Read each statement and then circle the appropriate number to the right of the statement to indicate how you generally feel. There are no right or wrong answers. Do not spend too much time on any one statement but give the answer which seems to describe how you generally feel.
Appendix B
The distress thermometer Subjective Units of Distress Scale (SUDS)
Try to get used to rating your distress, fear, anxiety or discomfort on a scale of 0 - 10. Imagine you have a “distress thermometer” to measure your feelings according to the following scale. Notice how your level of distress and fear changes over time and in different situations.
10) Highest distress/fear/anxiety/discomfort that you have ever felt
9) Extremely anxious/distressed
8) Very anxious/distressed, can’t concentrate
7) Quite anxious/distressed, interfering with performance
6)
5) Moderate anxiety/distress, uncomfortable but can continue to perform
4)
3) Mild anxiety/distress, no interference with performance
2) Minimal anxiety/distress
1) Alert and awake, concentrating well
0) Totally relaxed

Submit or recommend next manuscript to SCIRP and we will provide best service for you:
Accepting pre-submission inquiries through Email, Facebook, LinkedIn, Twitter, etc.
A wide selection of journals (inclusive of 9 subjects, more than 200 journals)
Providing 24-hour high-quality service
User-friendly online submission system
Fair and swift peer-review system
Efficient typesetting and proofreading procedure
Display of the result of downloads and visits, as well as the number of cited articles
Maximum dissemination of your research work
Submit your manuscript at: http://papersubmission.scirp.org/
Or contact ojrd@scirp.org