Open Journal of Respiratory Diseases
Vol.3 No.3(2013), Article ID:35404,9 pages DOI:10.4236/ojrd.2013.33019
Breathing Intolerance Index in COPD and Obesity: A Comparative Observational Study
1Division of Pulmonary and Critical Care Medicine, Keck School of Medicine, University of Southern California, Los Angeles, USA
2Department of Preventive Medicine, Keck School of Medicine, University of Southern California, Los Angeles, USA
Email: *baydur@usc.edu
Copyright © 2013 Ahmet Baydur, Zhanghua Chen. This is an open access article distributed under the Creative Commons Attribution License, which permits unrestricted use, distribution, and reproduction in any medium, provided the original work is properly cited.
Received April 4, 2013; revised May 6, 2013; accepted May 12, 2013
Keywords: Breathing Intolerance Index; COPD; Sleep Apnea
ABSTRACT
Background: The breathing intolerance index, BIT, a noninvasive derivation of the tension-time index of respiratory muscles, has been recently used to evaluate patients with respect to their need for noninvasive ventilation. Comparing the BIT index in different disorders with mild to moderate respiratory impairment, such as COPD and obesity, would be useful in determining differences in threshold for respiratory muscle fatigue amongst cohorts. Objectives: The purpose of this study was to compare control of ventilation and BIT in individuals with obesity, chronic obstructive pulmonary disease (COPD), and control subjects free of cardiorespiratory disorders. Because change in posture can alter respiratory load and control of ventilation, variables were assessed in two postures. Methods: We assessed 142 subjects consisting of 81 with obesity, 42 with COPD, and 19 non-smoking healthy adults. All subjects underwent evaluation of pulmonary function, control of ventilation and BIT index [(Ti/Ttot) × (Vt/FVC)] in seated and supine postures. Findings: BIT index was significantly greater in seated posture in all 3 cohorts due primarily to an increase in Vt in this position. BIT index was similar in value amongst cohorts in both postures, but tended to be higher in patients with obesity and COPD. Conclusion: While BIT index is higher in seated posture, and tends to be higher in patients with obesity and COPD as compared to control subjects, discrimination between cohorts is not found in our study because of small inter-group variations of respiratory function amongst cohorts. Thus, in clinically stable patients whose vital capacities are mild to moderately reduced, the BIT index alone cannot be recommended as a predictive guide for initiating assisted ventilation for respiratory failure. Nevertheless, because it is easy to perform, and is comfortably tolerated by patients, its potential usefulness may be in periodic measurements to monitor its increase as respiratory reserve declines.
1. Introduction
Patients with respiratory disorders experience ventilatory impairment related to underlying changes in lung volume, respiratory compliance and resistance, and breathing control mechanisms. These factors affect the diaphragm’s ability to sustain ventilation in the face of imposed respiratory loads. Tension time index of the diaphragm [TTIdi = product of the ratio of the mean transdiaphragmatic pressure swing divided by the maximum transdiaphragmatic pressure (Pdi/Pdimax) with the inspiratory time divided by the total breath time (Ti/Ttot)] is related to diaphragm endurance [1]. The ability to sustain transdiaphragmatic pressure swings required for continuous spontaneous breathing cannot be sustained for more than 45 minutes when the TTIdi is >0.15. However, the method of Bellemare and Grassino [1] is invasive, requiring the use of a gastric and esophageal balloon, and is difficult for untrained subjects to perform. Later, Ramonatxo et al. [2] instituted a noninvasive method for assessing the tension-time index (based on mouth occlusion pressure, P0.1) and easy to use from a technical standpoint. Koga et al. [3] substituted the ratio of tidal volume to vital capacity (Vt/VC) for Pdi/Pdimax in the Bellemare and Grassino [1] relationship, calling this relationship [(Ti/Ttot) × (Vt/FVC)] the breathing intolerance index (BIT). They found that the BIT indices of patients with respiratory impairment requiring noninvasive assisted ventilation (NIV) exhibited higher BIT indices than those who did not need NIV. Vt/VC can substitute for Pdi/Pdimax because the more Vt approaches VC, the less ability the inspiratory muscles have to sustain alveolar ventilation [1]. The study of Koga et al. [3] assessed the BIT index in patients with primarily restrictive thoracic/neuromuscular disorders. Assessment of the BIT index in individuals with other, more commonly encountered respiratory disorders would be useful in determining its value in assessing respiratory impairment and threshold for respiratory muscle fatigue. In fact, McGregor and Becklake [4] and Rochester and Bettini [5] found that oxygen consumption of respiratory muscles was better determined by the tension-time index than by the work of breathing.
The purpose of this study was to compare control of ventilation and the BIT index in individuals with obesity, chronic obstructive pulmonary disease (COPD), and control subjects free of cardiorespiratory disorders. Because change in posture alters respiratory mechanics and control of ventilation [6-14], variables were assessed in seated and supine posture. We considered that assuming the supine posture increases respiratory load and may reduce respiratory reserve, thereby increasing the BIT index. We also wished to determine differences in the BIT index in the two cohorts.
2. Methods
2.1. Subjects
We screened 150 clinically stable subjects in the pulmonary function laboratory on the same day as they underwent lung function testing, from April 2006 to July 2008. The diagnosis of COPD was made according to European Respiratory Society recommendations [15]. The diagnosis of obesity (BMI ≥ 30) was based on criteria published by the World Health Organization [16]. Questionnaires concerning medical and smoking history, and respiratory symptoms were administered. Subjects were excluded if they had otolaryngological defects or acute cardiorespiratory disease. The study was approved by the Institutional Review Board of the University of Southern California Health Sciences Campus, and an informed consent was obtained from each patient (IRB Proposal # HS-05-00412).
2.2. Pulmonary Function Testing
Spirometry and lung volumes by body plethysmography were performed while seated with a Collins GS/PLUS or DSII/PLUS system (Warren Collins; Braintree, MA). The cut-off point of FEV1/FVC for COPD was 0.7. Predicted values for post-bronchodilator FEV1, FVC and FEV1/FVC were from Schoenberg et al. [17], and for subdivisions of lung volume from Crapo et al. [18].
2.3. Control of Ventilation Equipment
Flow was measured with a heated Fleisch pneumotachograph (Lausanne, Switzerland) and differential pressure transducer (Validyne MP-45, ± 2.5 cm H2O; Validyne; Northridge, CA). The pneumotachograph was linear over the experimental range of flow. Volume was obtained by integration of digitized flow. The pneumotachographmouthpiece assembly had a resistance of 0.65 cm H2O/ L/sec for flows up to 1 L/sec. The flow signal, generated with a Validyne CD-19 carrier demodulators, was passed through a 32-Hz, low pass filter and sampled at 100 Hz with a DASO8 12-bit analog-to-digital converter (Measurement Computing Corporation; Middleboro, MA). The computer used was a 25-MHz personal computer with a 14-inch monitor. Software, written in Microsoft Quick Basic (Microsoft; Redmond, WA), provided for real-time collection and display of flow and volume data as well as operator control. Artifacts on the flow record caused by common mode rejection ratio were negligible [19].
2.4. Procedure and Data Analysis
Subjects sat in a comfortable chair at least 1 or 2 hours after eating or drinking coffee. They breathed room air through the equipment assembly with a nose clip on. Each subject underwent a 3 min trial run in order to become accustomed to the procedure. Data acquisition began after regular breathing was achieved and was continued for 15 minutes. Subjects were monitored for leaks at the mouthpiece. A closed system ensured that endexpiratory volume remained constant. Quiet breathing was also recorded for 15 minutes with the subject lying on a comfortable gurney with head resting on a low pillow. Seated and supine positioning was in random sequence. Coefficients of variation for tidal volume (Vt), inspiratory time (Ti), and expiratory time (Te) were 5% - 12% in both postures, as reported for normal subjects and patients with COPD [20,21]. BIT was defined as (Ti/Ttot) × Vt/FVC [3]. No patient exhibited dyspnea in either posture.
2.5. Statistical Analysis
Characteristics of participants were compared across obese, COPD and control cohorts using one-way analysis of variance (ANOVA). Age, sex and BMI were adjusted for in the model for their potential confounding effect. Bonferroni correction of p-values was applied to control type I error caused by multiple tests. Because the data exhibited skewed distributions for many of the lung function variables, nonparametric statistical procedures were used [22]. Medians and ranges were used where there were outlier values. These values were depicted as notched bar and whisker plots in order to highlight more clearly the significance in differences between cohorts. The notches surrounding the medians provide a measure of the rough significance of differences between the values. Specifically, if the notches about two medians do not overlap in this display, the medians are significantly different at about a 95% confidence level [23]. For each of the variables investigated, the Kruskal-Wallis test was employed to assess differences in central tendency between subjects with obesity, COPD, and controls. In order to perform similar analyses adjusting for age, BMI and gender, general linear models were used to model the ranks of test variables after adjustment for these covariates using Blom normal scores [24]. The Wilcoxon signed rank test was used to test for differences between variables obtained in the seated and supine postures.
3. Results
Anthropometric and Pulmonary Function Data
Of 150 patients screened, excluded from analysis were 5 patients with asthma (according to ATS/ERS criteria), and 3 with active cardiovascular problems. The remaining 142 subjects consisted of 81 patients with obesity, 42 with COPD, and 19 non-smoking healthy subjects (Table 1). The COPD patients were older, and the control subjects slightly younger than the obese subjects. All control subjects had BMIs < 30. The mean BMI of the obese subjects was 71% greater than in the control group.
Figures 1, 2, 5, 7 and 8 show that Vt, Vt/FVC, Vt/Ti,
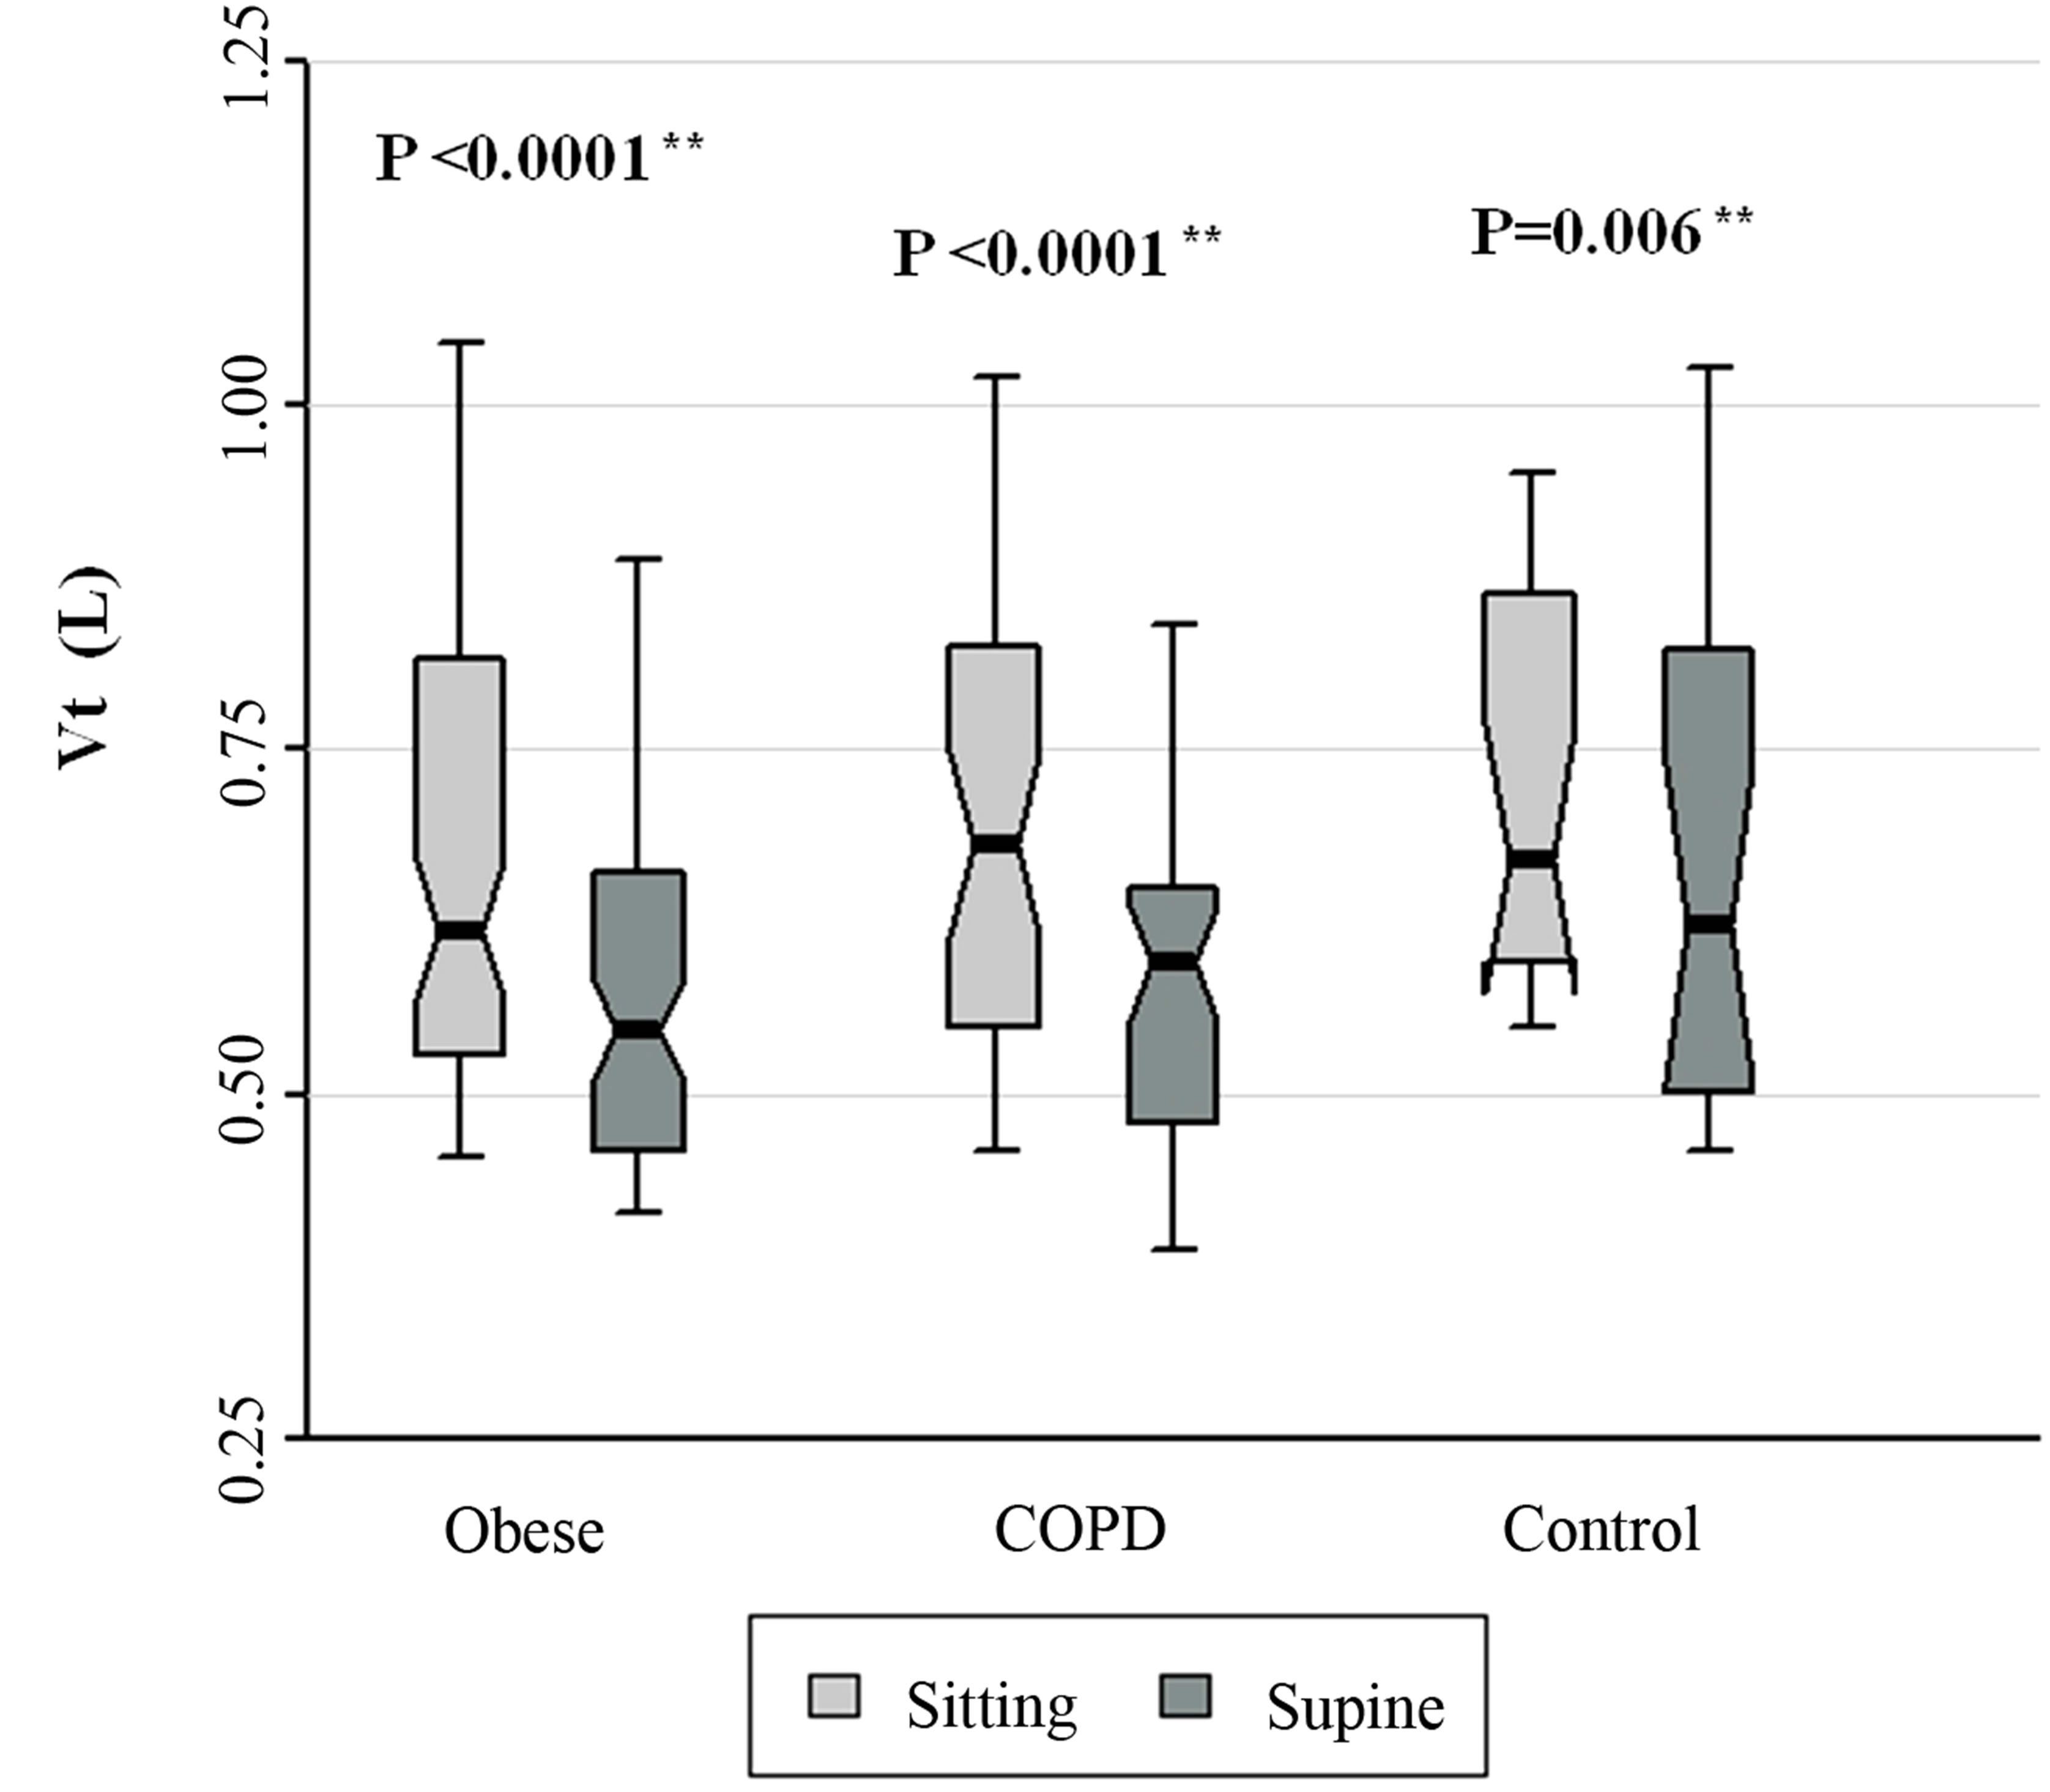
Figure 1. Vt data for patients with obesity, COPD, and control subjects. Each notched box represents the 25th - 75th percentile; internal line indicates the median; whiskers indicate the 10th and 90th percentiles. Notches extend to +/ −1.58 inter-quartile range/n1/2. Notches that do not overlap suggest strong evidence of different medians. The general linear model used to model the normal ranks of the test variable as a function of the sitting and supine groups, adjusted for age and sex, showed no significant differences amongst cohorts in the sitting posture, P = 0.434, and amongst cohorts in the supine posture, P = 0.260. **Wilcoxon signed rank test (non-parametric paired-sample t-test) for comparisons between sitting and supine positions in each cohort.
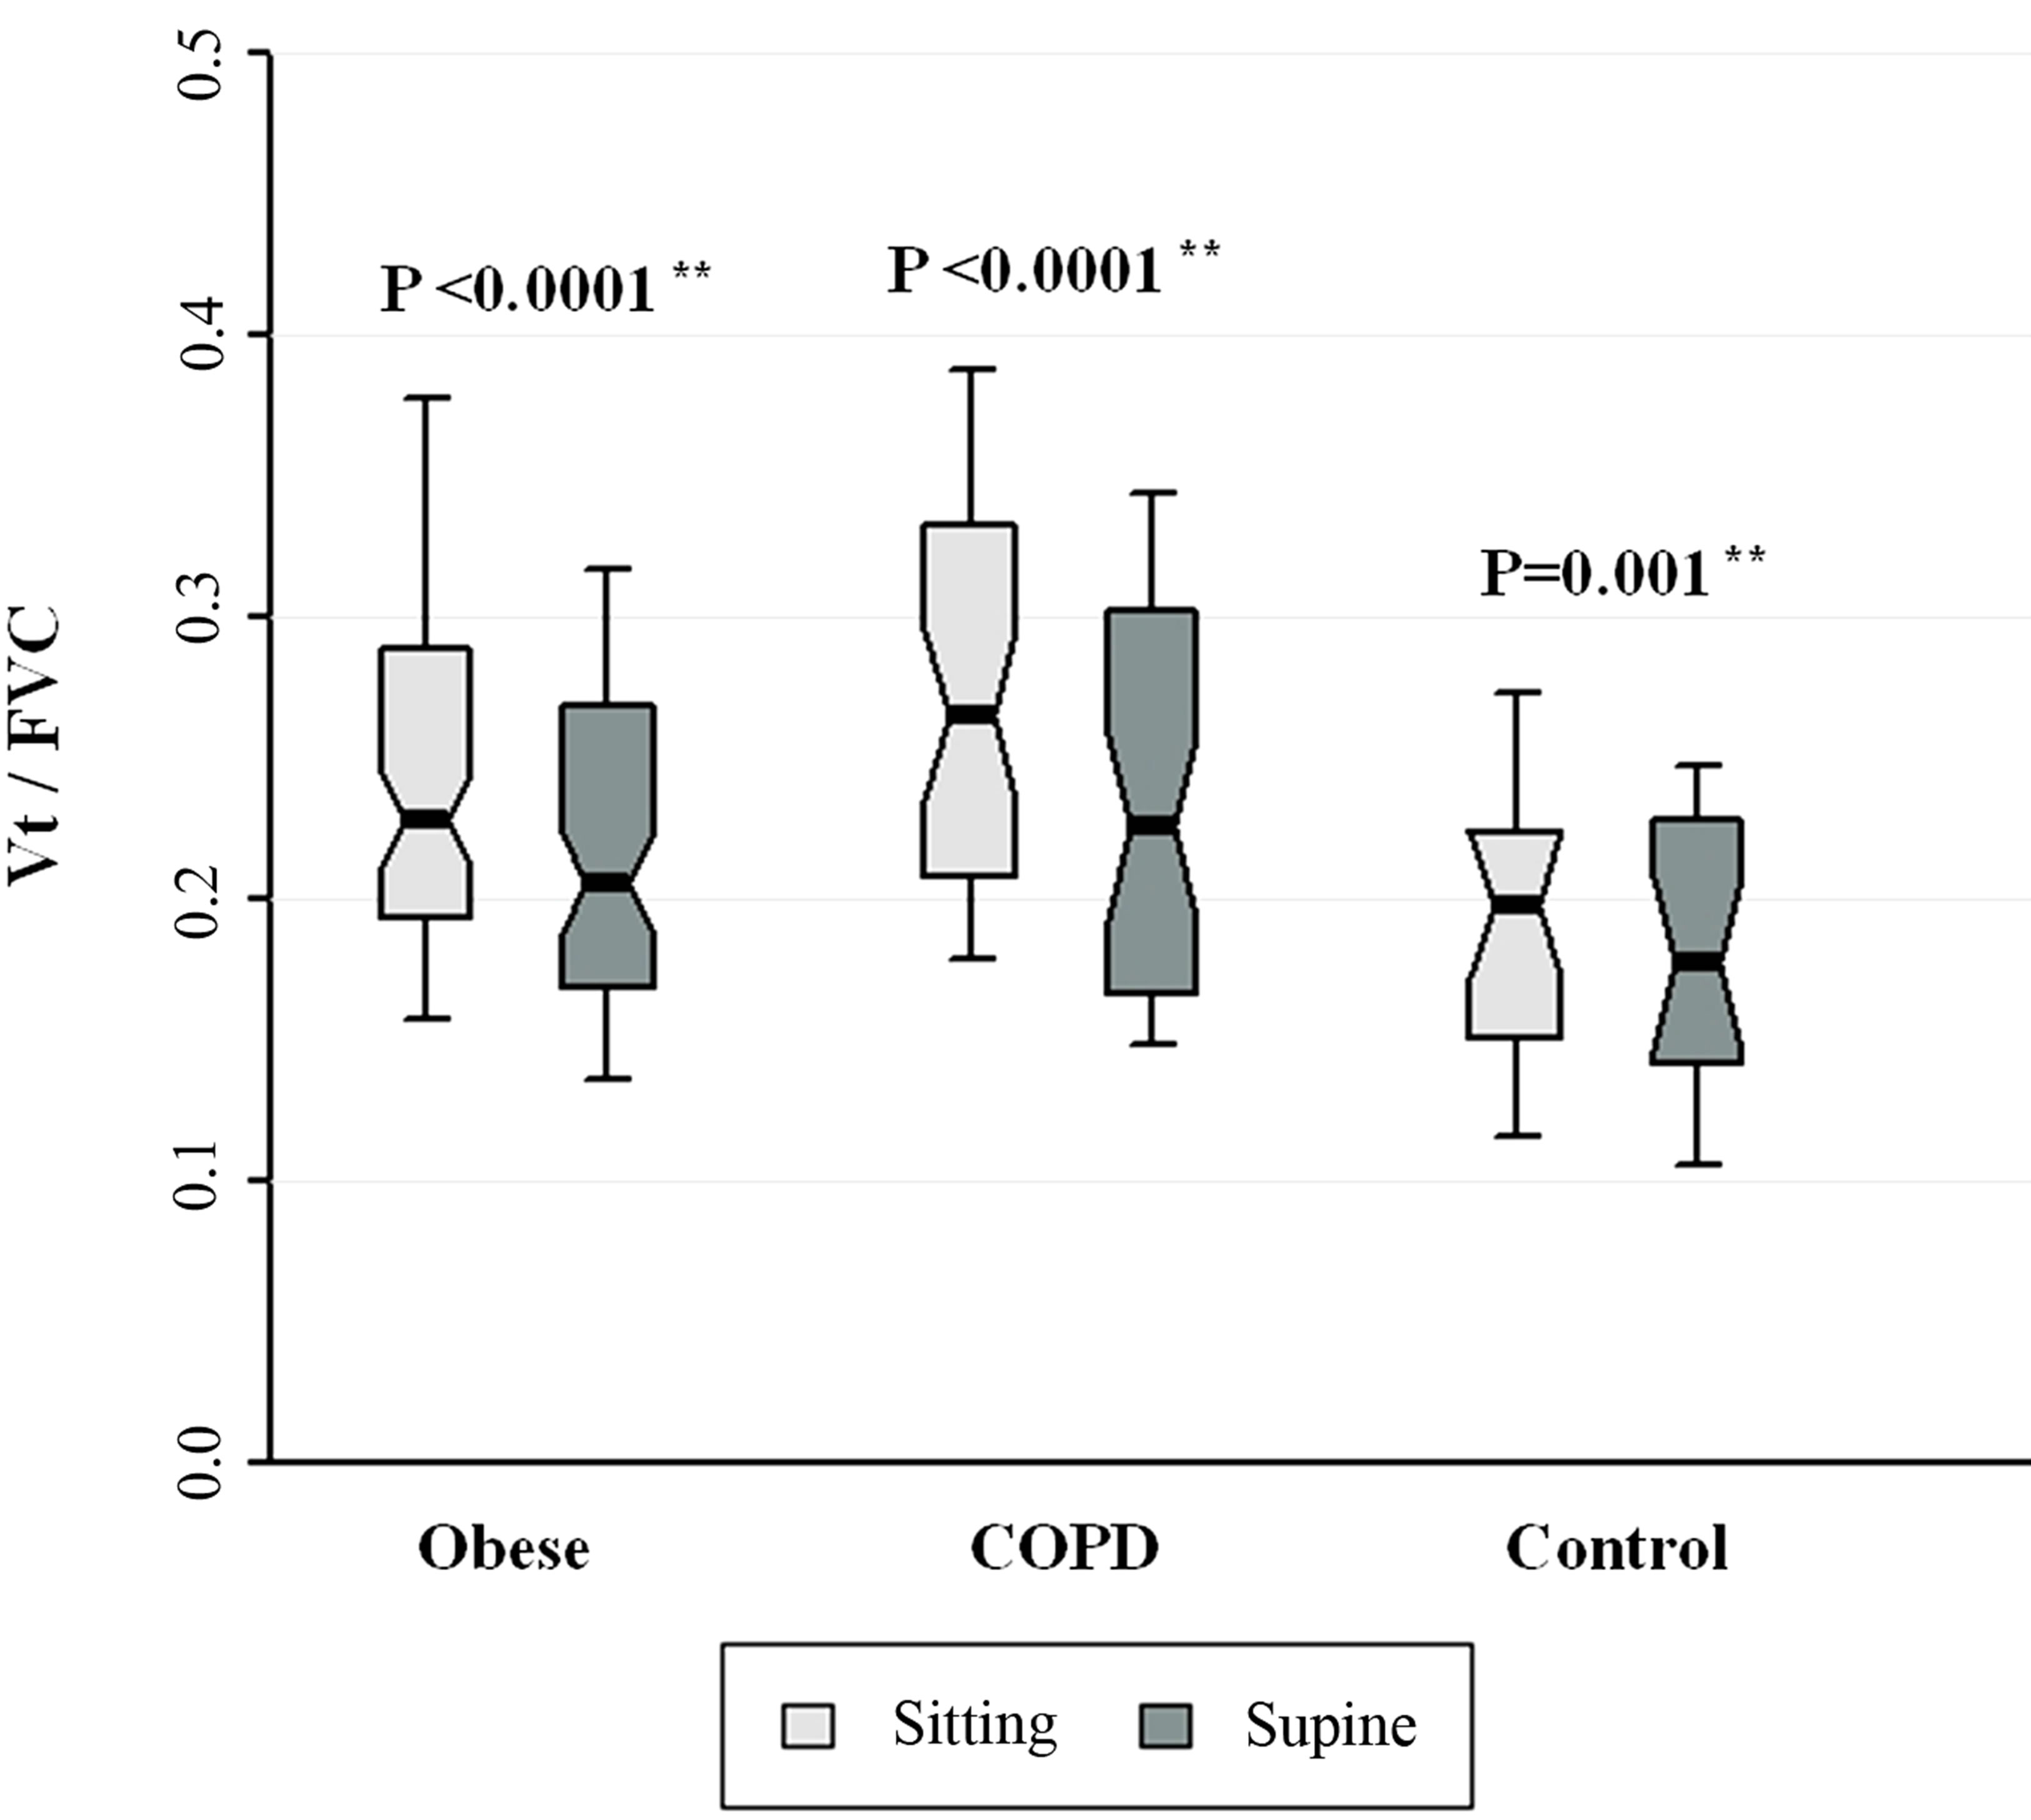
Figure 2. Vt/FVC for patients with obesity, COPD, and control subjects. Each notched box represents the 25th - 75th percentile; internal line indicates the median; whiskers indicate the 10th and 90th percentiles. Notches extend to +/ −1.58 inter-quartile range/n1/2. Notches that do not overlap suggest strong evidence of different medians. The general linear model used to model the normal ranks of the test variable as a function of the sitting and supine groups, adjusted for age and sex, showed no significant differences amongst cohorts in the sitting posture, P = 0.246, or in the supine posture, P = 0.477. **Wilcoxon signed rank test (non-parametric paired-sample t-test) for comparisons between sitting and supine positions in each cohort.
minute ventilation (V’E) and BIT index were significantly greater in seated position in all 3 cohorts (all P < 0.048). Figure 6 also shows that Ti/Ttot was significantly greater in seated posture amongst obese and COPD patients. Figures 3-5 show that age-, sex-adjusted medians were significantly different amongst cohorts in both postures for Ti, Ttot, and Vt/Ti, respectively (all P < 0.012). Additionally, Figure 7 shows that age-, sex-adjusted medians V’E were significantly different amongst seated cohorts (P = 0.022). Figure 8 shows that BIT index did not differ significantly amongst cohorts in either posture (P > 0.08 for both postures). Similarly, in supine position, Ti/Ttot and V’E did not differ significantly amongst cohorts.
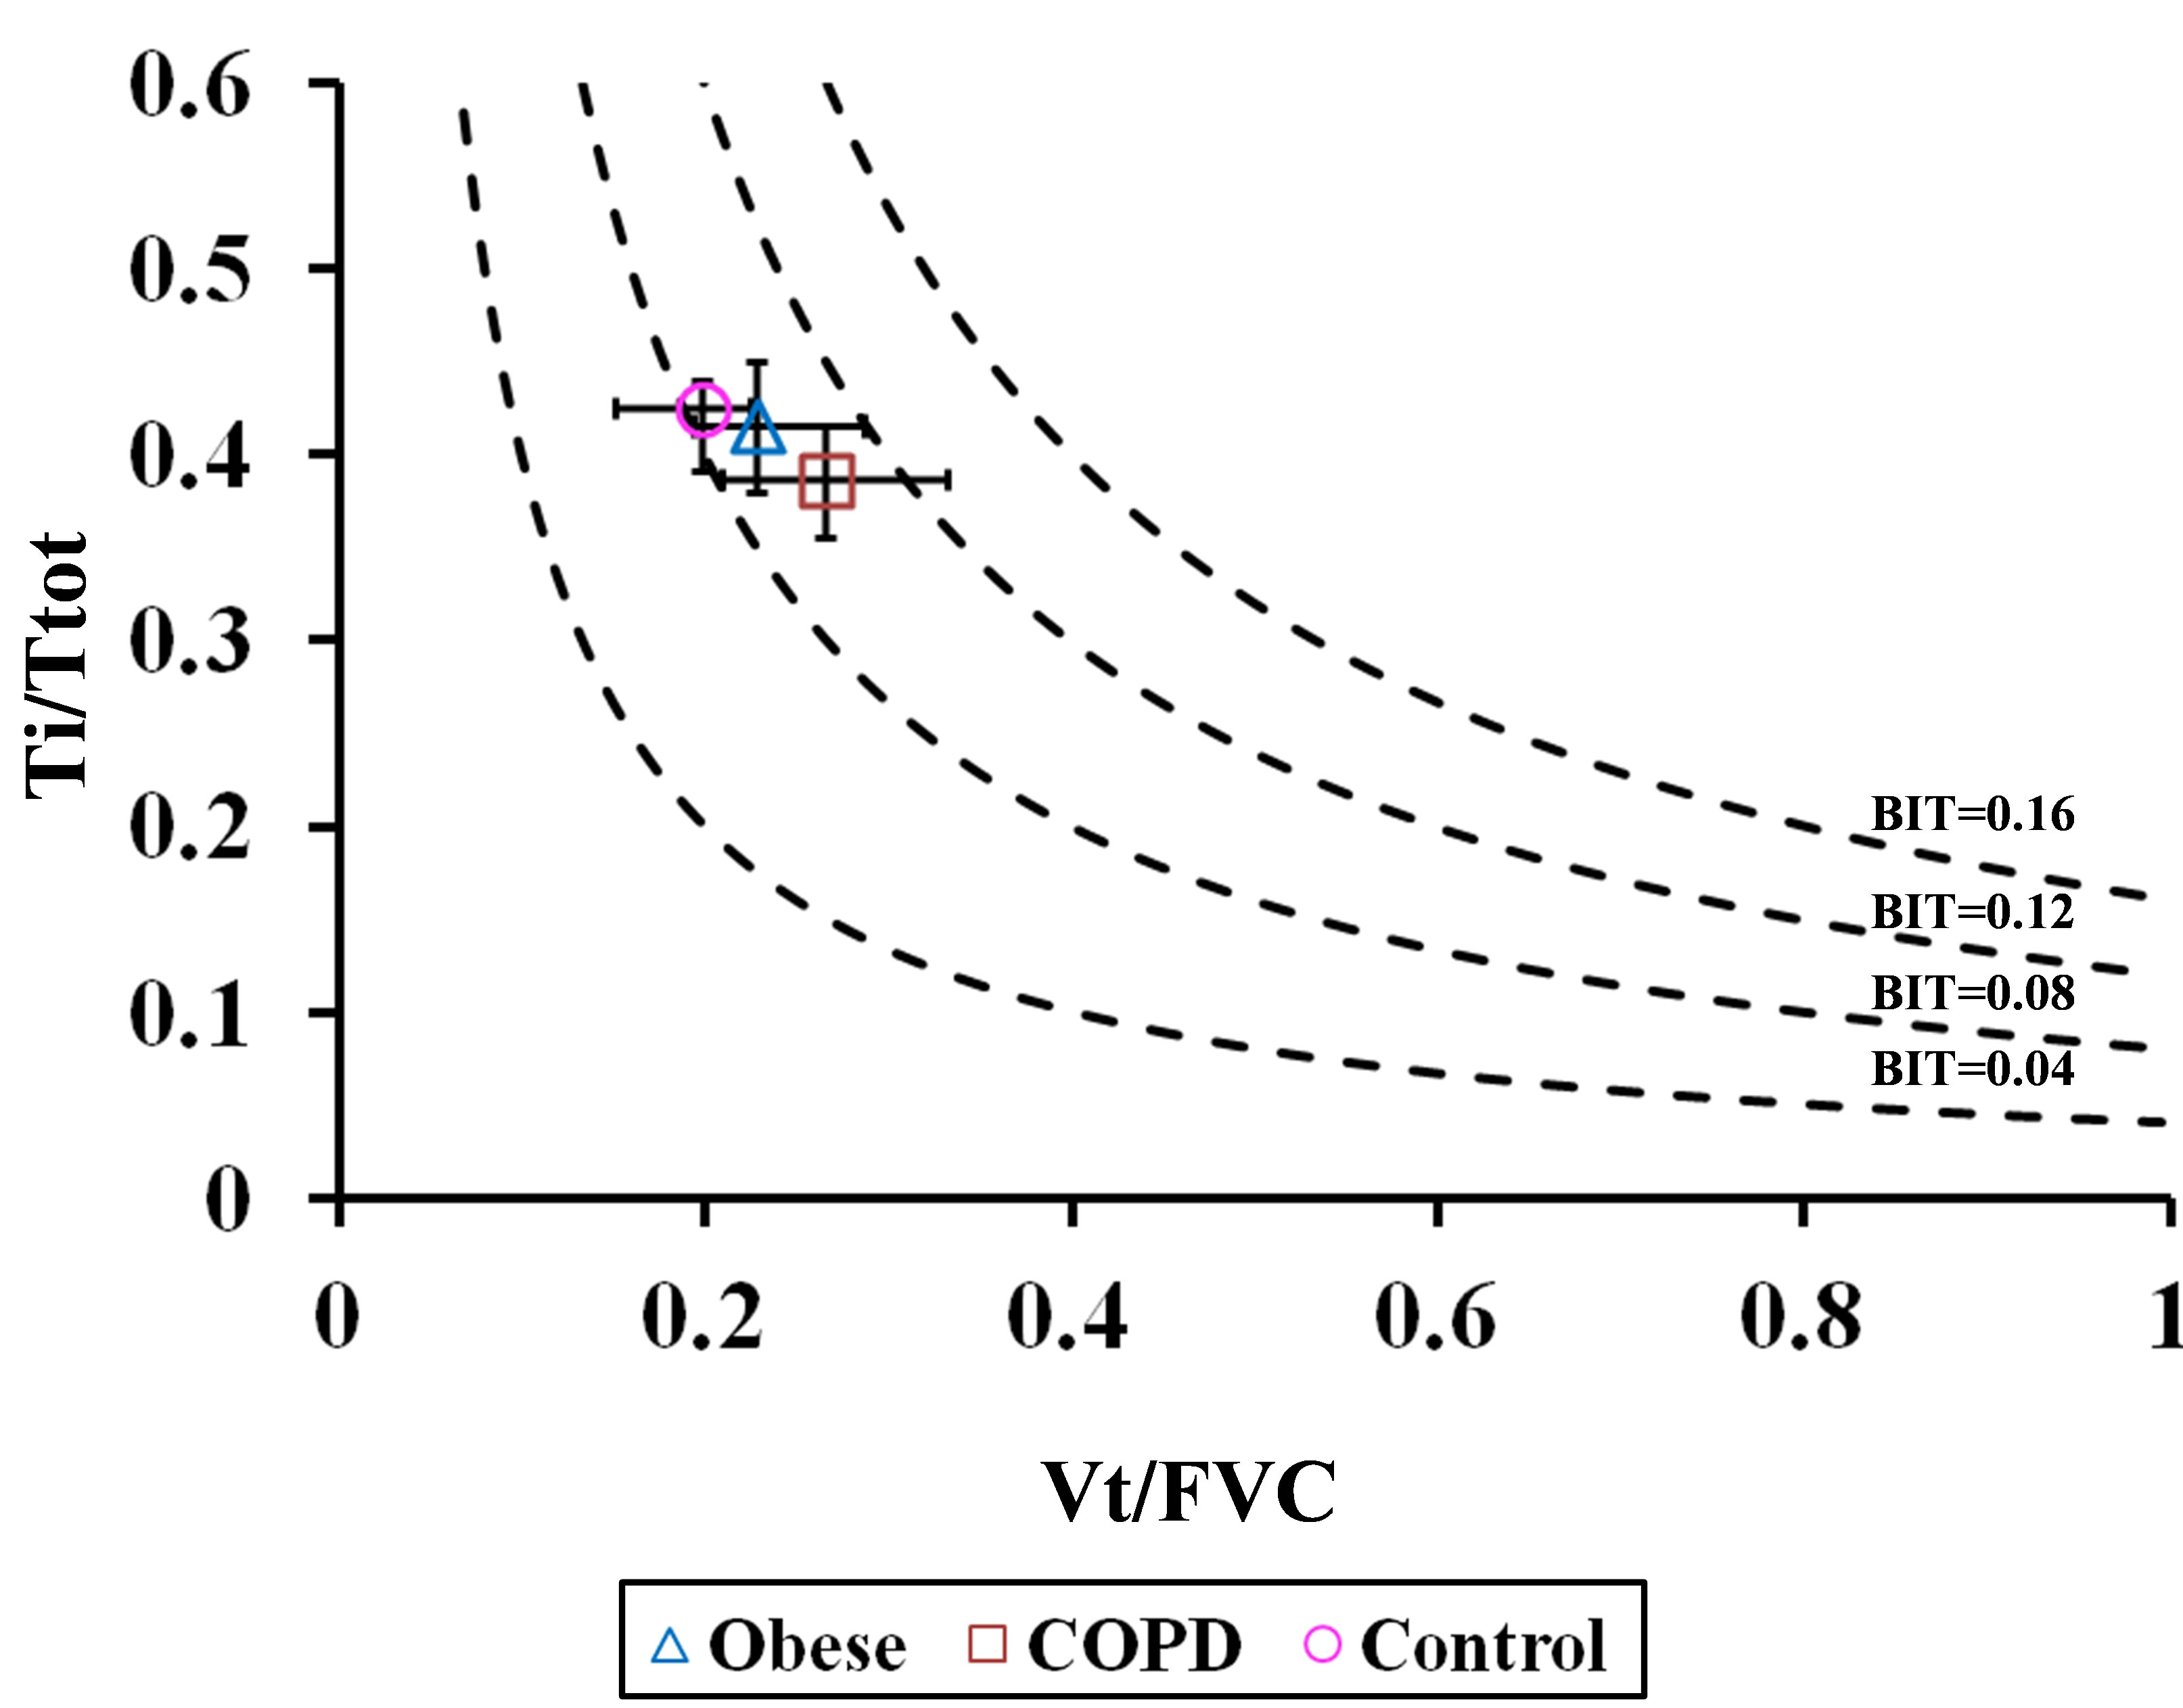
The ability of the BIT index to assess respiratory impairment in each cohort was depicted by iso-BIT index graphs (similar to the iso-diaphragmatic tension-time plot of Bellemare and Grassino [1]) in which Ti/Ttot was plotted against Vt/FVC, with BIT isopleths ranging from 0.04 to 0.16 in seated and supine postures (Figures 9(a) and (b), respectively). We assumed there was no significant postural change in FVC, as reported by others in healthy subjects [6-8] and in patients with obesity [9) and COPD [10]. As can be seen, obese and COPD patients tended towards higher BIT index values, suggesting a greater tendency to respiratory fatigue, although, differences amongst cohorts were not statistically significant.

Table 1. Anthropometric and physiologic data for patients with obesity, COPD and control subjects (seated posture)*.
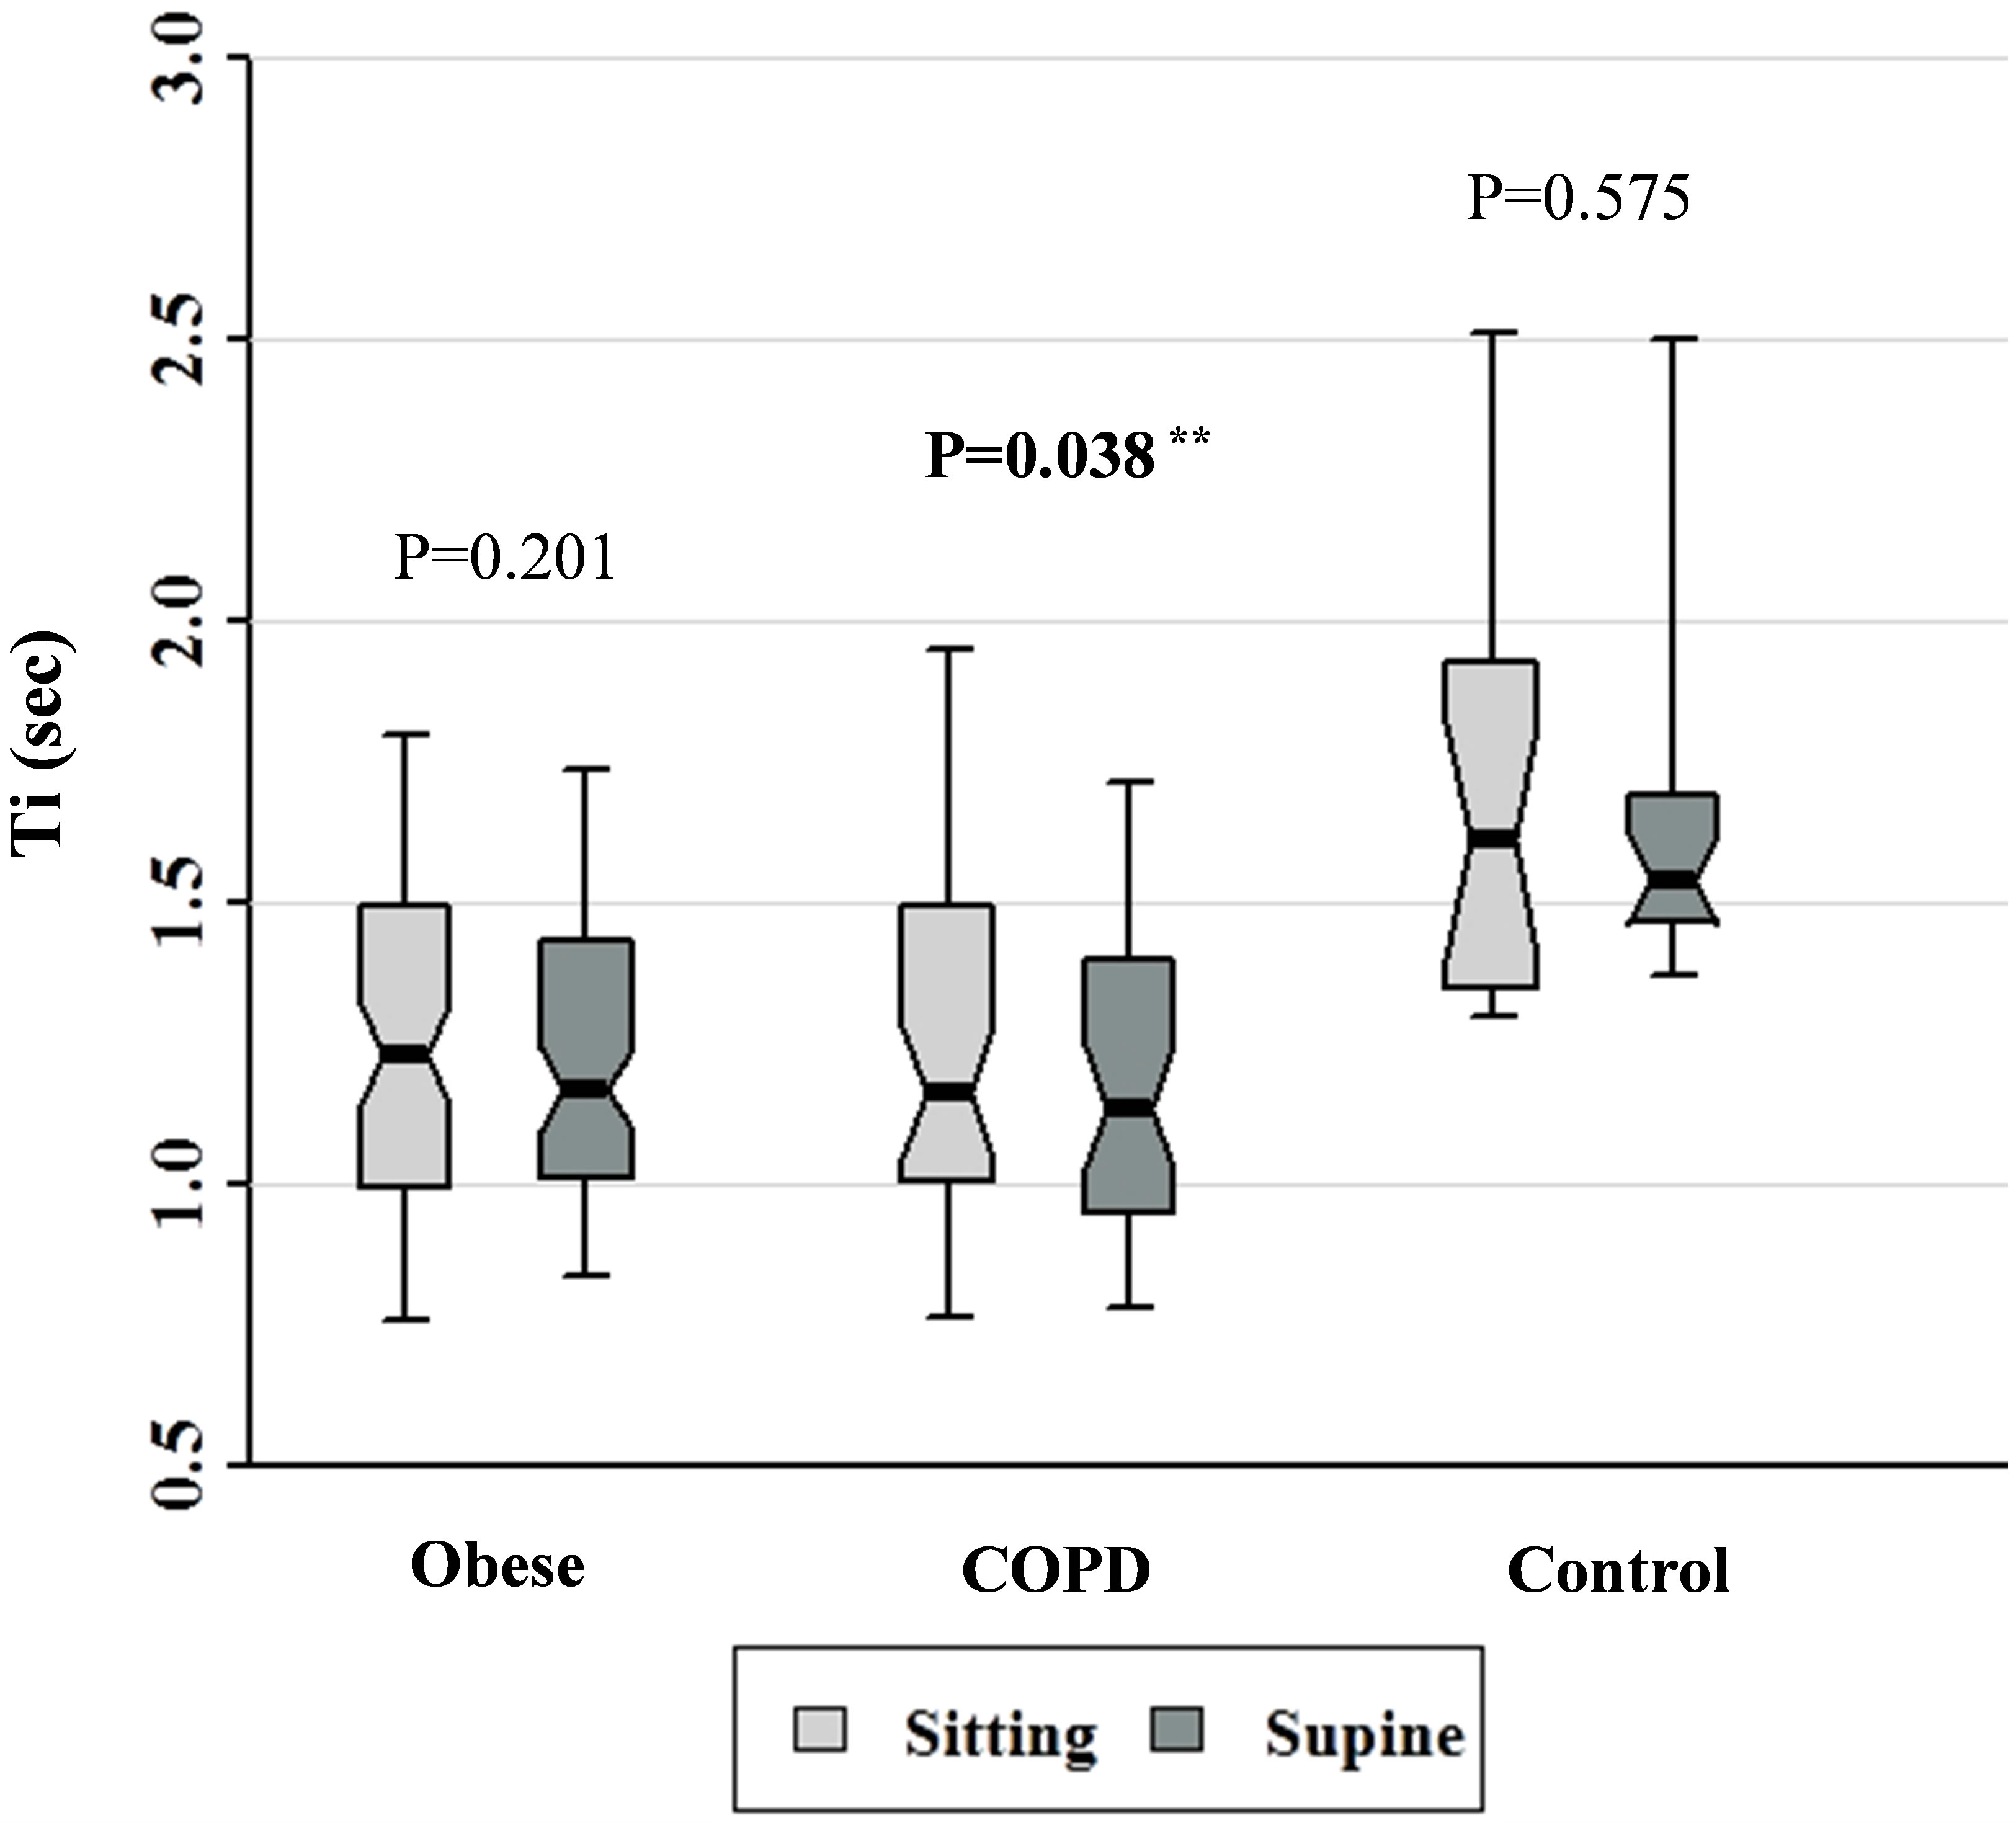
Figure 3. Ti data for patients with obesity, COPD, and control subjects. Each notched box represents the 25th - 75th percentile; internal line indicates the median; whiskers indicate the 10th and 90th percentiles. Notches extend to +/ −1.58 inter-quartile range/n1/2. Notches that do not overlap suggest strong evidence of different medians. The general linear model used to model the normal ranks of the test variable as a function of the sitting and supine groups, adjusted for age and sex, showed significant differences amongst cohorts in the sitting posture, P = 0.001, and amongst cohorts in the supine posture, P = 0.0003. **Wilcoxon signed rank test (non-parametric paired-sample t-test) for comparisons between sitting and supine positions in each cohort.
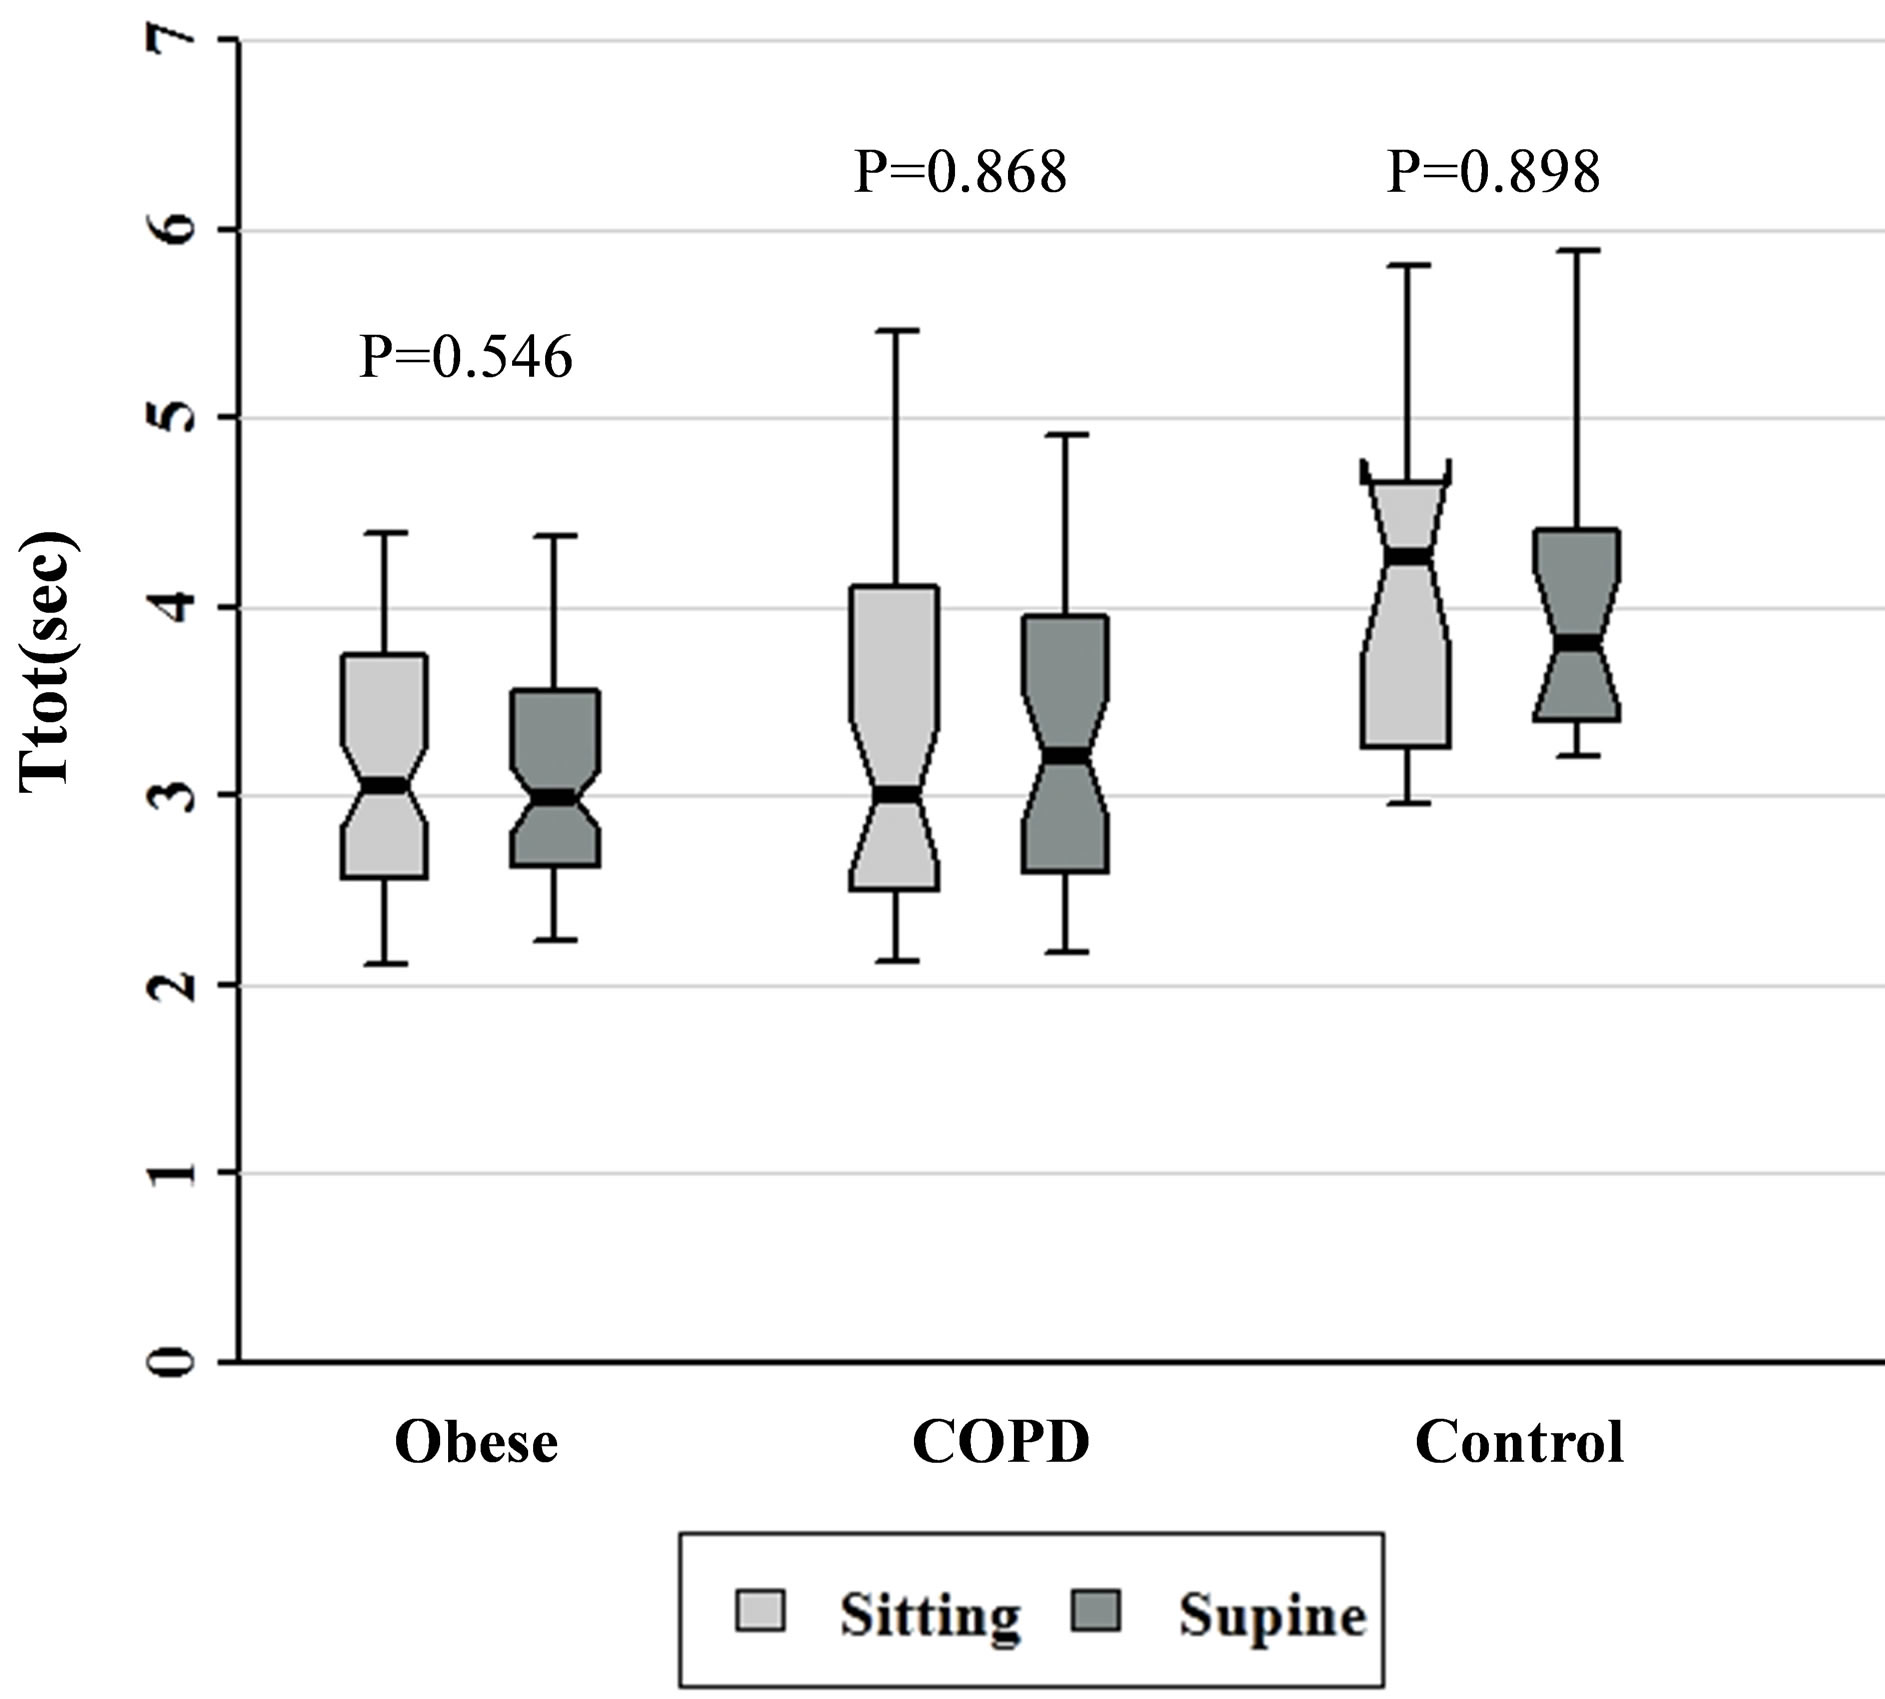
Figure 4. Ttot data for patients with obesity, COPD, and control subjects. Each notched box represents the 25th - 75th percentile; internal line indicates the median; whiskers indicate the 10th and 90th percentiles. Notches extend to +/ −1.58 inter-quartile range/n1/2. Notches that do not overlap suggest strong evidence of different medians. The general linear model used to model the normal ranks of the test variable as a function of the sitting and supine groups, adjusted for age and sex, showed significant differences amongst cohorts in the sitting posture, P = 0.003, and amongst cohorts in the supine posture, P = 0.002.
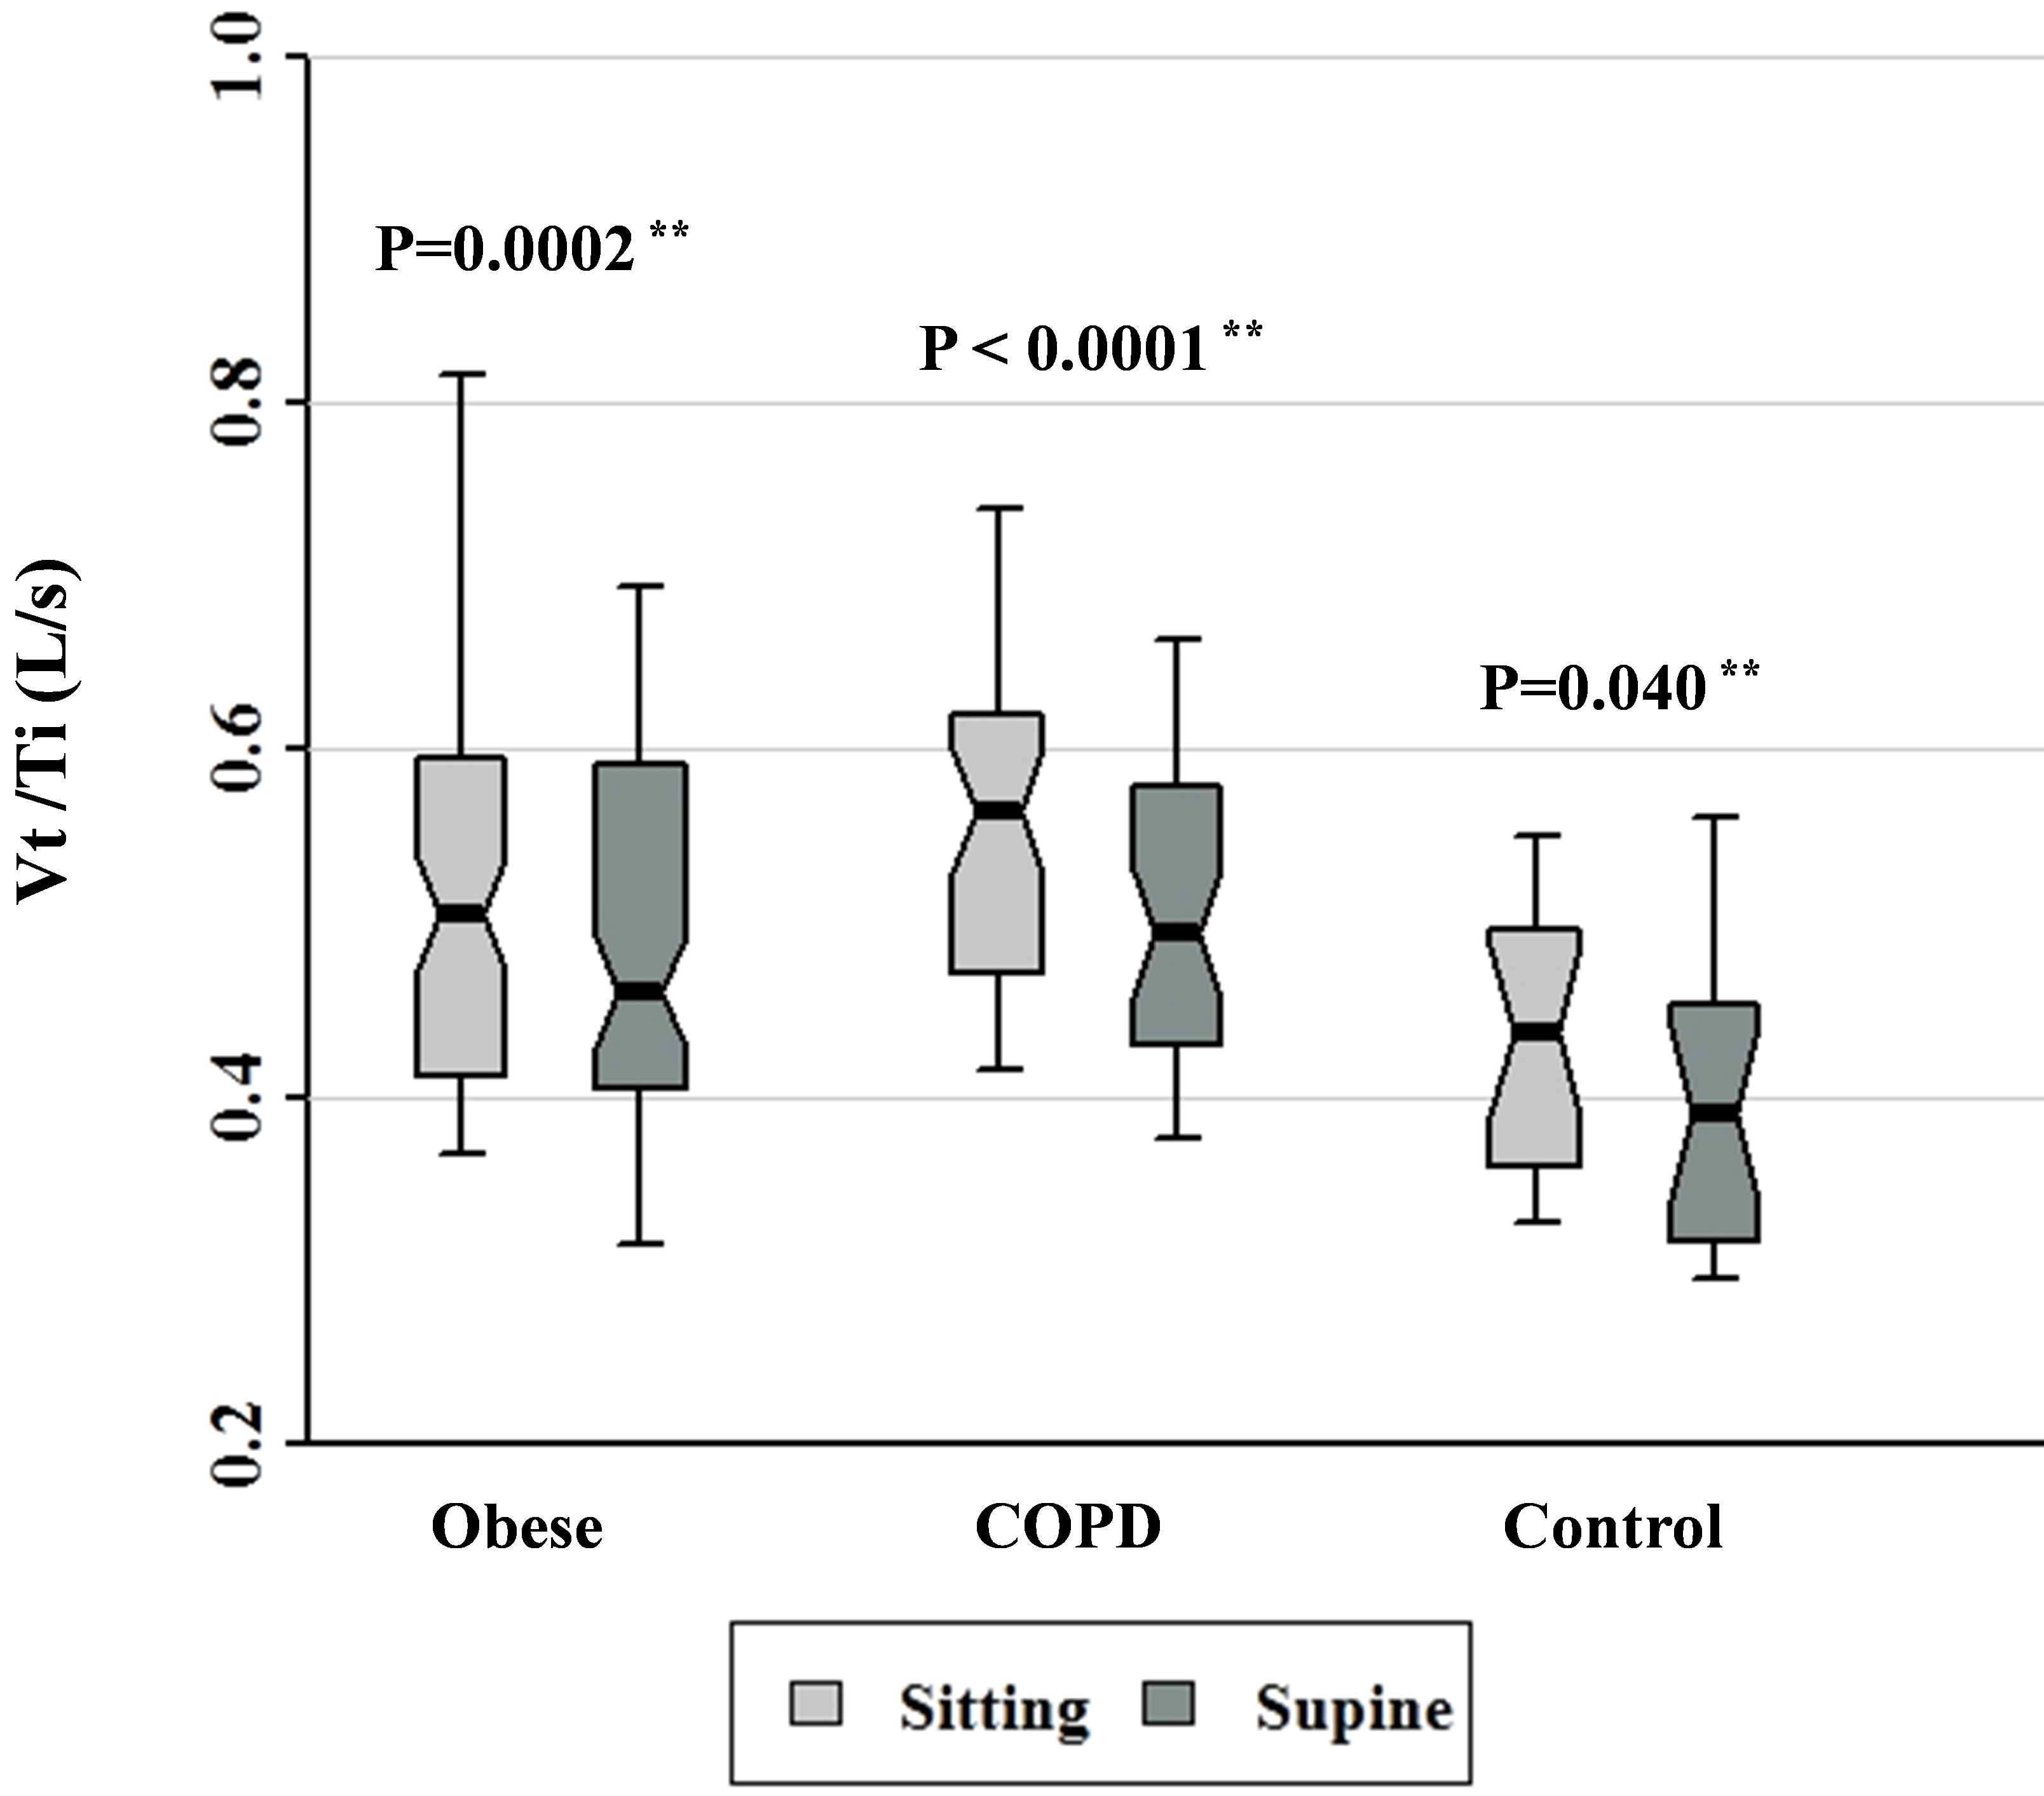
Figure 5. Vt/Ti data for patients with obesity, COPD, and control subjects. Each notched box represents the 25th - 75th percentile; internal line indicates the median; whiskers indicate the 10th and 90th percentiles. Notches extend to +/ −1.58 inter-quartile range/n1/2. Notches that do not overlap suggest strong evidence of different medians. The general linear model used to model the normal ranks of the test variable as a function of the sitting and supine groups, adjusted for age and sex, showed significant differences amongst cohorts in the sitting posture, P = 0.012, and amongst cohorts in the supine posture, P = 0.011. **Wilcoxon signed rank test (non-parametric paired-sample t-test) for comparisons between sitting and supine positions in each cohort.

Figure 6. Ti/Ttot data for patients with obesity, COPD, and control subjects. Each notched box represents the 25th - 75th percentile; internal line indicates the median; whiskers indicate the 10th and 90th percentiles. Notches extend to +/ −1.58 inter-quartile range/n1/2. Notches that do not overlap suggest strong evidence of different medians. The general linear model used to model the normal ranks of the test variable as a function of the sitting and supine groups, adjusted for age and sex, showed no significant differences amongst cohorts in the sitting posture, P = 0.071, and amongst cohorts in the supine posture, P = 0.228. **Wilcoxon signed rank test (non-parametric paired-sample t-test) for comparisons between sitting and supine positions in each cohort.
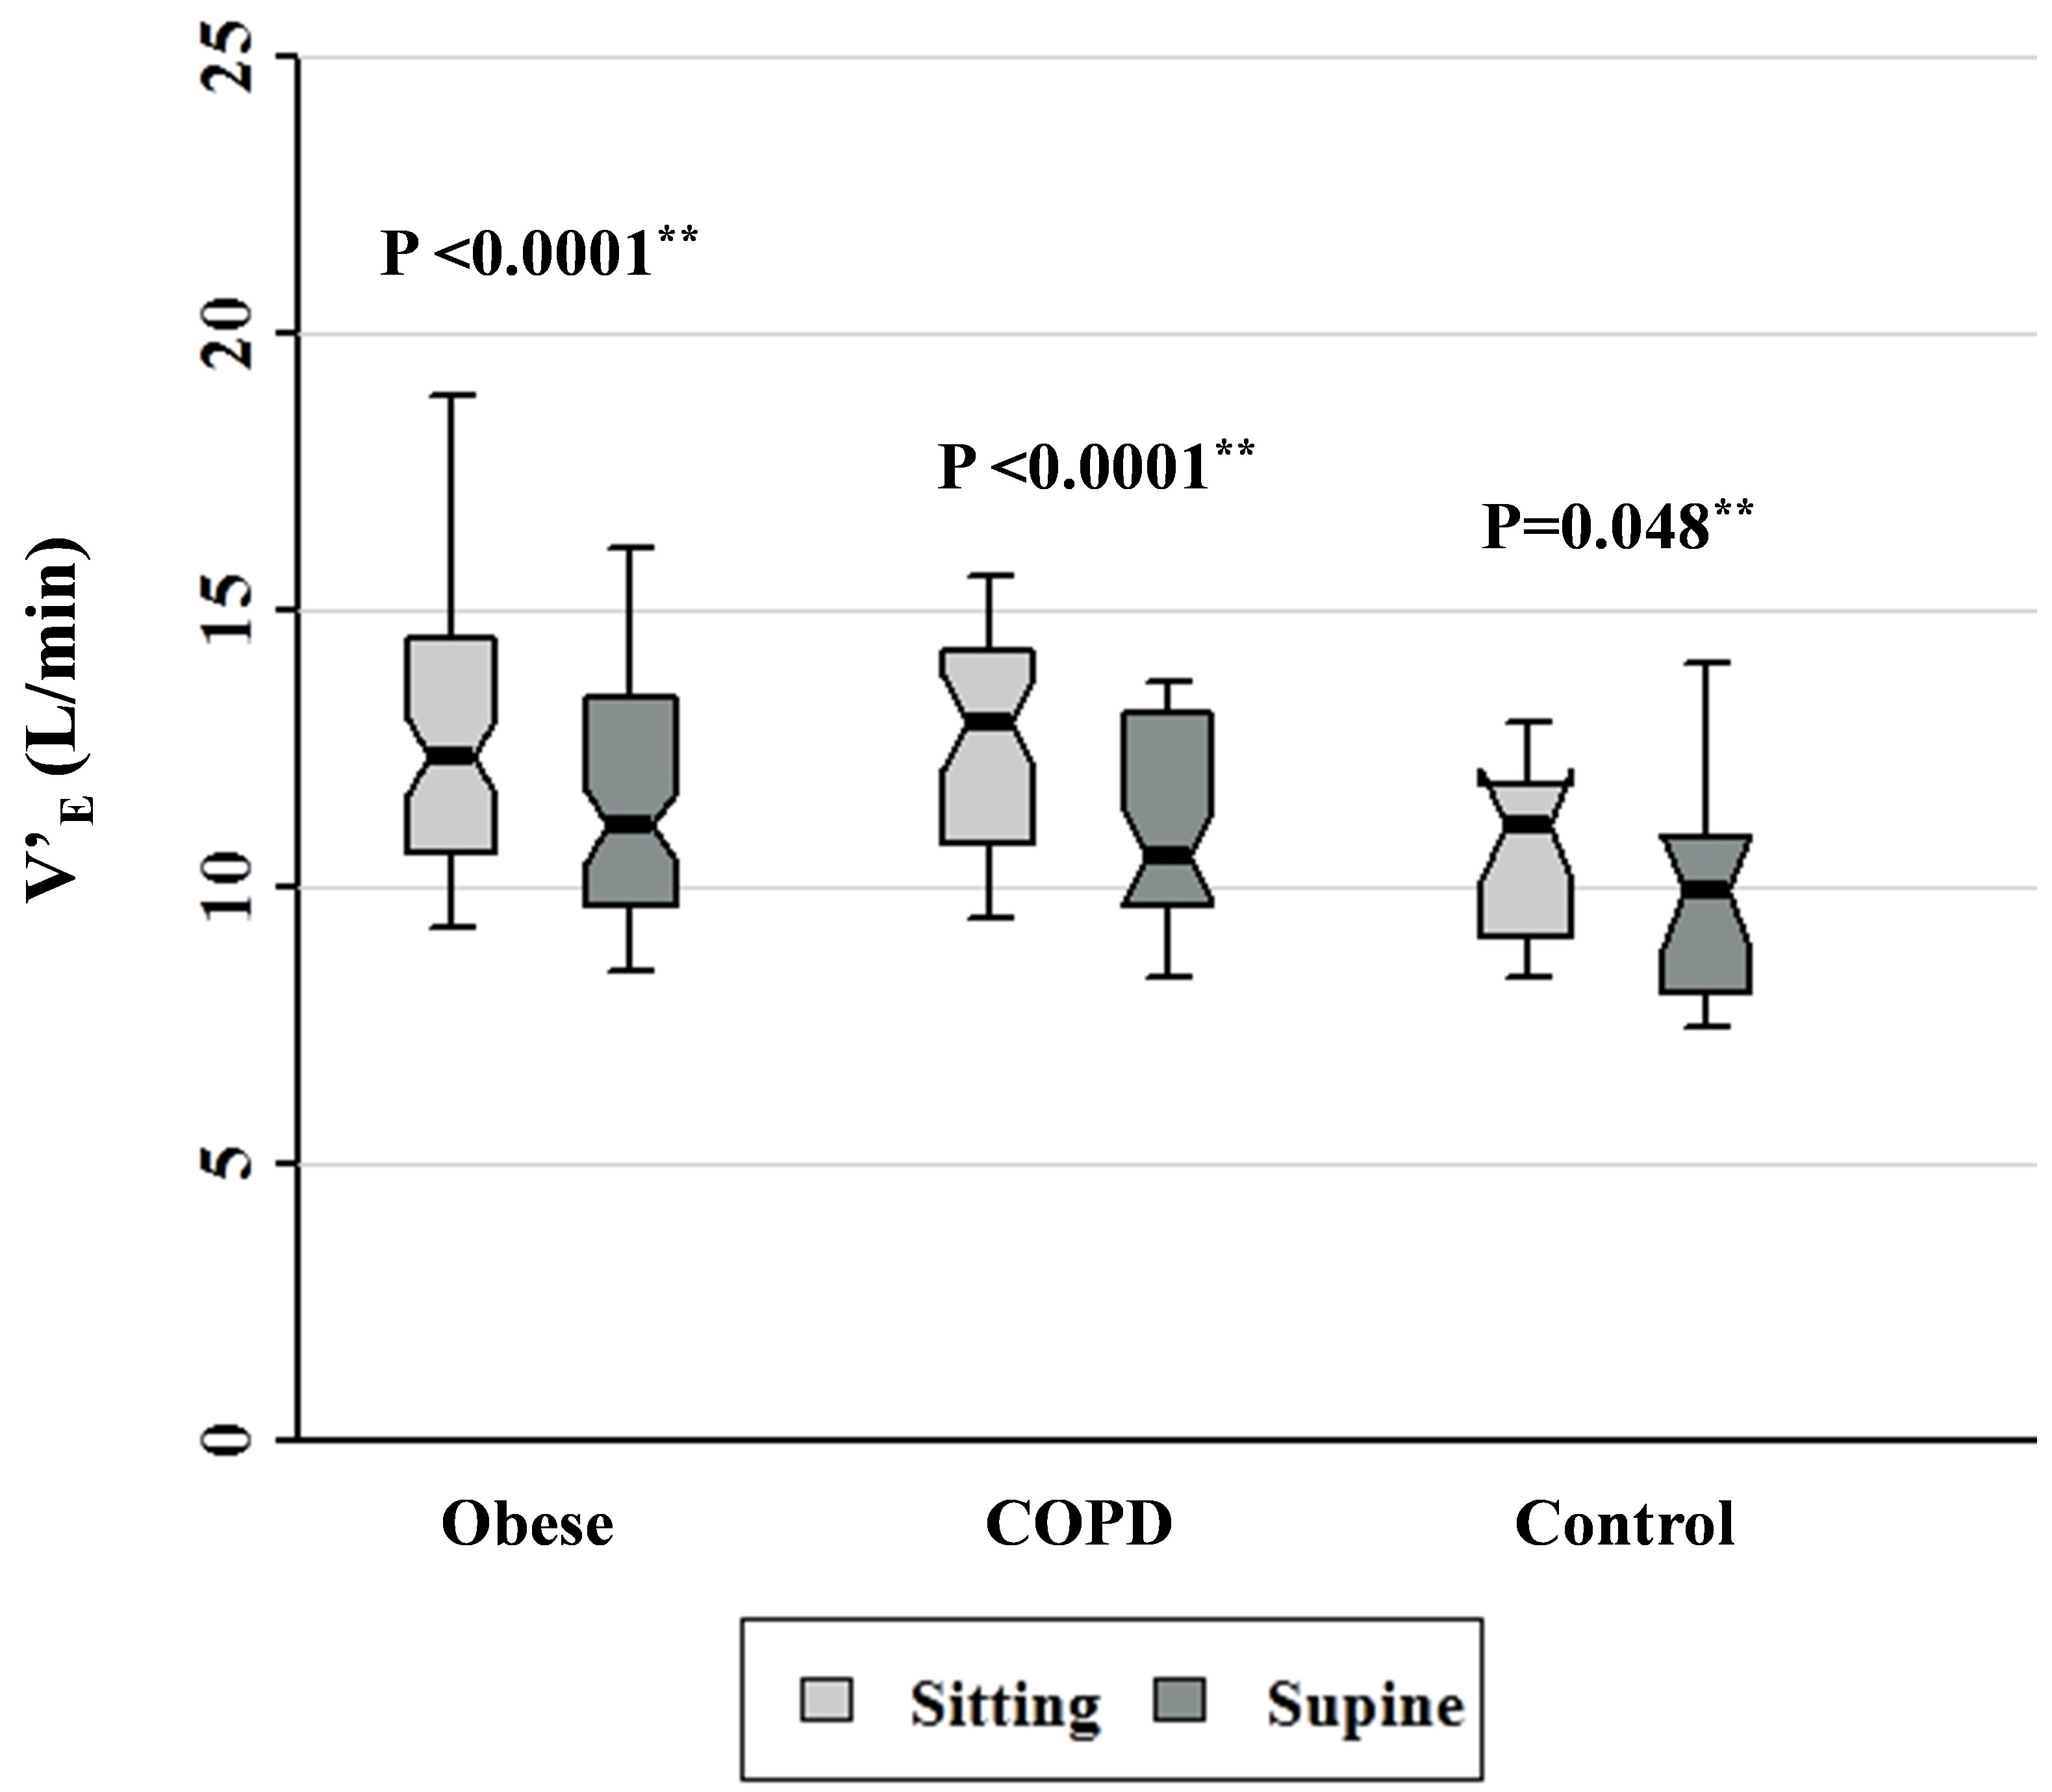
Figure 7. Minute ventilation data for patients with obesity, COPD, and control subjects. Each notched box represents the 25th - 75th percentile; internal line indicates the median; whiskers indicate the 10th and 90th percentiles. Notches extend to +/−1.58 inter-quartile range/n1/2. Notches that do not overlap suggest strong evidence of different medians. The general linear model used to model the normal ranks of the test variable as a function of the sitting and supine groups, adjusted for age and sex, showed significant differences amongst cohorts in the sitting posture, P = 0.022, and borderline significant amongst cohorts in the supine posture, P = 0.062. **Wilcoxon signed rank test (non-parametric pairedsample t-test) for comparisons between sitting and supine positions in each cohort.
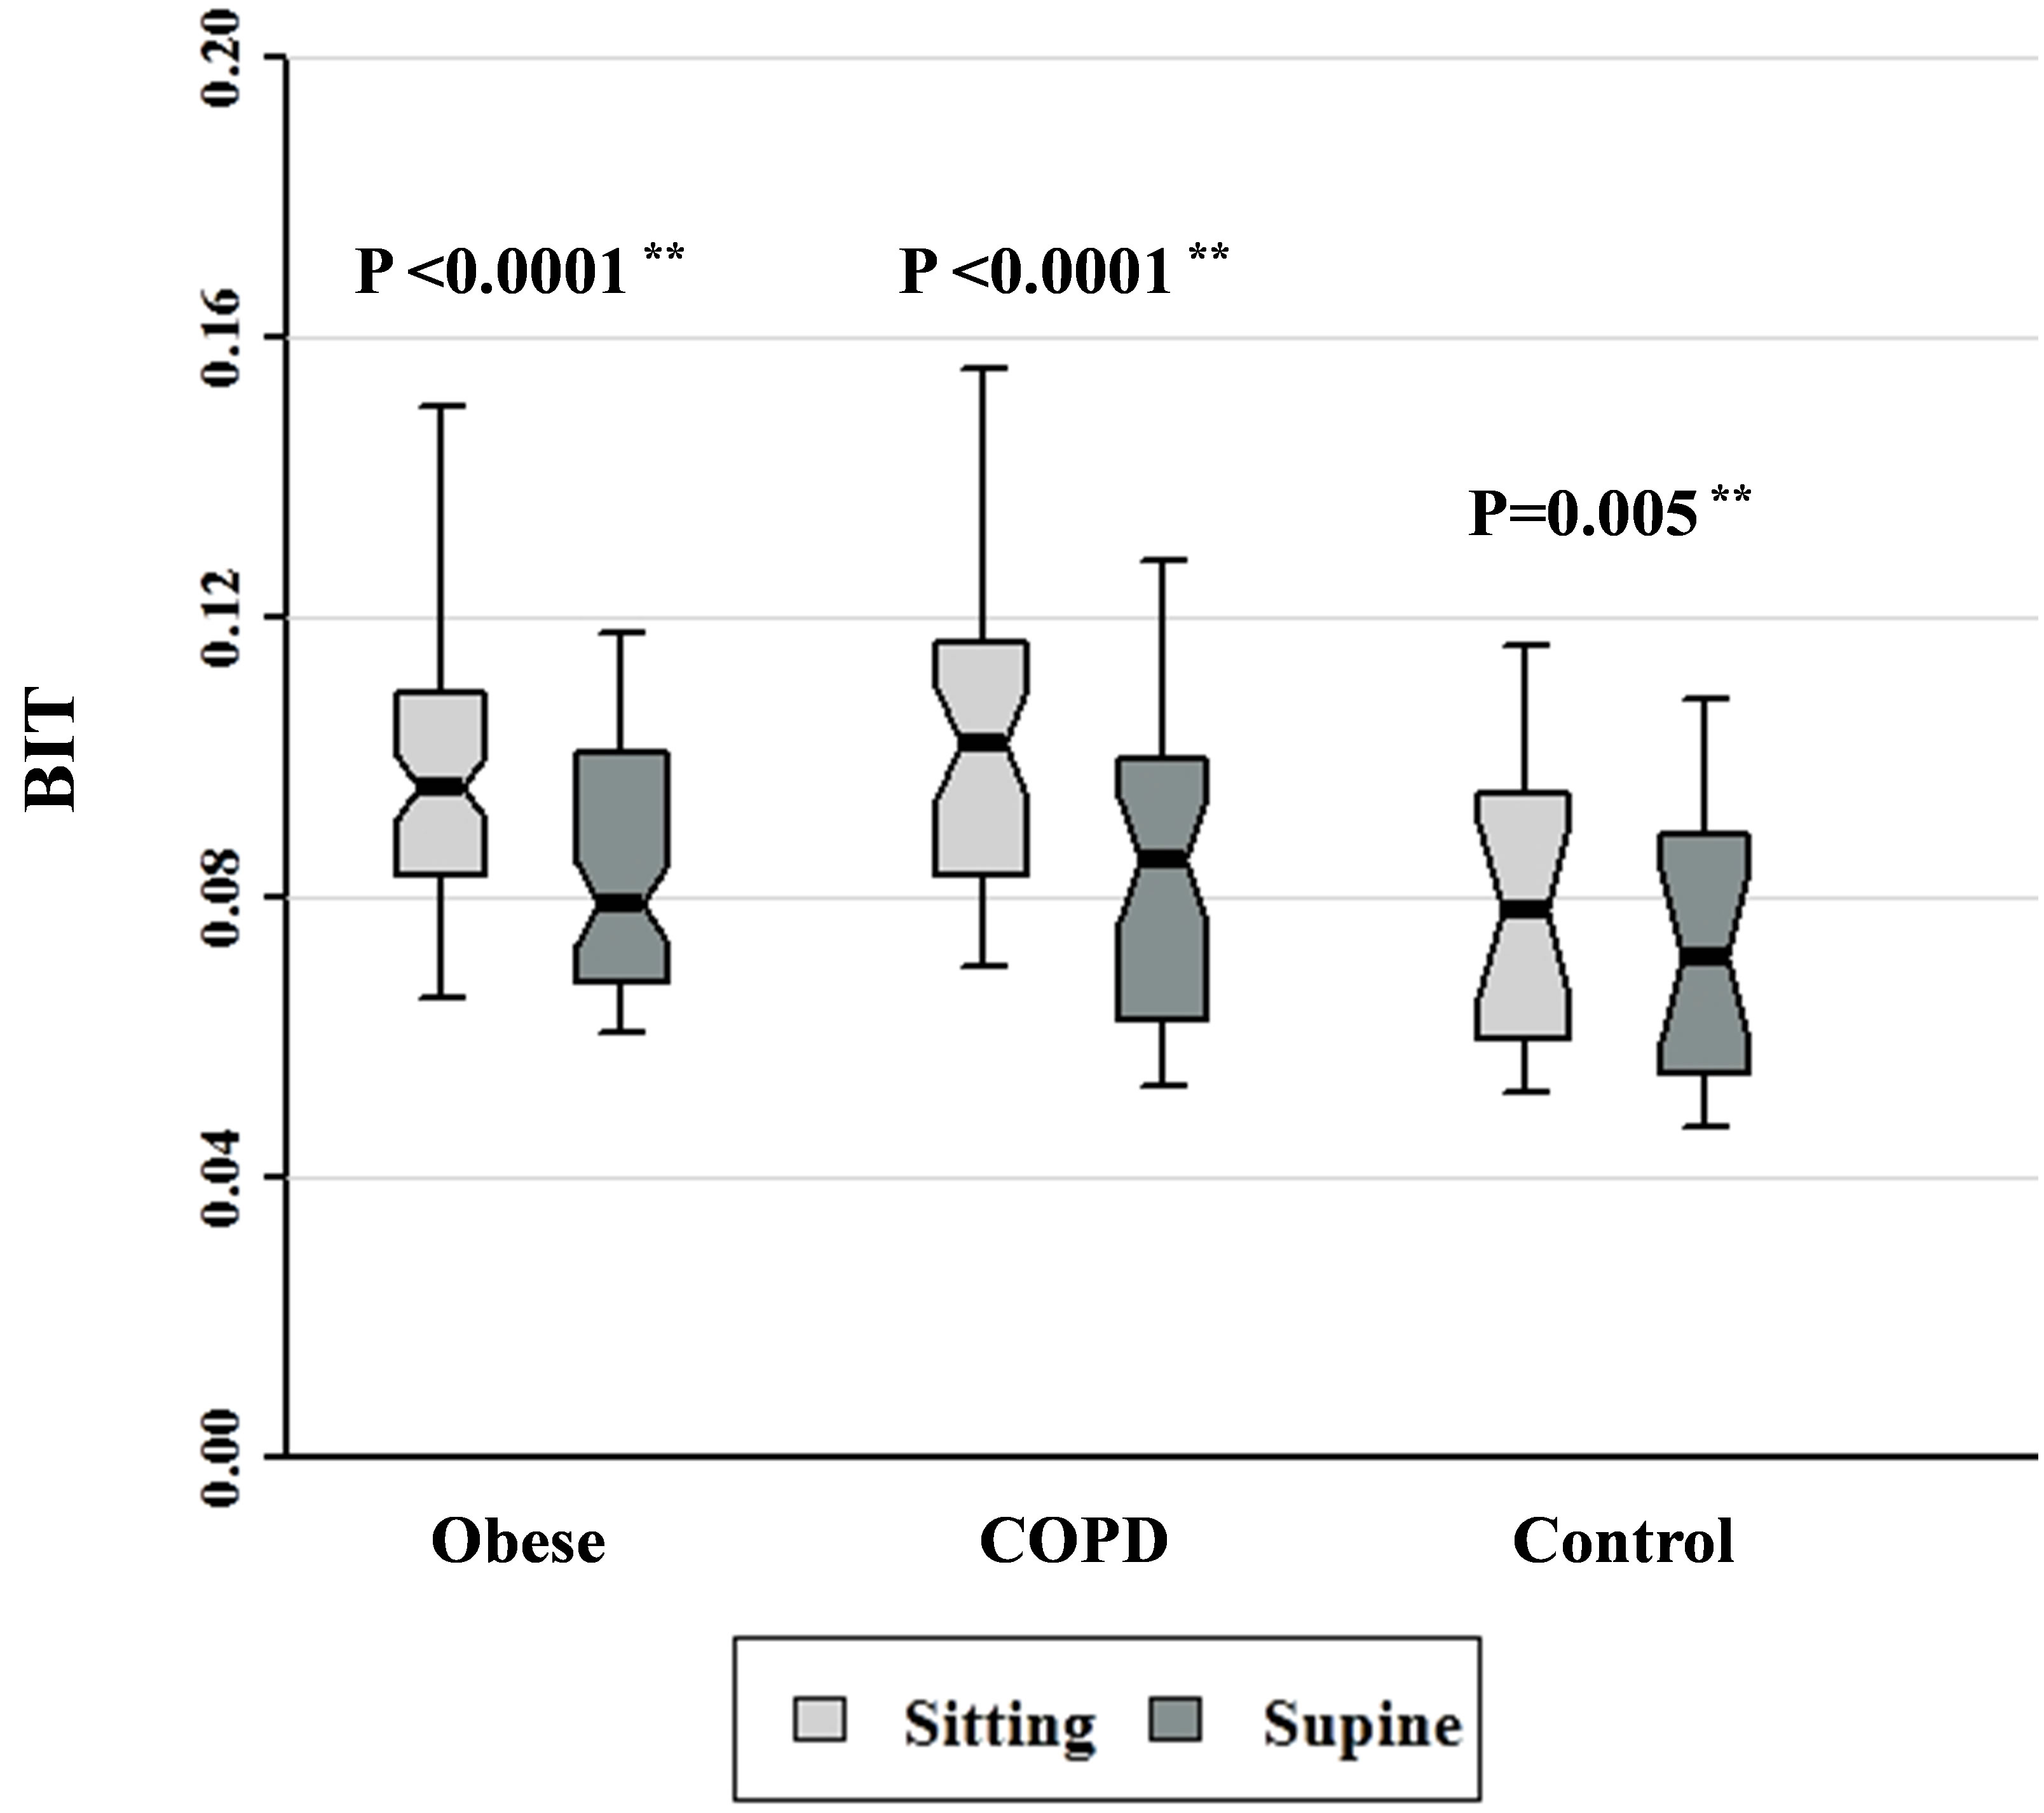
Figure 8. Breathing intolerance (BIT) index data for patients with obesity, COPD, and control subjects. Each notched box represents the 25th - 75th percentile; internal line indicates the median; whiskers indicate the 10th and 90th percentiles. Notches extend to +/−1.58 inter-quartile range/n1/2. Notches that do not overlap suggest strong evidence of different medians. The general linear model used to model the normal ranks of the test variable as a function of the sitting and supine groups, adjusted for age and sex, showed no significant differences amongst cohorts in the sitting posture, P = 0.081, or in the supine posture, P = 0.321. **Wilcoxon signed rank test (non-parametric paired-sample t-test) for comparisons between sitting and supine positions in each cohort.
 (a)
(a)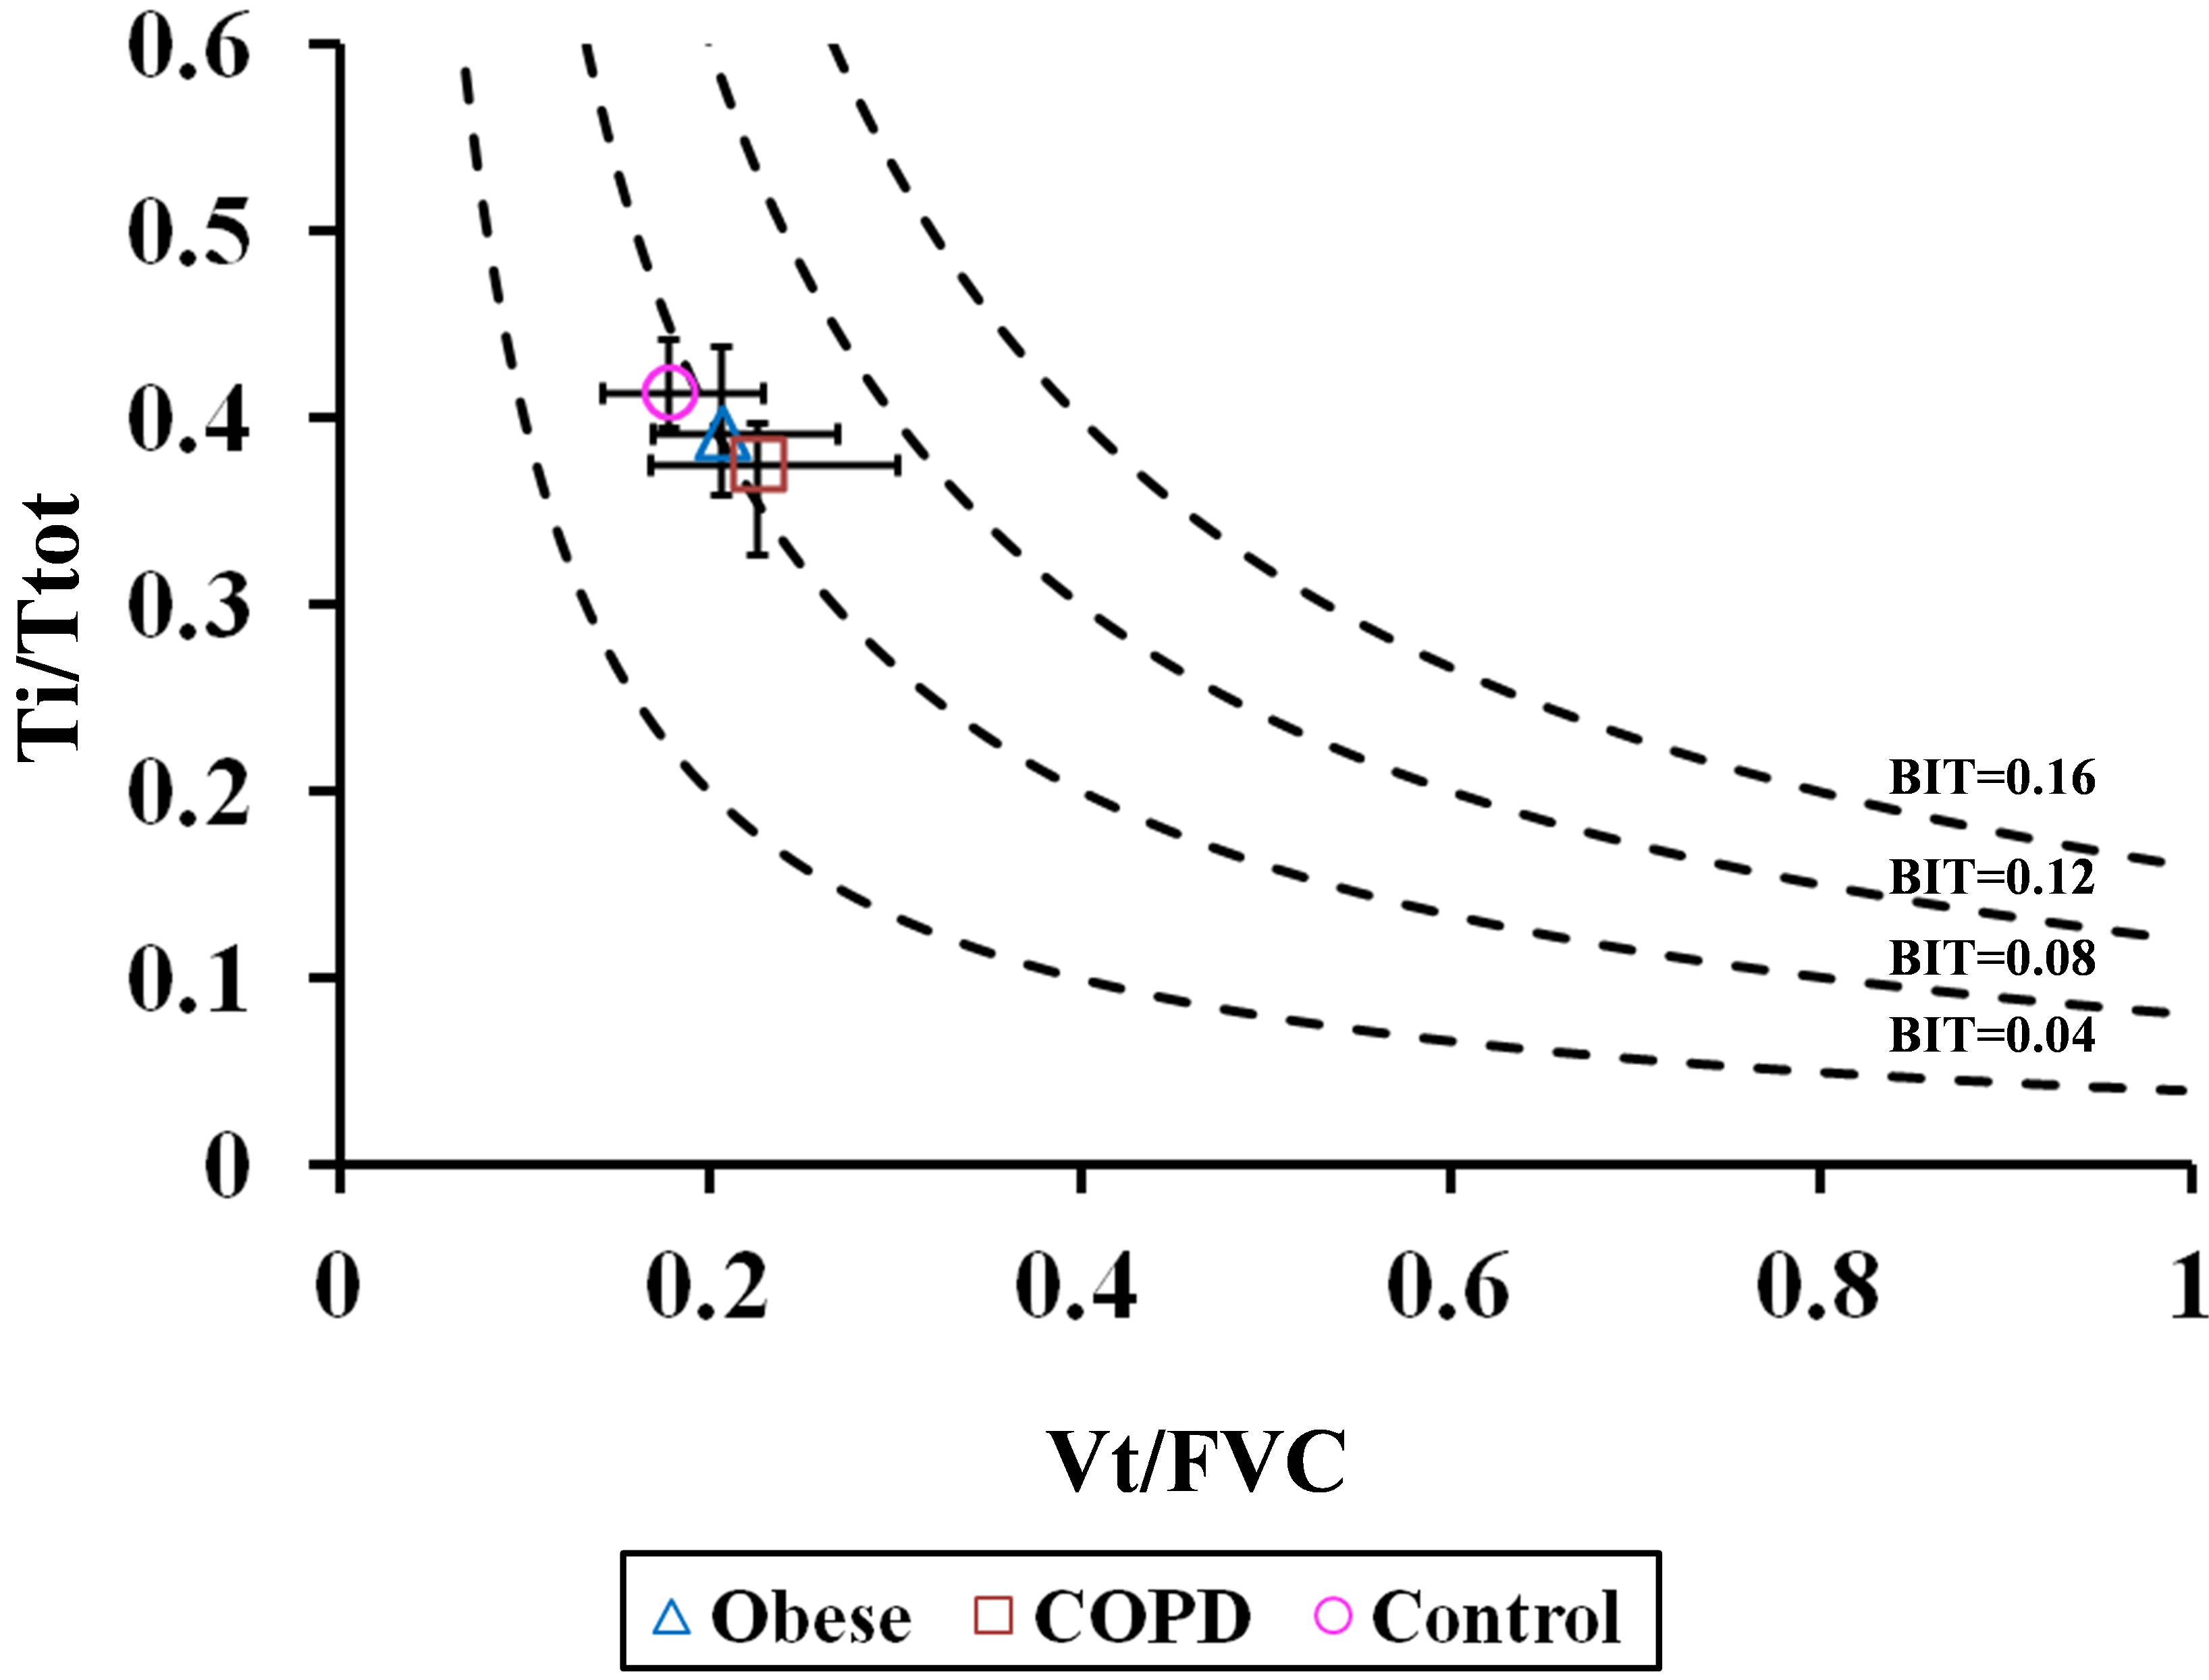 (b)
(b)
Figure 9. Ti/Ttot versus Vt/FVC in (a) seated and (b) supine positions. Diagram is similar to the iso-diaphragmatic tension-time index plot of Bellemare and Grassino [1] constructed from the data of our patients. Ordinate: inspiratory to total cycle duration ratio (Ti/Ttot); abscissa: mean tidal volume expressed as a fraction of the forced vital capacity (Vt/FVC). The product of each combination of the two variables is the breathing intolerance (BIT) index. Four isopleths are drawn for reference. Each symbol refers to the median (interquantile range) of each group during quiet breathing in seated posture.
4. Discussion
To our knowledge, this study is the first to compare BIT index amongst patients with obesity and COPD and in healthy control subjects. In addition, in the course of deriving BIT, we compared indices of ventilatory control in the 3 cohorts in seated and supine positions. The main findings are:
1) BIT index was significantly greater in seated posture in all 3 cohorts.
2) BIT index was similar in values amongst cohorts in both postures, but tended to be higher in patients with obesity and COPD.
The higher values of BIT index in seated posture can be attributed to greater values of Vt and Ti/Ttot in this posture as compared to the supine position. For purposes of computing BIT index in both postures, we assumed there was no significant postural change in FVC, as reported by others in healthy subjects [6-8] and in patients with obesity [9] and COPD [10]. Supine decline in FVC amounts to about 200 mL, or about 5% in both obese and control subjects [8,9]. Our findings of higher overall Vt and Vt/Ti in seated posture are similar to those of Weissman et al. [6] who used a noninvasive canopy system, but are in contrast to those of others who used mouthpieces to record ventilation [7,25-27]. One would expect that in supine posture, the diaphragm operates at a more advantageous portion of its length-tension curve than on the assumption of upright position which results in a shorter operating length [11,12]. Thus, neural drive to the diaphragm increases in sitting as compared to supine position [11], and this finding has been referred to as the operational length compensation of the diaphragm [13]. In our study, other factors may have increased respiratory drive in the seated posture, such as a change in the “setting” of the control system, changes in cardiac output, thoracoabdominal position, and/or proprioceptive stimuli generated by postural change, or a decrease in cerebral blood flow in the erect position [14]. Regardless of the mechanism, a progressive increase in ventilatory drive (with resulting higher values of Vt and BIT index) in seated posture would lead to respiratory muscle fatigue in the presence abnormal respiratory mechanics without appropriate compensatory mechanisms. Such an occurrence is understandable in patients with COPD in which lung hyperinflation produces shortening of diaphragmatic fibers. Leaning forward (or “tripodding”) displaces the diaphragm cephalad and stretches its resting length, resulting in greater force generation with a reciprocal decrease in central drive. In this connection, Ti/Ttot was lower in supine posture, at least in the obese and COPD subjects, a finding that can be explained on the basis of increased airway resistance and reactance [8,9], prolonging expiration (i.e., shorter Ti, Figure 3, obese and COPD groups), in the absence of a change in Ttot with posture (Figure 4).
In obese and COPD patients, we found values of Ti and Ttot to be lower than, and Vt/Ti and V’E higher than corresponding values in control subjects. Similar results were described by Šorli et al. [20] in patients with COPD and are explained by dynamic compression of airways during expiration, and the increased respiratory elastance and resistance in obese subjects [28]. Accordingly, a relative decrease in Ti in relation to TE is not surprising in our COPD and obese subjects, as found in the studies of Šorli et al. [20] and Chlif et al. [28], respectively. Similarly, V’E was significantly higher in our obese and COPD subjects than in control subjects, findings also described by Šorli et al. [20] and Chlif et al. [28]. The latter authors confirmed that mean occlusion pressure at 0.1 sec (P0.1) in their resting obese subjects was nearly twice as high as in controls despite a mean maximal inspiratory pressure that was only 59% of control values. Such increased work of breathing in the face of respiratory loading is likely to result in reduced respiratory reserve, increased fatigue and likelihood of requiring assisted ventilation, such as with obesity-hypoventilation syndrome, congestive heart failure or acute respiratory infection. Indeed, in the study of Chlif et al. [28], using the P0.1 method, the tension-time index of obese subjects was 3-fold higher than control values and close to the critical zone in which breathing leads to diaphragmatic fatigue [1,29].
There are a number of limitations to our study. Since we did not measure tension-time index as defined by Romanatxo et al. [2], we did not record P0.1 and so could not directly measure central drive. P0.1 is not directly influenced by respiratory resistance as air flow ceases during its measurement, in contrast to the derivation of the BIT index in which breathing remains free through an open circuit. Thus, ventilatory control can be affected by the abnormal respiratory resistance and elastance in both obese and COPD patients, reducing discrimination of ventilatory control variables and BIT index amongst cohorts. Using this technique, Koga et al. [3] found that BIT index in their most severely involved patients (e.g., those that required noninvasive ventilation, many of whom had restrictive thoracic disorders) was, on average, 3.7 times greater than in nonsmoking healthy subjects, a difference that was entirely accounted for by an equivalent reduction in VC. By contrast, median FVC in our COPD and obese patients was only 25% and 16% less, respectively, than in the control subjects. In addition, control of ventilation in the neuromuscular patients of Koga et al. [3] was likely affected by respiratory muscle weakness [27]. Another limitation of our study was that blood gas determinations were not available for the majority of our subjects at the time of referral for pulmonary function evaluation. Thus we were not able to subdivide our COPD and obese patients into those who were hypercapnic and eucapnic. Obesity-related changes in lung volumes and pulmonary mechanics are more marked in obesity-hypoventilation syndrome than in equally obese eucapnic individuals [30]. Finally, because our patients were clinically stable at the time of testing, it is likely that BIT index values were not high enough to discriminate those who would need assisted ventilation.
In conclusion, BIT index is greater in seated posture in obese and COPD patients, due primarily to an increase in Vt and Vt/Ti in this position. While BIT index tends to be higher in patients with obesity and COPD as compared to control subjects, discrimination between cohorts is not possible because of smaller intergroup differences in lung function. Thus, in clinically stable patients whose vital capacities are mild to moderately reduced, the BIT index alone cannot be recommended as a predictive guide for initiating assisted ventilation for respiratory fatigue. Nevertheless, because it is easy to perform and measure, and is comfortably tolerated by patients, its potential usefulness may be in periodic measurements to monitor its increase as respiratory reserve declines. Prospective studies to assess BIT index over time in patients with progressive respiratory compromise are recommended.
5. Acknowledgements
Author contributions: Dr. Baydur contributed to the formulation of the scientific problem and study concept, methodology design, planning and conduct; screening and recruiting of most of the subjects; conducted all of the experiments and collated most of the data; and approval of the study proposal and final version of the manuscript. Dr. Chen provided critical statistical outcome and data analysis.
Other contributions: Mr. Louis Wilkinson for his valuable technical assistance in designing the recording and measuring equipment; Dr. Danielle Kushner and Mr. Shadman Chowdhury for assistance in tabulating data. The authors also thank the technical staff of the Pulmonary Function Laboratory at Los Angeles County + University of Southern California Medical Center for performing the lung function testing, and all the patients and volunteers who participated in the study.
Financial/nonfinancial disclosures: The authors have reported that no potential conflicts of interest exist with any companies/organizations whose products or services may be discussed in this article.
REFERENCES
- F. Bellemare and A. Grassino, “Effect of Pressure and Timing of Contraction Ondiaphragm Fatigue,” Journal of Applied Physiology, Vol. 53, No. 5, 1982, pp. 1190-1195.
- M. Ramonatxo, P. Boulard and C. Prefault, “Validation of a Noninvasive Tension-Time Index of Inspiratory Muscles,” Journal of Applied Physiology, Vol. 78, No. 2, 1995, pp. 646-653.
- T. Koga, K. Watanabe, M. Sano, Y. Ishikawa and J. R. Bach, “Breathing Intoleranceindex: A New Indicator for Ventilator Use,” American Journal of Physical Medicine and Rehabilitation, Vol. 85, No. 1, 2006, pp. 24-30. doi:10.1097/01.phm.0000184237.62628.e1
- M. McGregor and M. Becklake, “The Relationship of oxygen Cost of Breathing to Respiratory Mechanical Work and Respiratory Force,” Journal of Clinical Investigation, Vol. 40, No. 6, 1961, pp. 971-980. doi:10.1172/JCI104336
- D. F. Rochester and G. Bettini, “Diaphragmatic Blood Flow and Energy Expenditure in the Dog. Effects of Inspiratory Air Flow Resistance and Hypercapnia,” Journal of Clinical Investigation, Vol. 57, No. 3, 1976, pp. 661- 672. doi:10.1172/JCI108322
- C. Weissman, B. Abraham, J. Askanazi, J. Milic-Emili, A. I. Hyman and J. M. Kinney, “Effect of Posture on the Ventilatory Response to CO2,” Journal of Applied Physiology, Vol. 53, No. 3, 1982, pp. 761-765.
- A. Baydur, P. K. Behrakis, W. A. Zin, M. J. Jaeger, J. M. Weiner and J. Milic-Emili, “Effect of Posture on Ventilation and Breathing Pattern during Room Air Breathing at Rest,” Lung, Vol. 165, No. 1, 1987, pp. 341-351. doi:10.1007/BF02714450
- R. A. Watson, N. B. Pride, E. L. Thomas, J. Fitzpatrick, G. Durighel, J. McCarthy, S. X. Morin, P. W. Ind and J. D. Bell, “Reduction of Total Lung Capacity in Obese Men: Comparison of Total Intrathoracic and Gas Volumes,” Journal of Applied Physiology, Vol. 108, No. 6, 2010, pp. 1605-1612. doi:10.1152/japplphysiol.01267.2009
- J. C. H. Yap, R. A. Watson, S. Gilbey and N. B. Pride, “Effects of Posture on Respiratory Mechanics in Obesity,” Journal of Applied Physiology, Vol. 79, No. 4, 1995, pp. 1199-1205.
- C. Meredith, S. Taslaq, O. M. Kon and J. Henry, “The Cardiopulmonary Effects of Physical Restraint in Subjects with Chronic Obstructive Pulmonary Disease,” Journal Clinical Forensic Medicine, Vol. 12, No. 3, 2005, pp. 133-136. doi:10.1016/j.jcfm.2004.10.013
- W. S. Druz and J. T. Sharp, “Activity of Respiratory Muscles in Upright and Recumbent Humans,” Journal of Applied Physiology,” Vol. 51, No. 6, 1981, pp. 1551- 1561.
- R. Banzett, K. Strohl, B. Geffroy and J. Mead, “Reflex Compensation for Changes Inoperational Length of Inspiratory Muscles,” In: C. H. Roussos and P. T. Macklem, Eds., The Thorax, Part A, Lung Biology in Health and Disease, Vol. 29, \Marcel Dekker, New York, 1985, pp. 595-605.
- J. Mead, “Responses to Loaded Breathing: A Critique and a Synthesis,” Bulletin Européen de Physiopathologie Respiratoire, Vol. 15, No. Suppl, 1979, pp. 61-71.
- N. R. Anthonisen, D. Bartlett and S. M. Tenney, “Postural Effect on Ventilatory Control,” Journal of Applied Physiology, Vol. 20, No. 2, 1965, pp. 191-196.
- R. Pellegrino, G. Viegi, V. Brusasco, R. O. Crapo, F. Burgos, R. Casaburi, A. Coates, C. P. M. van der Grinten, P. Gustafsson, J. Hankinson, R. Jensen, D. C. Johnson, N. MacIntyre, R. McKay, M. R. Miller, D. Navajas, O. F. Pedersen and J. Wanger, “Interpretative Strategies for Lung Function Tests,” European Respiratory Journal, Vol. 26, No. 5, 2005, pp. 948-968. doi:10.1183/09031936.05.00035205
- World Health Organization, “Obesity: Preventing and Managing the Global Epidemic,” Report of a WHO Consultation on Obesity, Geneva, 1997.
- J. B. Schoenberg, G. J. Beck and A. Bouhuys, “Growth and Decay of Pulmonary Function in Healthy Blacks and Whites,” Respiratory Physiology, Vol. 33, No. 3, 1978, pp. 367-393. doi:10.1016/0034-5687(78)90063-4
- R. O. Crapo, A. H. Morris, P. D. Clayton and C. R. Nixon, “Lung Volumes in Healthy Nonsmoking Adults,” Bulletin Européen de Physiopathologie Respiratoire, Vol. 18, No. 3, 1982, pp. 419-425.
- R. Farré, D. Navajas, R. Peslin, M. Rotger and C. Duvivier, “A Correction Procedure for the Asymmetry of Differential Pressure Transducers in Respiratory Impedance Measurements,” IEEE Transactions of Biomedical Engineering, Vol. 136, No. 11, 1989, pp. 1137-1140. doi:10.1109/10.40822
- J. Šorli, A. Grassino, G. Lorange and J. Milic-Emili, “Control of Breathing in Patients with Chronic Obstructive Lung Disease,” Clinical Science and Molecular Medicine, Vol. 54, 1978, pp. 295-304.
- M. Aubier, D. Murciano, M. Fournier, J. Milic-Emili, R. Parienté and J.-P. Derenne, “Central Respiratory Drive in Acute Respiratory Failure of Patients with Chronic Obstructive Pulmonary Disease,” American Review of Respiratory Disease, Vol. 122, No. 2, 1980, pp. 191-199.
- W. J. Dixon and F. J. Massey Jr., “Introduction to Statistical Analysis,” 4th Edition, McGraw-Hill, New York, 1983, pp. 385-414.
- R. McGill, J. W. Tukey and W. Larsen, “Variations of Box Plots,” The American Statistician, Vol. 32, No. 1, 1978, pp. 12-16.
- G. Blom, “Statistical Estimates and Transformed BetaVariables,” John Wiley & Sons, New York, 1958.
- N. K. Burki, “The Effects of Changes in Functional Residual Capacity with Posture on Mouth Occlusion Pressure and Ventilatory Pattern,” American Review of Respiratory Disease, Vol. 116, No. 5, 1977, pp. 895-900.
- J. R. A. Rigg, A. S. Rebuck and E. J. M. Campbell, “Effect of Posture on the Ventilatory Response to CO2,” Journal of Applied Physiology, Vol. 37, No. 4, 1974, pp. 487- 490.
- A. Baydur, “Respiratory Muscle Strength and Control of Ventilation in Patients with Neuromuscular Disease,” Chest, Vol. 99, No. 2, 1991, pp. 330-338. doi:10.1378/chest.99.2.330
- M. Chlif, D. Keochkerian, C. Mourlhorn, D. Choquet and S. Ahmaidi, “Noninvasive Assessment of the TensionTime Index of Inspiratory Muscles at Rest in Obese Malesubjects,” International Journal of Obesity, Vol. 29, No. 12, 2005, pp. 1478-1483. doi:10.1038/sj.ijo.0803030
- F. Bellemare and A. Grassino, “Force Reserve of the Diaphragm in Patients with Chronic Obstructive Pulmonary Disease,” Journal of Applied Physiology, Vol. 55, No. 1, 1983, pp. 8-15.
- S. M. Koenig, “Pulmonary Complications of Obesity,” American Journal of Medical Science, Vol. 321, No. 4, 2001, pp. 249-279. doi:10.1097/00000441-200104000-00006
Abbreviations
AHI: Apnea-hypopnea index BIT index: Breathing intolerance index EFL: Expiratory flow limitation FEV1: Forced expiratory volume in one second FRC: Functional residual capacity FVC: Forced vital capacity IC: Inspiratory capacity OSA: Obstructive sleep apnea RV: Residual volume Vt: Tidal volume Ti: Inspiratory time Te: Expiratory time ANOVA: Analysis of variance
NOTES
*Corresponding author.