International Journal of Clinical Medicine
Vol.4 No.5(2013), Article ID:31393,7 pages DOI:10.4236/ijcm.2013.45043
Potassium Depletion Stimulates Beta-Subunit of Colonic H+-K+-ATPase in Mice
![]()
Department of Biological Sciences, College of Science, Engineering and Technology, Murray State University, Murray, USA.
Email: snakamura@murraystate.edu
Copyright © 2013 Guojun Wei et al. This is an open access article distributed under the Creative Commons Attribution License, which permits unrestricted use, distribution, and reproduction in any medium, provided the original work is properly cited.
Received February 18th, 2013; revised March 27th, 2013; accepted April 29th, 2013
Keywords: H+-K+-ATPase (HKA); Knockout Mice (KO); Wild-Type Mice (WT); Gastric H+-K+-ATPase (gHKA); Colonic H+-K+-ATPase (cHKA); Outer Medullary Collecting Duct (OMCD)
ABSTRACT
H+-K+-ATPase (HKA) is composed of two different subunits: an alpha and a beta subunit. Previous studies have shown that in the kidney gastric HKA (HKA alpha 1) predominates under normal dietary conditions while colonic HKA (HKA alpha 2) predominates under potassium depleted conditions [1]. The purpose of the current study was to elucidate the association between the beta and different alpha subunits from stomach, colon and kidney under normal and potassium depleted conditions. Black Swiss mice were fed a potassium-free diet for 2 weeks, beta subunit expression of HKA in stomach mucosae, colon mucosae and renal outer medulla was examined and compared between normal diet and potassium depleted diet. In wild type (WT) mice, the concentrations of the beta subunit under potassium deficient conditions were found significantly increased compared with normal dietary conditions in colon mucosae (8.27 ± 0.73 vs 6.62 ± 0.55 μg/μl, n = 7, p = 0.0416), whereas in cHKA (HKA alpha 2) mice colon mucosae, the concentrations of the beta subunit were statistically the same (5.05 ± 0.31 vs 4.76 ± 0.37 μg/μl, n = 13, p = 0.2833), and the concentration of the beta subunit stayed the same in renal outer medulla and stomach mucosae as well. The data indicate that potassium deficiency results in a significant increase in the levels of HKA beta subunit concentration in the colonic tissue of WT mice. The results indicate that the HKA beta subunit associates with the cHKA (HKA alpha 2) in order to mediate bicarbonate reabsorption under potassium depletion (hypokalemia).
1. Introduction
The outer medullary collecting duct segment of the nephron plays a pivotal role in systemic acid-base homeostasis via acid secretion and bicarbonate ( ) reabsorption [2]. The regulation of acid-base homeostasis is known to be mediated, in part, due to the activity of H+-K+-ATPase (HKA), a P-type ATPase [3]. Structurally, HKA is a heterodimeric protein composed of an alpha and beta subunit [4,5]. Molecular analysis has identified two H+-K+-ATPase isoforms; HKA alpha 1 (gastric H+-K+-ATPase) and HKA alpha 2 (colonic H+- K+-ATPase) [6]. Both isoforms have been localized in the intercalated cells of the renal outer medullary collecting duct (OMCD) of mice, rats and rabbits; the location in which systemic acid-base homeostasis is regulated [7-9]. The HKA alpha subunit is a ~1000 amino acid protein that contains the catalytic site in addition to functioning as the membrane pore through which ions are transported [10]. The HKA beta subunit is a ~300 amino acid protein with a 36 amino acid N-terminal cytoplasmic domain, a single transmembrane domain and a glycosylated extracellular domain [11]. The beta subunit stabilizes the alpha subunit and signals translocation of the heterodimer to the membrane of the cell coupled with activation of the enzyme [12]. In the kidney HKA alpha 1 (gHKA), originally isolated from the gastric mucosa, has been shown to function under normal dietary conditions, while HKA alpha 2 (cHKA), originally isolated from the colonic mucous membrane, has been shown to operate exclusively under potassium depleted (hypokalemic) conditions [13,14]. The present study examines the contribution of the HKA beta subunit to HKA alpha subunit activity in epithelial cells of the stomach, colon and kidney in wild type (WT) and HKA alpha 2 knockout mice (KO) under normal and hypokalemic dietary conditions.
2. Methods
2.1. Solutions
The dissecting solution used contained (in mM): 146.8 Na+, 3.0 K+, 2.5 Mg2+, 1.3 Ca2+, 124.4 Cl−, 25.0 , 1.0
, 1.0 , 1.0
, 1.0 , 2.5
, 2.5  5.6 Glucose, and 6.0 L-Alanine. Lysis buffer solution was prepared by combining (in mM) 134.5 Na+, 134.5 Cl−, 20.0 Trizma Base, 2.0 EDTA, 10% Glycerol and 1% Triton X-100. The standard PBS solution used throughout the experiment contained (in mM): 175.6 Na+, 153.8 Cl−, 2.1
  and 9.84
 . The Bradford Reagent necessary for performing the Bradford Assay was generated by combining 40% Methanol, 10% acetic acid and 1.2 mM Coomassie blue.
2.2. Micodissection of Epithelia
Hypokalemia was induced in the appropriate mice by providing a potassium free diet for 2 weeks. The mice were euthanized via a 1 cm3 intraperitoneal injection of sodium pentobarbital. The kidneys removed from mice were decapsulated, cross sectioned, and placed immediately in a Petri dish containing dissecting solution. The renal medulla was isolated from the kidney cross sections, minced into smaller pieces and transferred to a second Petri dish containing dissecting solution maintained at 4˚C. Samples of stomach mucosae were isolated by dissecting out a portion of the stomach lining estimated to be 9 mm2. Colon mucosae were isolated by the removal of a section of the descending colon roughly 4 mm in length. Epithelia samples were stored separately in 1.5 ml microfuge tubes at −24˚C.
2.3. Tissue Lysing
Stored epithelia samples were weighed and transferred to separate sterile 15 ml centrifuge tubes followed by the addition of lysis buffer in a concentration ratio of 1 ml lysis buffer to 4 mg of epithelia. While maintained on ice, the epithelia in lysis buffer were triturated until the epithelia had been completely dissolved into the buffer. The samples were subsequently aliquoted into 1 ml microfuge tubes and agitated for 2 hours at 4˚C. After agitation, the samples were centrifuged for 20 minutes at 12,000 rpm at 4˚C. The supernatant was aspirated and the sample transferred to a fresh microfuge tube maintained on ice.
2.4. Preclearing Lysate
125 µl of supernatant was loaded into a microfuge tube along with 1 µl of preclearing antibody and agitated for 1 hour at 4˚C. 40 µl of Protein A Agarose was added to each sample on ice after which the samples were agitated for 1 hour at 4˚C followed by centrifugation for 5 minutes at 4˚C at 12,000 rpm. The supernatant was aspirated and placed in a fresh microfuge tube maintained on ice. Mouse myeloma protein IgG1 was used to bind nonspecific proteins. Protein A Agarose binds to the Fc region of IgG1 molecules. The nonspecific protein IgG1-Protein A Agarose complex was removed to purify the sample.
2.5. Immunoprecipitation
500 µg of cell lysate from each aliquot was added to a new microfuge tube along with 1 µl of monoclonal antibody Ma3-923 anti-mouse IgG raised against amino acid residues 1 - 13 or 15 - 28 located on the cytoplasmic side of the beta-subunit of H+-K+-ATPase. The sample was incubated with the monoclonal antibody overnight at 4˚C with agitation. 50 µl of Protein A bead slurry was added to each sample with agitation at 4˚C for 4 hours followed by centrifugation at 12,000 rpm for 5 minutes at 4˚C. The supernatant was decanted and the beads washed three times with lysis buffer. Following the last wash, 100 ml of PBS was added to each sample which was then boiled at 95˚C - 100˚C for 5 minutes.
2.6. Bradford Assay
The standard curve for the Bradford Assay was generated using bovine serum albumin in Bradford Reagent solutions in concentrations of: 0.00, 0.02, 0.04, 0.06, 0.10, and 0.15 µg/µl. The spectrophotometer absorbency was set at 595 nm and was calibrated using 180 µl of deionized water. 25 µl of each immunoprecipitated sample was combined with 100 µl of Bradford Reagent and 375 µl of Millipore water for 15 minutes. Following the 15 minutes incubation, 180 µl of each sample was loaded into a cuvette and analyzed for beta subunit concentration.
3. Statistics
The data is expressed as means +/− standard error where appropriate. Prior to the experiment it was determined that a one-tailed, two sample t-test would be employed to analyze the data. The current study seeks to determine if the beta subunit concentration increases concurrently with any observed upregulation of HKA activity, thereby justifying the implementation of a one-tailed t-test. Employing a one-tailed t-test also increases the power the analysis. The statistical analysis was performed using “R” software. p values < 0.05 were considered statistically significant.
Materials
The knockout mice used for this experiment were generated by Dr. Gary Shull’s laboratory at the University of Cincinnati. The potassium free mouse food was obtained from MP Biomedicals. The antibody and Protein A agarose beads used were purchased from Thermo Scientific. All other chemicals were purchased from Sigma Aldrich.
4. Results
4.1. Beta Subunit Concentration in the Stomach
In tissue samples isolated from the stomach, gastric HKA is the only HKA isoform present. An analysis of the beta subunit concentration in stomach tissue examines the association of the beta subunit with gastric HKA. In WT mice, the concentrations of the beta subunit under normal dietary and potassium deficient conditions were found to be 6.49 ± 0.63 and 7.10 ± 0.51 µg/µl (mean ± SE, n = 8) (Figure 1). The concentrations of the beta subunit under normal dietary and potassium deficient conditions in the stomach of KO mice were found to be decreased to 5.50 ± 0.47 and 5.24 ± 0.51 µg/µl (n = 12) respectively (Figure 1). A statistical comparison of the beta subunit concentration between normal dietary and potassium deficient conditions within each genotype yielded a p-value of 0.2467 in wild type mice and 0.3612 in knockout mice. This suggests that hypokalemia does not induce a significant increase in beta subunit concentration.
4.2. Beta Subunit Concentration in the Colon
In tissue samples from the colon, colonic HKA is the only HKA isoform present. An analysis of beta subunit concentration in colon tissue examines the association of the beta subunit with colonic HKA. In WT mice, the concentrations of the beta subunit under normal dietary and potassium deficient conditions were found to be 6.62 ± 0.55 and 8.27 ± 0.73 µg/µl (n = 7) (Figure 2). In KO mice, the concentrations of the beta subunit under normal dietary and potassium deficient conditions decreased to 5.05 ± 0.31 and 4.76 ± 0.37 µg/µl (n = 13) respectively (Figure 2). A statistical comparison of the beta subunit concentration between normal dietary and potassium deficient conditions within each genotype yielded a p-value of 0.0416 in wild type mice and 0.2833 in knockout mice. This suggests that hypokalemia results in a significant increase of beta subunit concentration in the colon of wild type mice.
4.3. Beta Subunit Concentration in the Kidney
In tissue samples from the kidney, both colonic HKA and gastric HKA isoforms are present. In KO mice, with cHKA suppressed, a comparison of the association of the beta subunit with gHKA in the kidney is provided. In KO mice, the concentrations of the beta subunit under normal dietary and potassium deficient conditions are 5.54 ± 0.43 and 5.14 ± 0.34 µg/µl (n = 18) (Figure 3). In WT mice both HKAs are present, however gHKA is the primary transporter under normal dietary conditions while cHKA is the primary transporter under potassium deficient conditions. A comparison of beta subunit concentration in WT mice in the kidney offers a comparison of beta subunit association between gHKA and cHKA. In WT mice, the concentrations of the beta subunit under
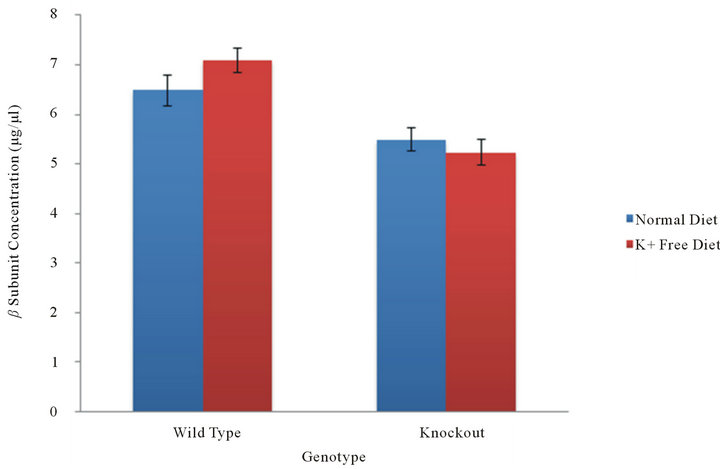
Figure 1. β subunit concentration in the stomach. In the absence of cHKA, the beta subunit concentration, and thereby its association with gHKA in the stomach, was measured in WT and KO mice under normal and potassium deficient conditions.
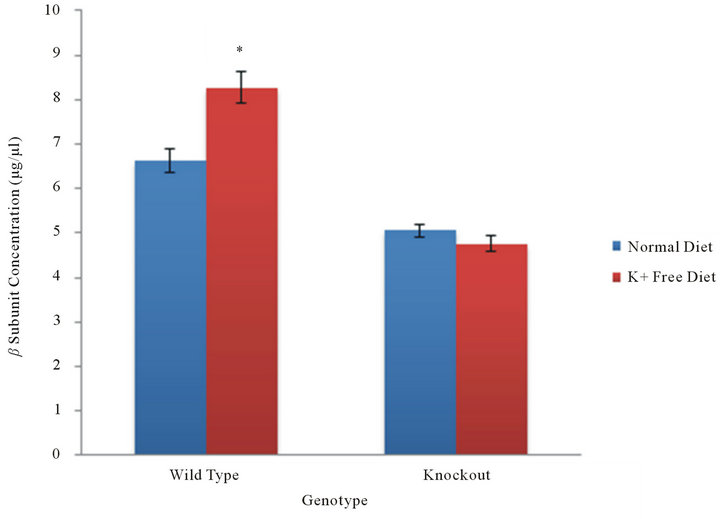
Figure 2. β subunit in the colon. In the absence of gHKA, the beta subunit concentration, and thereby its association with cHKA in the colon, was measured in WT and KO mice under normal and potassium deficient conditions. As a result of selective gene knockout, cHKA is present only in the colonic tissue of WT mice. The level of beta subunit concentration in the KO mice demonstrate the level of concentration when disassociated with either alpha subunit.
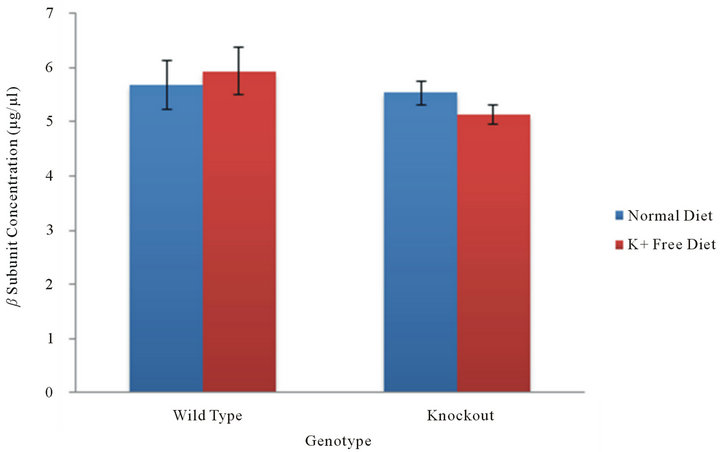
Figure 3. β subunit in the kidney. In the presence of both gHKA and cHKA, the beta subunit concentration in the kidney was measured in WT and KO mice under normal and potassium deficient conditions. The levels of beta subunit concentration in wild type mice offer a comparison of differences in its level of association between gHKA and cHKA.
normal dietary conditions was found to be 5.68 ± 0.90 while the beta subunit concentration under potassium deficient conditions demonstrated an increase to 5.94 ± 0.87 µg/µl (n = 8) (Figure 3). A statistical comparison of the beta subunit concentration between normal dietary and potassium deficient conditions within each genotype yielded a p-value of 0.4236 in wild type mice and 0.2423 in knockout mice. This suggests that hypokalemia does not result in an increase of beta subunit concentration in the kidney.
5. Discussion
The current experiments demonstrate that potassium deficiency results in a significant increase in the levels of HKA beta subunit concentration in the colonic tissue of WT mice (Figure 2). The results indicate that the HKA beta subunit associates with the cHKA (HKA alpha 2) in order to mediate bicarbonate reabsorption under potassium depletion (hypokalemia).
Our previous studies showed the expression levels of mRNA of gastric H+-K+-ATPase (gHKA) was abundant in the cortex and outer medulla but low in the inner medulla in the kidney [7]. The expression of colonic H+- K+-ATPase (cHKA) was not detected in the whole kidney, cortex, or medulla; cHKA is abundant in the mouse distal colon. Our experiments were conducted in wild type mice under normal dietary conditions. The kidneys weighed 0.223 ± 0.030 g (mean ± SD), plasma potassium and bicarbonate concentrations were 5.9 ± 0.1 and 22 ± 3 mmol/L, respectively (mean ± SEM). In addition to normal diet, we had examined the expression levels of mRNA of gHKA and cHKA under hypokalemic dietary conditions [13]. Animals fed a potassium depleted diet developed significant hypokalemia at 10 days. Serum [K+] was 4.8 ± 0.5 in control and 3.1 ± 0.4 mEq/L in potassium depleted animals (p < 0.04, n = 4). The expression levels of mRNA of gHKA were suppressed by 56% in the potassium deleted animals (p < 0.05 vs normal, n = 3). cHKA mRNA levels were heavily induced in the potassium deleted animals (p < 0.001 vs normal, n = 3). Our current results of the beta subunit (Figure 3) suggest beta subunit possibly associates with a decreased gHKA and an increased cHKA in kidneys under potassium deficient conditions. The transgenic mice used in our experiments were gifts from Dr. Gary Shull’s lab (University of Cincinnati). In mouse stomach, Northern blot analysis (Shull’s lab) showed high levels of mRNA of the gHKA in the wild-type and the mRNA of gHKA was absent in the gHKA knockout mice. The levels of mRNA of the HKA beta subunit was 1.8-fold more abundant in the gHKA knockout than in the wild-type mice [15]. Northern blot analysis of cHKA mRNA in the colon and kidney (Shull’s lab) showed the cHKA mRNA was abundant in the colon, but only trace levels were in the kidney in the wild-type mice with normal diet. The wild-type mRNA of cHKA was sharply upregulated in the kidney in hypokalemic mice fed potassium free diet for 18 days [16].
The current finding is consistent with previously published studies that used coimmunoprecipitation to demonstrate the physiological association of cHKA beta subunit with cHKA alpha subunit during up-regulation of cHKA as a result of dietary K+ depletion [13,14,17]. This suggests the up-regulated enzyme activity of cHKA requires the association of cHKA alpha subunits with their beta counterparts.
Previous studies conducted by Codina et al. have reported that cHKA alpha subunits have also been shown to assemble with Na+-K+-ATPase beta 1 subunit in the rat distal colon and renal medulla [18]. In addition, the coexpression of the alpha and beta subunits from different enzymes resulted in the activation of HKA, indicating that the Na+-K+-ATPase beta 1 subunit could act as a surrogate beta subunit for cHKA alpha subunit [19]. Grishin et al. have reported that HKA is capable of exchanging Na+ (rather than H+) for K+ under certain circumstances [20]. Similar results have been found in the colon which suggests that cHKA could potentially function as a Na+-K+-ATPase under Na+ depletion diet. Hyponatremia (sodium deficiency) has been shown to result in an up-regulation of alpha subunit messages, protein abundance and apical membrane H+-K+-ATPase activity [21]. It is thought possible that the cHKA beta subunit could induce the activity of Na+-K+-ATPase due to its amino acid homology [22].
Previous studies in the kidney have demonstrated that potassium deficient conditions result in an increase in cHKA mRNA and protein expression levels, however the levels of expression for the gHKA alpha subunit have been shown to be unaffected by potassium deficiency [23,24]. The current study has examined the association between the gHKA alpha and beta subunits in the stomach in the absence of cHKA. The results suggest that the level of expression of the beta subunit, while associated with the gHKA alpha subunit, is not increased as is the case with beta subunits associated with cHKA in the colon.
The decreased levels of beta subunit concentration in the stomach of wild type mice relative to the levels of beta subunit concentration in the colon of wild type mice can possibly be attributed to structural differences in gastric HKA and colonic HKA alpha subunits [25]. Previous studies have substantiated this notion by demonstrating that the two isoforms have different sensitivities to ouabain, in addition to differences in spatial distribution [26]. One possible explanation for the proposed differences in beta subunit association with gHKA and cHKA in wild type mice is possibly due to the development of higher sensitivity to the colonic HKA alpha subunit in conjunction with a lowered sensitivity to the gastric HKA alpha subunit under K+ depleted conditions. A previous study conducted by Crambert et al. has demonstrated that different beta subunits confer different protease sensitivities to cHKA and that these structural changes can be observed in response to treatments with K+ and ouabain [27].
Under hypokalemic conditions, an increase in colonic HKA alpha subunit mRNA and protein expression has been demonstrated in the OMCD of both rats and rabbits [28]. In the current study, the beta subunit concentration in the kidneys of wild type mice did not demonstrate a significant difference between individuals of a normal diet and those subjected to hypokalemia; this seems to contradict expectations. To account for this discrepancy, the current results suggest the possibility that a different beta subunit isoform related to Na+-K+-ATPase is being expressed in lieu of the HKA beta subunit. Previous studies in the renal medulla of rats have reported that cHKA alpha subunits have indeed associated with Na+- K+-ATPase beta 1 subunit [29]. This suggests that the Na+-K+-ATPase beta 1 subunit might be associating with the cHKA alpha subunit in the kidney of wild type mice, thereby generating the observed discrepancy given that the Na+-K+-ATPase beta 1 subunit would not be precipitated by an immunoprecipitation employing a monoclonal antibody raised against the HKA beta subunit.
In summary, potassium depletion is associated with an increased beta subunit concentration in the colon mucosa of wild type mice, consistent with the activation of the HKA alpha 2 isoform; this is likely the result of an attempt to conserve K+ coupled with an increase in H+ secretion (for bicarbonate reabsorption) in response to K+ depletion. It is possible that hypokalemia could result in the stimulation of the HKA beta subunit in order to support the H+-K+-ATPase alpha 2 subunits enzymatic activities, thereby contributing to the enhanced compensatory bicarbonate reabsorption under the potassium depleted conditions.
6. Acknowledgements
This study was supported by grants from the American Heart Association and the National Science Foundation EPSCoR. We would like to thank Dr. Gary E. Shull (University of Cincinnati, Cincinnati, OH) for providing the transgenic mice used in our research as well as Sakura Higashi, Zac Elmore, Lynsey Bochenek, and Michael Creed (undergraduate and graduate students at Murray State University) for providing technical assistance.
REFERENCES
- S. Nakamura, “H+-ATPase Activity in Selective Disruption of H+K+-ATPase Alpha 1 Gene of Mice under Normal and K-Depleted Conditions,” Journal of Laboratory and Clinical Medicine, Vol. 147, No. 1, 2006, pp. 45-51. doi:10.1016/j.lab.2005.08.013
- C. Winter, N. Schulz, G. Giebisch, J. Geibel and C. Wagner, “Nongenomic Stimulation of Vacuolar H+-ATPases in Intercalated Renal Tubule Cells by Aldosterone,” Proceedings of the National Academy of Sciences of the United States of America, Vol. 101, No. 8, 2004, pp. 2636-2641. doi:10.1073/pnas.0307321101
- P. L. Pedersen and E. Carafoli, “Ion Motive ATPase. II,” Trends in Biochemical Sciences, Vol. 12, 1987, pp. 186- 189.
- M. L. Gumz, D. Duda, R. McKenna, C. S. Wingo and B. D. Cain, “Molecular Modeling of the Rabbit Colonic (HKα2a) H+ K+ ATPase,” Journal of Molecular Modeling, Vol. 9, 2003, pp. 283-289. doi:10.1007/s00894-003-0140-2
- M. L. Gumz, I. J. Lynch, M. M. Greenlee, B. D. Cain and C. S. Wingo, “The Renal H+-K+-ATPases: Physiology, Regulation, and Structure,” Renal Physiology: American Journal of Physiology, Vol. 298, No. 1, 2010, pp. F12- F21. doi:10.1152/ajprenal.90723.2008
- P. Meneton, P. Schultheis, J. Greeb, et al., “Increased Sensitivity to K+ Deprivation in Colonic H,K-ATPase Deficient Mice,” Journal of Clinical Investigation, Vol. 101, No. 3, 1998, pp. 536-542. doi:10.1172/JCI1720
- S. Nakamura, H. Amlal, M. Soleimani and J. H. Galla, “Pathways for HCO3-Reabsorption in Mouse Medullary Collecting Duct Segments,” Journal of Laboratory and Clinical Medicine, Vol. 136, No. 3, 2000, pp. 218-223. doi:10.1067/mlc.2000.108750
- B. Bastani, “Co-Localization of H-ATPase and H,K-ATPase Immunoreactivity in the Rat Kidney,” Journal of the American Society of Nephrology, Vol. 5, 1995, pp. 1476- 1482.
- C. S. Wingo, K. M. Madsen, A, Smolka and C. C. Tisher, “H+-K+-ATPase Immnoreactivity in Cortical and Outer Medullary Collecting Duct,” Kidney International, Vol. 38, 1995, pp. 985-990. doi:10.1038/ki.1990.302
- D. Yan, Y. Hu, S. Li and M. Cheng, “A Model of 3DStructure of H+K+-ATPase Catalytic Subunit Derived by Homology Modeling,” Acta Pharmacologica Sinica, Vol. 25, No. 4, 2004, pp. 474-479.
- K. Abe, K. Tani, T. Nishizawa and Y. Fujiyoshi, “InterSubunit Interaction of Gastric H+,K+-ATPase Prevents Reverse Reaction of the Transport Cycle,” The EMBO Journal, Vol. 28, No. 11, 2009, pp. 1637-1643. doi:10.1038/emboj.2009.102
- H. Thangarajah, A. Wong, D. C. Chow, J. M. Crothers and J. G. Forte, “Gastric H+-K+-ATPase and Acid-Resistant Surface Proteins,” American Journal of Physiology —Gastrointestinal and Liver Physiology, Vol. 282, 2002, pp. G953-G961.
- S. Nakamura, H. Amlal, M. Soleimani and J. H. Galla, “Colonic H+-K+-ATPase Is Induced and Mediates Increased HCO3-Reabsorption in Inner Medullary Collecing Duct in Potassium Depletion,” Kidney International, Vol. 54, No. 4, 1998, pp. 1233-1239. doi:10.1046/j.1523-1755.1998.00105.x
- S. Nakamura, Z. Wang, J. H. Galla and M. Soleimani, “K+ Depletion Increases HCO3-Reabsorption in OMCD by Activation of Colonic H+-K+-ATPase,” American Journal of Physiology, Vol. 274, No. 4, 1998, pp. F687- F692.
- Z. Spicer, M. L. Miller, A. Andringa, T. M. Riddle, J. J. Duffy, T. Doetschman and G. E. Shull, “Stomachs of Mice Lacking the Gastric H,K-ATPase Alpha-Subunit Have Achlorhydria, Abnormal Parietal Cells, and Ciliated Metaplasia,” The Journal of Biological Chemistry, Vol. 275, No. 28, 2000, pp. 21555-21565. doi:10.1074/jbc.M001558200
- P, Meneton, P. J. Schultheis, J. Greeb, M. L. Nieman, L. H. Liu, L. L. Clark, J. J. Duffy, T. Doetschman, J. N. Lorenz and G. E. Shull, “Increased Sensitivity to K+ Deprivation in Colonic H,K-ATPase-Deficient Mice,” Journal of Clinical Investigation, Vol. 101, No. 1, 1998, pp. 536- 542. doi:10.1172/JCI1720
- P. Sangan, S. S. Kolla, V. M. Rajendran, M. Kashgarian amd H. J. Binder, “Colonic H+-K+-ATPase Beta-Subunit: Identification in Apical Membranes and Regulation by Dietary K Depletion,” American Journal of Physiology— Cell Physiology, Vol. 276, 1999, pp. C350-C360.
- J. Codina, J. T. Delmas-Mata and T. J. DuBose, “The Alpha-Subunit of the Colonic H+,K+-ATPase Assembles with Beta1-Subunits of Na+,K+-ATPase in Kidney and Distal Colon,” Journal of Biological Chemistry, Vol. 273, 1998, pp. 7894-7899. doi:10.1074/jbc.273.14.7894
- P. Chen, P. Mathews, P. Good, B. Rossier and K. Geering, “Unusual Degredation of α-β Complexes in Xenopus Oocytes by β-Subunits of Xenopus Gastric H-K-ATPase,” American Journal of Physiology, Vol. 275, No. 1, 1998, pp. C139-C145.
- A. V. Grishin, J. Reinhard, L. A. Dunbar, et al., “Nongastric H+,K+-ATPase: Cell Biologic and Functional Properties,” Seminars in Nephrology, Vol. 19, No. 5, 1999, pp. 421-430.
- V. M. Rajendran, P. Sangan, J. Geibel and H. J. Binder, “Oubain-Sensitive H,K-ATPase Functions as Na,K-ATPase in Apical Membranes of the Rat Distal Colon,” The Journal of Biological Chemistry, Vol. 275, 2000, pp. 13035-13040. doi:10.1074/jbc.275.17.13035
- M. S. Crowson and G. E. Shull, “Isolation and Characterization of a cDNA Encoding the Putative Distal Colon H,K-ATPase. Similarity of Deduced Amino Acid Sequence to Gastric H+-K+-ATPase and Na+-K+-ATPase, and mRNA Expression in Distal Colon, Kidney and Uterus,” Journal of Biological Chemistry, Vol. 167, 1992, pp. 13740-13748.
- J. A. Kraut, J. Hiura, M. Besancon, A. Smolka, G. Sachs and D. Scott, “Effect of Hypokalemia on the Abundance of HKalpha1 and HKalpha2 Protein in the Rat Kidney,” American Journal of Physiology, Vol. 272, No. 6, 1997, pp. F744-F750.
- T. D. Dubose, J. Codina, A. Burges and T. A. Pressley, “Regulation of H-K-ATPase Expression in the Kidney,” American Journal of Physiology, Vol. 269, 1995, pp. F500-F507.
- J. R. Dubose, D. Thomas, J. Codina and L Jian, “Molecular Diversity and Regulatory Heterogeneity of the H+-K+-ATPase in Kidney,” Mechanisms and Consequences of Proton Transport, 2002, pp. 53-58.
- A. V. Grishin, M. O. Bevensee, N. N. Modyanov, V. Rajendran, W. F. Boron and M. J. Caplan, “Functional Expression of the cDNA Encoded by the Human ATP1- AL1 Gene,” American Journal of Physiology, Vol. 271, 1996, pp. F539-F551.
- G. Crambert, J. D. Horisberger, N. N. Modyanov and K. Geering, “Human Nongastric H+-K+-ATPase: Transport Properties of ATP1al1 Assembled with Different BetaSubunits,” Cell Physiology: American Journal of Physiology, Vol. 283, No. 1, 2002, pp. C305-C314.
- R. B. Silver and M. Soleimani, “H+-K+-ATPase: Regulation and Role in Pathophysiological States,” Renal Physiology: American Journal of Physiology, Vol. 276, 1999, pp. F799-F811.
- J. A. Kraut, J. Hiura, J. M. Shin, A. Smolka, G. Sachs and D. Scott, “The Na+K+ ATPase Beta 1 Subunit Is Associated with the HK Alpha 2 Protein in the Rat Kidney,” Kidney International, Vol. 53, No. 4, 1998, pp. 958-962. doi:10.1111/j.1523-1755.1998.00841.x