Open Journal of Nephrology
Vol.06 No.02(2016), Article ID:67282,12 pages
10.4236/ojneph.2016.62006
Both Diet and Exercise Are Necessary for Obese CKD Patients: A Pilot Prospective Randomized Controlled Study
Kazuyuki Noguchi1, Hirayasu Kai1, Hirofumi Zempo2, Fumio Mizuno2, Masahiro Hagiwara1, Naoki Morito1, Joichi Usui1, Chie Saito1, Shinya Kuno2, Kunihiro Yamagata1*
1Department of Nephrology, Faculty of Medicine, University of Tsukuba, Tsukuba, Ibaraki, Japan
2Graduate School of Comprehensive Human Sciences, University of Tsukuba, Tsukuba, Ibaraki, Japan

Copyright © 2016 by authors and Scientific Research Publishing Inc.
This work is licensed under the Creative Commons Attribution International License (CC BY).
http://creativecommons.org/licenses/by/4.0/


Received 20 April 2016; accepted 10 June 2016; published 13 June 2016
ABSTRACT
Aim: This study aimed to examine the effects of exercise training on kidney function and nutrition status in obese Chronic Kidney Disease (CKD) patients. Methods: This is a prospective randomized controlled trial. Twelve adult obese CKD patients were randomly assigned to dietary instruction alone group (Group-D) or to both dietary instruction and exercise training group (Group-E). All patients received supervised dietary advice including calorie, protein, and salt intake for a period of 12 weeks. In addition, patients in Group-E underwent a fitness-training program. A change in glomerular filtration rate (GFR) was the main outcome. Secondary outcomes were changes in body mass index, serum creatinine-based estimated-GFR, serum albumin, and albuminuria. Results: Changes in GFR and all secondary outcomes were not statistically significant in either of the two groups. Although exercise training did not appear to significantly affect serum albumin levels in either group, it did present with a large sized effect. Conclusion: Exercise training might not have any effect on kidney function; however, the combination of exercise training along with dietary advice may prove to be more effective in maintaining the nutrition status when compared with dietary instructions alone in obese CKD patients. These results suggest that appropriate exercise training with dietary instructions is recommended for the treatment of obese CKD patients.
Keywords:
CKD, Obesity, GFR, Diet, Exercise Training

1. Introduction
Chronic kidney disease (CKD), a worldwide public health problem, is a major independent risk factor for cardiovascular disease (CVD) that can progress to end-stage kidney disease (ESKD), stroke, and premature death [1] [2] . There are more than 300,000 ESKD patients in Japan, and the number is still increasing [3] . Renal replacement therapy for ESKD is a significant burden for society due to high medical expenses and loss of quality of life. Therefore, it is important to prevent the progression of CKD into ESKD [3] .
There are several known risk factors for CKD, such as hypertension, diabetes, age, gender, and obesity [4] [5] . Numerous diseases have been associated with obesity, including CKD, CVD, diabetes, and hypertension [6] [7] . In recent years, the average body mass index (BMI) has been found to increase owing to lifestyle changes and a higher calorie diet, especially among the Japanese males. The proportion of obese male subjects (defined as BMI > 25 kg/m2) had increased by approximately 7% in the 2010 Japan census when compared with the 2000 national census [8] . It is vital for patients to maintain the appropriate body weight, not only through diet but also by exercise in order to prevent the progression of CKD [9] . Several studies have demonstrated the beneficial effects of physical exercise on kidney function [10] [11] . However, information about the effects of body weight reduction on kidney function in obese CKD patients is limited [12] [13] .
Recently, the Kidney Disease Improving Global Outcomes (KDIGO) group recommended that CKD patients should be assigned to stages and composite relative risk groups, according to the criteria for glomerular filtration rate (GFR) and proteinuria [13] . Proteinuria is an independent risk factor for the progression of CVD [14] to kidney failure [15] , and death. However, only few studies have evaluated the possible relationship between exercise training and proteinuria in CKD patients. While some studies have reported the amelioration of proteinuria in CKD patients following exercise training [10] [16] [17] , the opposite has also been reported [18] establishing the need to define the association between exercise and proteinuria in these patients.
In the present study, 12 obese CKD patients were assigned to diet/nutrition therapy alone or diet/nutrition therapy with exercise training. Kidney function was assessed using GFR (based on inulin clearance), estimated GFR (eGFRcre; based on creatinine), and proteinuria, both before and after 12 weeks of intervention. We examined whether the effect of exercise training was beneficial to kidney function and proteinuria in obese CKD patients.
2. Materials and Methods
2.1. Study Design
This trial was in compliance with CONSORT 2010 statement.
This study was designed as a 12-week, prospective, randomized controlled trial. The type of randomization was individual. The primary endpoints of this trial were the stabilization of kidney function and proteinuria during exercise training along with BMI reduction. The secondary endpoints were physical status, oxidative stress, and plasma adipokine levels. Subjects for this study were 30- to 75-year-old CKD patients with obesity (BMI > 25 kg/m²). Non-inclusion criteria was ESKD (under renal replacement therapy) patients. All participants were recruited in a single center (The University of Tsukuba Hospital) between April 1st 2009 and March 31st 2010 and followed-up to March 31st 2011. This study was registered the University hospital Medical Information Network (UMIN) Center in Japan (registry number: UMIN000019746). Additionally, the study protocol was approved by the ethical committee of the University of Tsukuba Hospital (approval number: H21-354), and written informed consent was obtained from all subjects who participated in this study.
2.2. Intervention Methods
The subjects were randomly assigned to two groups by drawing lot: exercise training and dietary instruction (Group E) and dietary instruction alone (Group D). These lots were made by third person, and were randomly allocated. Baseline blood and urine samples were collected; inulin clearance tests, physical examinations, and physical fitness measurements were also performed on all subjects. The values were then compared with those obtained after a 12-week intervention period.
All patients were undergone diet programs designed by a dietician who was a member of authors, and provided with dietary advice involving calorie, protein, and salt adjustments based on the Japanese Evidence-based Clinical Practice Guideline for CKD [19] , by a registered dietician, every 4 weeks. Specifically, calorie intake was restricted to 25 - 30 kcal/kg ideal body weight (IBW)/day, protein intake was restricted to 0.6 - 0.8 g/kg IBW/day, and salt was restricted to <6 g/day. Individual nutritional intake was calculated from the diet report prepared by the patients themselves. Intake of energy, protein, and salt were calculated based on a standard food composition table [20] .
The subjects in Group E underwent a program of exercise training involving mixed exercise therapy consisting of aerobic exercises using a static bike (AEROBIKE 900U-EWI; Combiwellness Co., Suzuka, Japan) or walking and weight-bearing muscle exercises for 12-weeks, between 30 minutes to 1 hour each day, under the guidance of fitness trainers. The exercise training was conducted for >23 metabolic events (METs)/hour/week as per the exercise guide designed by the Japanese Ministry of Health, Labour, and Welfare. The MET was defined as 3.5 mL/kg/min of oxygen consumption while sitting at rest. 75% physical working capacity (75% PWC), defined as a capacity for endurance of the activity under 75% strength of maximum heart rate was measured before and after intervention [21] .
2.3. Physical Examination
Height, body weight, BMI, heart rate, and blood pressure were measured. Furthermore, the percentage of body fat and muscle were measured using a bioelectrical impedance measurement device (HBF-354 IF-2; Omron Healthcare Co., Ltd.). Bioelectrical impedance method is an effective method of evaluate the body composition [22] .
2.4. Measurement of Kidney Function
Inulin clearance tests were performed in order to measure GFRbased on the method of inulin and PAH clearance test. Fasting patients came to hospital in the morning and were allowed to drink water ad lib. For the testing, patients drank 500 mL of water and 30 minutes later an inulin and PAH solution infusion was started. The patients then drank 60 mL of water every 30 minutes after the start of the infusion. Blood specimens were collected at the infusion onset, and at 45 minutes, 75 minutes, and 105 minutes after the infusion started. Urine specimen collection was done at the infusion onset, and at 60 minutes, 90 minutes, and 120 minutes after the infusion started. Blood and urine samples were analyzed, and inulin clearance (Cin) was calculated. The eGFR was calculated from the serum creatinine (eGFRcre) based on the formulas described earlier [23] . The level of proteinuria was also measured using the protein/creatinine ratio in single voided urine samples. Serum albumin and creatinine were measured in the laboratory at the University of Tsukuba Hospital.
2.5. Physical Activity Level
In this study, the physical activity level (PAL) of the subjects was defined as the amount of time spent on performing the activities at more than 3 METs in a week [24] . The activity was measured using an activity monitor with three axial acceleration sensors (HJA-350IT; Omron Healthcare Co., Ltd.), which counted the number of steps taken by the subjects per 10 seconds, and measured the time taken to perform the activities at intensities ranging from 3 METs to more than 6 METs over a 10-second period. The device was generally set for 2-week periods, except under conditions where it was difficult to take the measurements (e.g. while sleeping). Valid data over a period of 7 days during the study period were obtained after collecting the devices. The subjects were asked to write activity reports wherein, extraordinary events such as travel were omitted from the statistical analysis in order to evaluate daily PAL accuracy. Unmeasurable amounts obtained from activities such as cycling and swimming were converted to METs. The conversion formula was based on the Ainsworth compendium of physical activities [25] .
2.6. Statistics Analysis
Statistics analyses, excluding the calculation of detective power, were carried out using SPSS II for Windows (IBM Corp., Armonk, NY, USA). To compare the baseline characteristics of the subjects in Groups D and E, the data were analyzed using the two-tailed, paired student’s t-test, with a 95% confidence interval (95% CI). Values are presented as mean ± standard deviation (S.D). The level of statistical significance was set at P = 0.05. Due to the small sample size the Cohen’s d effect size was analyzed from the mean and S.D values obtained from of each group [26] . The level of large size effect was set at d = 0.8. The detective power and sample size required for the present study were calculated using G*Power for Windows 3.1 [27] .
3. Results
3.1. Baseline Characteristics
Although the subject was initially 13 patients (7 patients in group D, 6 patients in group E), because one patient in group E has declined on half way through the intervention, finally became 12 patients (7 patients in group D, 5 patients in group E). The abscised patient was excluded all analysis.
Table 1 shows the baseline characteristics of the patients in this study. Despite randomization, two female patients were included in Group E, whereas Group D comprised of males only. Age and BMI were not significantly different between the two groups. The initial eGFRcre was lower in Group E than in Group D, but the difference was not statistically significant. The average baseline GFR was 80.1 mL/min/1.73 m2 in Group D, and 76.9 mL/min/1.73 m2 in Group E. The baseline body fat percentage in Group E was higher than that of Group D. On the other hand, baseline body muscle percentage was lower in Group E than in Group D; however, these differences were not statistically significant. The baseline 75% PWC was higher in Group E than in Group D. When the two female patients were excluded from the analyses, most differences between the two groups were reduced, except for 75% PWC, daily salt intake, eGFRcre, and GFR. Physical activity level (PAL) was significantly lower in the female patients, but was identical between the male patients in the two groups (28.8 ± 12.8 METs/h/week in Group D and 27.4 ± 6.9 METs/h/week in Group E). There was one diabetic patient in Group D and two in Group E. All patients in Group D presented with hypertension, whereas the number of patients with hypertension in Group E was four. All hypertensive patients were prescribed with anti-renin-angi- otensin system (RAS) drugs, and several of them took other oral antihypertensive drugs as well (such as calcium channel blockers, cardiovascular agents, or diuretic agents).

Table 1. Baseline characteristics.
BMI: body mass index; CKD: chronic kidney disease; GFR: glomerular filtration rate; eGFRcre: estimated GFR-creatinine; PWC: physical working capacity; RAS: renin-angiotensin system. Age, body mass index (BMI), eGFRcre, diabetes mellitus, hypertension, antihypertensive drugs, and CKD classification in both groups are shown on this table. As all the female subjects in this study were present in Group E, data comprising only the male subjects in the group are shown in parentheses. Values are presented as mean ± standard deviation.
3.2. Effects of Intervention in Kidney Function
We assessed the kidney function from measured GFR by inulin clearance, estimated-GFR based on serum creatinine, and albuminuria before and after the 12-week intervention. In Group D, GFR was slightly increased from 80.1 mL/min/1.73 m2 at baseline to 82.4 mL/min/1.73 m2; Group E showed similar results, with increase in GFR from 76.9 mL/min/1.73 m2 at baseline to 81.2 mL/min/1.73 m2. However, the differences were not statistically significant in both groups (P = 0.79, d = 0.16, 95% CI: −19.2 to 15.0; Figure 1, Figure 2). After intervention, the eGFRcre was increased from 59.3 mL/min/1.73 m2 at baseline to 67.1 mL/min/1.73 m2 in Group D, and from 64.2 mL/min/1.73 m2 at baseline to 67.4 mL/min/1.73 m2 in Group E. Again, the differences were not statistically significant in both groups (P = 0.64, d = 0.64, 95% CI: −4.84 to 14.2; Figure 1, Figure 3). Similarly, the change in urinary albumin levels in both groups was also not statistically significant (−0.191 ± 0.79 g/gCre in group D vs. 0.072 ± 0.34 g/gCre in group E, P = 0.45, d = 0.41, 95% CI: −1.04 to 0.51; Figure 1).
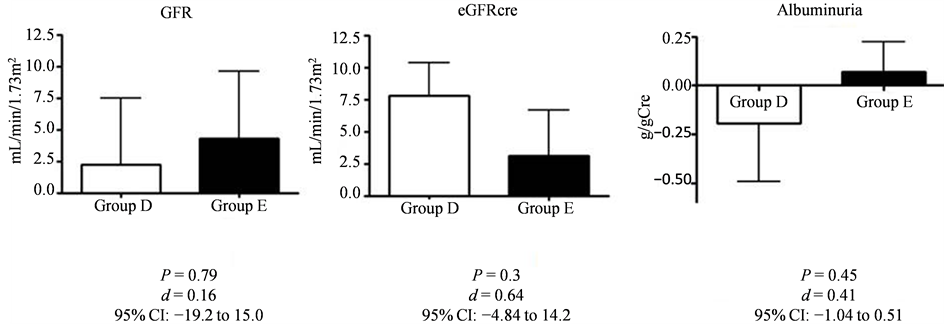
Figure 1. The changes in kidney function before and after intervention.
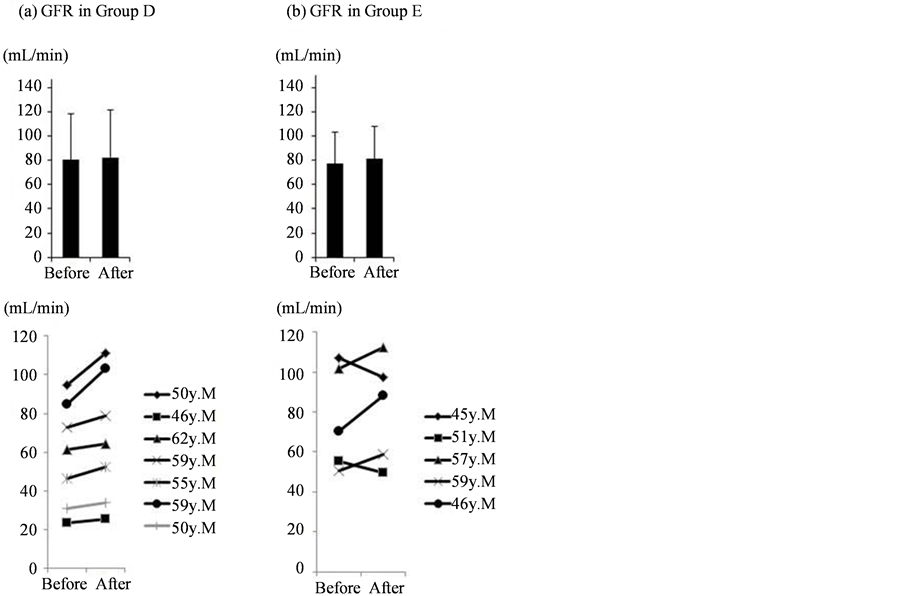
Figure 2. Individual changes in GFR after intervention.
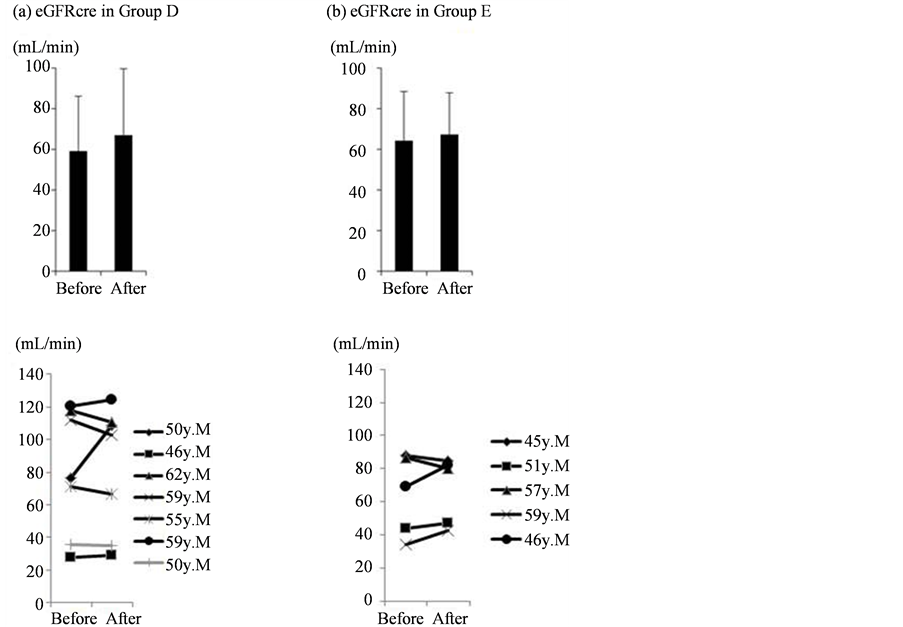
Figure 3. Individual changes in eGFRcre after intervention.
3.3. Effects of Intervention in Physical Status
After intervention, BMI was decrease in both Group D and group E (−1.1 ± 0.82 kg/m2 in group D vs. −0.88 ± 0.98 kg/m2 in group E, P = 1, d = 0.25, 95% CI: −1.38 to 0.94), while body fat and muscle mass remained unchanged in both groups. Contrary to the decrease in serum albumin levels in Group D, the levels were found to rise in group E (−0.21 g/dL in group D vs. +0.06 g/dL in group E, P = 0.1, 95% CI: −0.6 to 0.06). Although this difference was not of statistical significance, it did present a large sized effect d = 1.09 (Figure 4).
The changes in 75% PWC and PAL were higher in Group E than in Group D (Table 2). After exercise training, the mean PAL value was 153.67 watts in males and 74.0 watts in females. The changes in body composition including body muscle and fat percentage in each group were not significant (Table 2).
The mean nutritional intake including calorie, protein, and salt was decreased in both groups (Table 2). Furthermore, the mean 75% PWC and PAL were increased both the groups (Table 2).
GFR was slightly increased in both groups (from 80.1 ± 38.5 to 82.4 ± 38.7 mL/min/1.73 m2 in Group D, and from 76.9 ± 26.1 to 81.2 ± 26.4 mL/min/1.73 m2 in Group E); the change was not statistically significant (2.21 ± 13.9 mL/min/1.73 m2 in Group D vs. 4.32 ± 11.8 mL/min/1.73 m2 in Group E, P = 0.79, d = 0.16). Estimated GFRcre values, after intervention, were slightly increased in both groups (from 59.3 ± 26.9 to 67.1 ± 32.7 mL/min/1.73 m2 in Group D, from 64.2 ± 24.5 to 67.4 ± 20.5 mL/min/1.73 m2 in Group E). The change was not statistically significant (7.78 ± 6.83 mL/min in Group D vs. 3.12 ± 7.92 mL/min in Group E, P = 0.3, d = 0.64). After intervention, albuminuria was decreased in Group D (from 1.01 ± 1.29 to 0.82 ± 0.78 g/gCre), and slightly increased in Group E (from 0.76 ± 0.96 to 0.83 ± 1.19 g/gCre). However, the difference between the two groups was not statistically significant (−0.191 ± 0.79 g/gCre in Group D vs. 0.072 ± 0.34 g/gCre in Group E, P = 0.63, d = 0.41). Values are presented as mean ± standard deviation.
No deterioration in the rate of glomerular filtration was noted in Groups D (a) or E (b). The upper section shows the overall mean values, while the lower section shows individual changes in GFR after intervention.
Estimated GFRcre was increased in Groups D and E (a, b). The upper section shows overall the mean values, while the lower section shows individual changes after intervention.
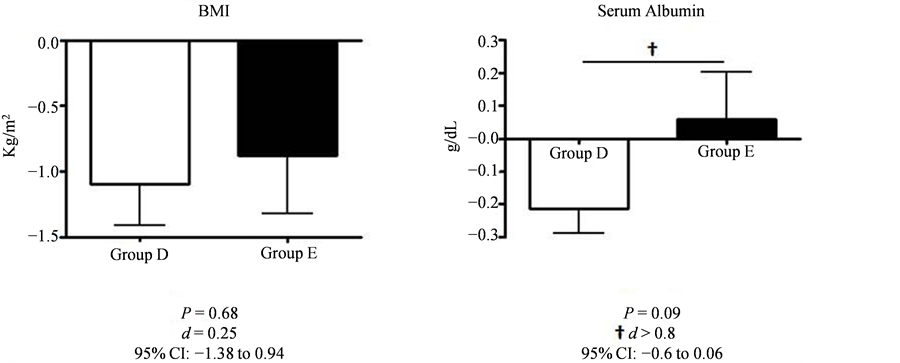
Figure 4. The changes in BMI and serum albumin before and after intervention.
Table 2. Effect of intervention on physical status.
PWC: physical working capacity; PAL: physical activity level; METs: metabolic equivalents. All P values are performed from the change of group D vs. group E. The 75% PWC and PAL were increased in both groups after intervention. Body muscle percentage was decreased in both groups. Body fat percentage was decreased in Group D, and slightly increased in Group E. However, neither was the difference between the two groups statistically significant, nor was the effect size was large enough. Daily calorie, protein, and salt intake were all decreased in both groups after intervention. Values are presented as mean ± standard deviation.
BMI was decreased in both groups after intervention (from 29.0 ± 2.6 to 27.9 ± 2.5 kg/m2 in Group D, from 30.1 ± 4.8 to 29.2 ± 4.9 kg/m2 in Group E); the change was not statistically significant (−1.1 ± 0.82 kg/m2 in Group D vs. −0.88 ± 0.98 kg/m2 in Group E, P = 1, d = 0.25). Serum albumin level in Group D was decreased (from 4.03 ± 0.70 to 3.81 ± 0.59 g/dL), and slightly increased in Group E (from 3.98 ± 0.43 to 4.04 ± 0.26 g/dL) after intervention. This difference between the two groups was not statistically significant (−0.21 ± 0.2 g/dL in Group D vs. +0.06 ± 0.32 g/dL in Group E, P = 0.1); however, it did present a large sized effect (d = 1.08). Values are presented as mean ± standard deviation. The large sized effect detected was d > 0.8.
3.4. The Detective Power of This Study
Table 3 illustrates the detective power of this study. When the effect size and probability of alpha-error were set at the standard level (Cohen’s d = 0.5, alpha-error probability = 0.05), the probability of 1-beta error was 0.121 in the present study (Table 3).
4. Discussion
The relationship between exercise and CKD is still unclear. In this study, we demonstrated that GFR, eGFRcre,
Table 3. Post hoc analysis of detective power in this study.
The detective power (1-beta error probability) was 0.236 in the present study.
and proteinuria were not changed in the group assigned with diet therapy alone and in the group provided with both dietary instructions as well as exercise training. Only a few small studies have investigated the effects of exercise on CKD progression. No change in GFR values were observed in the exercise group after an average follow-up duration of 18 months in a study by Eidemak et al. where 30 non-diabetic patients with CKD (median GFR, 25 mL/min/1.73 m2; range, 10 - 43 mL/min/1.73 m2) were randomly assigned to either exercise or control groups [28] . Although it was unclear as to whether the study had adequate power to detect a difference in the rate of CKD progression, the authors concluded that any such effect would be too small to be of clinical interest. In another study, Toyama et al. non-randomly assigned 10 patients with CKD to the exercise group and nine patients to a control group and found that the anaerobic metabolic threshold, high-density lipoprotein cholesterol level, and eGFR were increased in the patients belonging to the exercise group [11] .
There are few studies evaluating the relationship between exercise and proteinuria in CKD patients. Leehey et al. revealed that 18 months of aerobic exercise training did not significantly alter GFR, proteinuria, serum lipids, creative protein, or hemoglobin levels; however, the power of this study was limited because there were only seven patients in the exercise group and four patients in the control group [16] . Pechter et al. also reported that 12 months of low-intensity water exercise training decreased proteinuria [10] . In the present study, proteinuria was decreased in Group D, and was slightly increased in Group E. However, the difference within each group was not statistically significant; moreover, the effect size was not large either. These results suggest that moderate exercise does not affect proteinuria levels in obese CKD patients. Overall, the present study shows that exercise does not worsen kidney function in CKD patients.
BMI was decreased in both groups. Interestingly, the nutrition level, as indicated by serum albumin levels, was decreased in Group D only. In contrast, no changes in serum albumin levels were observed in Group E. Furthermore, although the difference between the two groups was not significant (P = 0.1), the effect size was large (d > 0.8). The absence of statistical significance may be attributed to type 2 error due to the small sample size and low power of the study. These results imply that exercise training has a positive effect in maintaining nutritional status in obese CKD patients. The diet instruction therapy alone might set up serum albumin synthesis disturbances under dietary caloric restriction, and the addition of exercise training in Group E may result in the maintenance of albumin synthesis under same dietary conditions. These results imply that the addition of exercise training have some favorable effects to obese CKD patients via the nutritional metabolism. There is a possibility that exercise training to obese CKD patients affect the levels of adipocytokines such as adiponectin, leptin, resistin, and ghrelin, therefore the serum albumin level maintain. There are many evidences of the relationship between adipocytokines and nutrition status including serum albumin level [29] .
PAL and 75% PWC were found to be increasing in both groups, more so in Group E when compare to Group D indicating the effect of intervention in these patients. However, there was no significance difference in these parameters between the two groups. The 75% PWC is a barometer of maximum oxygen uptake (VO2 max), in other words, the aerobic capacity of the body. It is reported that 75% PWC is a good barometer of endurance for people with sedentary lifestyles or in patients with chronic diseases [30] . Our data showed that patients could improve their cardiorespiratory fitness by proper exercise training, as seen in Group E. Furthermore, exercise training may also have contributed to improvement of metabolic disturbance in the Group E subjects. These results agree with those reported in other studies [31] [32] , and show that exercise training may have improved the prognosis of the subjects in Group E. Due to the short duration of intervention in the present study, the body
Table 4. The priori analysis for adequate test in standard condition.
Under the standard condition of this study (effect size d > 0.8, alpha-error probability = 0.05, detective power = 0.95), the adequate number of subjects required in each group was 42.
muscle and fat percentages were not changed in the subjects belonging to Group E; however, continuation of both calorie restriction and exercise training may result in favorable outcomes.
One of the major limitations of this study is sample size, which was the reason for the wide 95% CIs indicating the high possibility of a type 2 error. In this trial, we could not collect a necessary and sufficient sample size which is obtained by detecting power required. The adequate sample size in order to prevent the occurrence of this error (effect size d > 0.8, alpha-error probability = 0.05, detective power = 0.95), is 42 subjects in each group (Table 4). This factor must be taken into consideration in future studies. In addition, we were unable to measure the practical muscle volume. Hence, body muscle and fat percentages were calculated using bioelectrical impedance analysis. Further visual examination by CT and/or MRI is required. Finally, the influence of any underlying diseases on the results of this study was not ascertained.
5. Conclusion
In conclusion, we tried to elucidate the effects of exercise training and dietary instruction on kidney function and BMI in obese CKD patients using a randomized controlled study over a 12-week period. We found that both dietary instruction and exercise training or dietary instruction alone did not affect kidney functions (including GFR and albuminuria). BMI improvement was observed in both groups, while serum albumin tended to be maintained in the group provided with dietary instruction and exercise training. Diet therapy alone has a possibility to induce metabolic disturbance. To avoid metabolic disturbances under calorie and protein restriction, appropriate exercise training is recommended. We believe that ideal body weight reduction with stable kidney function could be achieved in obese CKD patients by long-term continuation of both dietary control and physical training. Furthermore, creatinine-based estimated GFR alone is not sufficient for the evaluation of kidney function under dietary instruction.
Acknowledgements
We are deeply grateful to the members of Kuno’s laboratory who offered much support and valuable advice.
In addition, we would like to give heartful thanks to Dr. Akira Hiwatashi who offered continuing support. I also owe a very important debt to Dr. Keigyou Yoh, and Dr. Shuichi Tsuruoka who provided technical help and sincere encouragement.
Funding Statement
This article was supported in part by a Grant-in-Aid for Research on Advanced Chronic Kidney Disease (REACH-J), Practical Research Project for Renal Diseases from Japan Agency for Medical Research and development, AMED.
Ethics
This study was registered the University hospital Medical Information Network (UMIN) Center in Japan (registry number: UMIN000019746). The study protocol was approved by the ethics committee of University of Tsukuba Hospital (approval number H21-354), and written informed consent was obtained from all subjects who participated in this study.
Conflict of Interests
The authors declare that there is no conflict of interests regarding the publication of this article.
Cite this paper
Kazuyuki Noguchi,Hirayasu Kai,Hirofumi Zempo,Fumio Mizuno,Masahiro Hagiwara,Naoki Morito,Joichi Usui,Chie Saito,Shinya Kuno,Kunihiro Yamagata, (2016) Both Diet and Exercise Are Necessary for Obese CKD Patients: A Pilot Prospective Randomized Controlled Study. Open Journal of Nephrology,06,43-54. doi: 10.4236/ojneph.2016.62006
References
- 1. Go, A.S., Chertow, G.M., Fan, D., McCulloch, C.E. and Hsu, C.Y. (2004) Chronic Kidney Disease and the Risks of Death, Cardiovascular Events, and Hospitalization. New England Journal of Medicine, 351, 1296-1305.
http://dx.doi.org/10.1056/NEJMoa041031 - 2. Keith, D.S., Nichols, G.A., Gullion, C.M., Brown, J.B. and Smith, D.H. (2004) Longitudinal Follow-Up and Outcomes among a Population with Chronic Kidney Disease in a Large Managed Care Organization. Archives of Internal Medicine, 164, 659-663.
http://dx.doi.org/10.1001/archinte.164.6.659 - 3. Nakai, S., Watanabe, Y., Masakane, I., Wada, A., Shoji, T., Hasegawa, T., Nakamoto, H., Yamagata, K., Kazama, J.J., Fujii, N., Itami, N., Shinoda, T., Shigematsu, T., Marubayashi, S., Morita, O., Hashimoto, S., Suzuki, K., Kimata, N., Hanafusa, N., Wakai, K., Hamano, T., Ogata, S., Tsuchida, K., Taniguchi, M., Nishi, H., Iseki, K. and Tsubakihara. Y. (2013) Overview of Regular Dialysis Treatment in Japan (as of 31 December 2011). Therapeutic Apheresis and Dialysis, 17, 567-611.
http://dx.doi.org/10.1111/1744-9987.12147 - 4. Yamagata, K., Ishida, K., Sairenchi, T., Takahashi, H., Ohba, S., Shiigai, T., Narita, M. and Koyama, A. (2007) Risk Factors for Chronic Kidney Disease in a Community-Based Population: A 10-Year Follow-Up Study. Kidney International, 71, 159-166.
http://dx.doi.org/10.1038/sj.ki.5002017 - 5. Wakasugi, M., Narita, I., Iseki, K., Moriyama, T., Yamagata, K., Tsuruya, K., Yoshida, H., Fujimoto, S., Asahi, K., Kurahashi, I., Ohashi, Y. and Watanabe, T. (2012) Weight Gain after 20 Years of Age Is Associated with Prevalence of Chronic Kidney Disease. Clinical and Experimental Nephrology, 16, 259-268.
http://dx.doi.org/10.1007/s10157-011-0565-3 - 6. Thomas, G., Sehgal, A.R., Kashyap, S.R., Srinivas, T.R., Kirwan, J.P. and Navaneethan, S.D. (2011) Metabolic Syndrome and Kidney Disease: A Systematic Review and Meta-Analysis. Clinical Journal of the American Society of Nephrology, 6, 2364-2373.
http://dx.doi.org/10.2215/CJN.02180311 - 7. Alexander, M.P., Patel, T.V., Farag, Y.M., Florez, A., Rennke, H.G. and Singh, A.K. (2009) Kidney Pathological Changes in Metabolic Syndrome: A Cross-Sectional Study. American Journal of Kidney Diseases, 53, 751-759.
http://dx.doi.org/10.1053/j.ajkd.2009.01.255 - 8. The Ministry of Health, Labour and Welfare of Japan (2010) National Health and Nutrition Survey.
http://www.mhlw.go.jp/english/policy/health-medical/health/index.html - 9. Iseki, K. (2005) Factors Influencing the Development of End-Stage Renal Disease. Clinical and Experimental Nephrology, 9, 5-14.
http://dx.doi.org/10.1053/j.ajkd.2009.01.255 - 10. Pechter, U., Ots, M., Mesikepp, S., Zilmer, K., Kullissaar, T., Vihalemm, T., Zilmer, M. and Maaroos, J. (2003) Beneficial Effects of Water-Based Exercise in Patients with Chronic Kidney Disease. International Journal of Rehabilitation Research, 26, 153-156.
http://dx.doi.org/10.1097/00004356-200306000-00013 - 11. Toyama, K., Sugiyama, S., Oka, H., Sumida, H. and Ogawa, H. (2010) Exercise Therapy Correlates with Improving Renal Function through Modifying Lipid Metabolism in Patients with Cardiovascular Disease and Chronic Kidney Disease. Journal of Cardiology, 56, 142-146.
http://dx.doi.org/10.1016/j.jjcc.2010.06.007 - 12. Johansen, K.L. and Painter, P. (2012) Exercise in Individuals with CKD. American Journal of Kidney Diseases, 59, 126-134.
http://dx.doi.org/10.1053/j.ajkd.2011.10.008 - 13. Levey, A.S., de Jong, P.E., Coresh, J., El Nahas, M., Astor, B.C., Matsushita, K., Gansevoort, R.T., Kasiske, B.L. and Eckardt, K.U. (2011) The Definition, Classification, and Prognosis of Chronic Kidney Disease: A KDIGO Controversies Conference Report. Kidney International, 80, 17-28.
http://dx.doi.org/10.1038/ki.2010.483 - 14. Hemmelgarn, B.R., Zhang, J., Manns, B.J., Tonelli, M., Larsen, E., Ghali, W.A., Southern, D.A., McLaughlin, K., Mortis, G. and Culleton, B.F. (2006) Progression of Kidney Dysfunction in the Community-Dwelling Elderly. Kidney International, 69, 2155-2161.
http://dx.doi.org/10.1038/sj.ki.5000270 - 15. Iseki, K., Ikemiya, Y., Iseki, C. and Takishita, S. (2003) Proteinuria and the Risk of Developing End-Stage Renal Disease. Kidney International, 63, 1468-1474.
http://dx.doi.org/10.1046/j.1523-1755.2003.00868.x - 16. Leehey, D.J., Moinuddin, I., Bast, J.P., Qureshi, S., Jelinek, C.S., Cooper, C., Edwards, L.C., Smith, B.M. and Collins, E.G. (2009) Aerobic Exercise in Obese Diabetic Patients with Chronic Kidney Disease: A Randomized and Controlled Pilot Study. Cardiovascular Diabetology, 8, 62.
http://dx.doi.org/10.1186/1475-2840-8-62 - 17. Yamamoto-Kabasawa, K., Hosojima, M., Yata, Y., Saito, M., Tanaka, N., Tanaka, J., Tanabe, N., Narita, I., Arakawa, M. and Saito, A. (2015) Benefits of a 12-Week Lifestyle Modification Program Including Diet and Combined Aerobic and Resistance Exercise on Albuminuria in Diabetic and Non-Diabetic Japanese Populations. Clinical and Experimental Nephrology, 19, 1079-1089.
http://dx.doi.org/10.1007/s10157-015-1103-5 - 18. Leube, V. (1878) Quoted in Albuminuria in Health. The Lancet, 1, 503.
- 19. CKD Guideline Editorial Committee (2009) Evidence-Based Practice Guideline for the Treatment of CKD. Nihon Jinzo Gakkai Shi, 51, 905-1066.
- 20. The Ministry of Education, Culture, Sports, Science and Technology of Japan (2010) Standard Tables of Food Composition in Japan.
http://www.mext.go.jp/english/science_technology/1347490.htm - 21. Gore, C.J., Booth, M.L., Bauman, A. and Owen, N. (1999) Utility of Pwc75% as an Estimate of Aerobic Power in Epidemiological and Population-Based Studies. Medicine & Science in Sports & Exercise, 31, 348-351.
http://dx.doi.org/10.1097/00005768-199902000-00020 - 22. Pietilainen, K.H., Kaye, S., Karmi, A., Suojanen, L., Rissanen, A. and Virtanen, K.A. (2013) Agreement of Bioelectrical Impedance with Dual-Energy X-Ray Absorptiometry and MRI to Estimate Changes in Body Fat, Skeletal Muscle and Visceral Fat during a 12-Month Weight Loss Intervention. British Journal of Nutrition, 109, 1910-1916.
http://dx.doi.org/10.1017/S0007114512003698 - 23. Matsuo, S., Imai, E., Horio, M., Yasuda, Y., Tomita, K., Nitta, K., Yamagata, K., Tomino, Y., Yokoyama, H. and Hishida, A. (2009) Revised Equations for Estimated GFR from Serum Creatinine in Japan. American Journal of Kidney Diseases, 53, 982-992.
http://dx.doi.org/10.1053/j.ajkd.2008.12.034 - 24. Nakano, H. and Inoue, S. (2010) Quantity of Physical Exercise Expended during Commuting by Office Workers Residing in the Greater Tokyo Area. Sangyo Eiseigaku Zasshi, 52, 133-139.
http://dx.doi.org/10.1539/sangyoeisei.B9018 - 25. Ainsworth, B.E., Haskell, W.L., Whitt, M.C., Irwin, M.L., Swartz, A.M., Strath, S.J., O’Brien, W.L., Bassett Jr., D.R., Schmitz, K.H., Emplaincourt, P.O., Jacobs Jr., D.R. and Leon, A.S. (2000) Compendium of Physical Activities: An Update of Activity Codes and MET Intensities. Medicine & Science in Sports & Exercise, 32, S498-S504.
http://dx.doi.org/10.1097/00005768-200009001-00009 - 26. Nakagawa, S. and Cuthill, I.C. (2007) Effect Size, Confidence Interval and Statistical Significance: A Practical Guide for Biologists. Biological Reviews of the Cambridge Philosophical Society, 82, 591-605.
http://dx.doi.org/10.1111/j.1469-185X.2007.00027.x - 27. Faul, F., Erdfelder, E., Lang, A.G. and Buchner, A. (2007) G*Power 3: A Flexible Statistical Power Analysis Program for the Social, Behavioral, and Biomedical Sciences. Behavior Research Methods, 39, 175-191.
http://dx.doi.org/10.3758/BF03193146 - 28. Eidemak, I., Haaber, A.B., Feldt-Rasmussen, B., Kanstrup, I.L. and Strandgaard, S. (1997) Exercise Training and the Progression of Chronic Renal Failure. Nephron, 75, 36-40.
http://search.proquest.com/docview/274360200?accountid=25225
http://dx.doi.org/10.1159/000189497 - 29. Slee, A.D. (2012) Exploring Metabolic Dysfunction in Chronic Kidney Disease. Nutrition & Metabolism, 9, 36.
http://dx.doi.org/10.1186/1743-7075-9-36 - 30. Suga, Y., Tanabe, K., Kim, J., Sato, H., Iwashita, S., Hamada, K. and Kuno, S. (2013) A Comparison of the Influences of Soyvs. Wheat-Based Supplements on Weight Loss in Middle-Aged Subjects. International Journal of Sport and Health Science, 11, 10-19.
http://dx.doi.org/10.5432/ijshs.201201 - 31. Ross, R., Dagnone, D., Jones, P.J., Smith, H., Paddags, A., Hudson, R. and Janssen, I. (2000) Reduction in Obesity and Related Comorbid Conditions after Diet-Induced Weight Loss or Exercise-Induced Weight Loss in Men: A Randomized, Controlled Trial. Annals of Internal Medicine, 133, 92-103.
http://dx.doi.org/10.7326/0003-4819-133-2-200007180-00008 - 32. Redman, L.M., Heilbronn, L.K., Martin, C.K., Alfonso, A., Smith, S.R. and Ravussin, E. (2007) Effect of Calorie Restriction with or without Exercise on Body Composition and Fat Distribution. The Journal of Clinical Endocrinology & Metabolism, 92, 865-872.
http://dx.doi.org/10.1210/jc.2006-2184
Abbreviations
Body mass index (BMI)
Cardiovascular disease (CVD)
Chronic Kidney Disease (CKD)
End-stage kidney disease (ESKD)
Glomerular Filtration Rate (GFR)
Ideal body weight (IBW)
Inulin clearance (Cin)
Kidney Disease Improving Global Outcomes (KDIGO)
Metabolic events (METs)
Physical activity level (PAL)
Renin-angiotensin system (RAS)
75% physical working capacity (75% PWC)
95% confidence interval (95% CI)
NOTES

*Corresponding author.