Open Journal of Rheumatology and Autoimmune Diseases
Vol.3 No.4(2013), Article ID:39702,10 pages DOI:10.4236/ojra.2013.34030
Applying Item Response Theory Methods to Improve the Measurement of Fatigue in a Clinical Trial of Rheumatoid Arthritis Patients Treated with Secukinumab*
![]()
1Quality Metric Incorporated, Lincoln, Rhode Island; 2Novartis Pharmaceuticals Corporation, East Hanover, USA; 3Novartis Pharma AG, Basel, Switzerland.
Email: #mkosinski@qualitymetric.com, jbjorner@qualitymetric.com, ari.gnanasakthy@novartis.com, usha.mallya@novartis.com, shephard.mpofu@novartis.com
Copyright © 2013 Mark Kosinski et al. This is an open access article distributed under the Creative Commons Attribution License, which permits unrestricted use, distribution, and reproduction in any medium, provided the original work is properly cited.
Received August 1st, 2013; revised September 1st, 2013; accepted September 8th, 2013
Keywords: Patient-Reported Outcomes; Fatigue; Rheumatoid Arthritis; Item Response Theory; Clinical Trial
ABSTRACT
Background: Many clinical trials include multiple patient-reported outcomes (PROs) to measure fatigue as secondary or exploratory endpoints of treatment effectiveness. Often, these instruments have overlapping content. The objective of this study was to compare the combined measurement properties of two fatigue scales, the Functional Assessment of Chronic Illness Therapy-Fatigue (FACIT-Fatigue) and SF-36 vitality (VT) scale using item response theory (IRT). Methods: The FACIT-Fatigue and SF-36v2 were administered at baseline and weeks 2, 4, 7, 12, and 16 to rheumatoid arthritis (RA) patients (n = 237) enrolled in a 52-week multicenter, randomized, double-blind, placebo-controlled, parallel-group, dose finding study to evaluate the efficacy and safety of subcutaneous secukinumab administered to patients with active RA. Confirmatory factor analysis (CFA) was used to investigate unidimensionality among FACITFatigue and VT items. A generalized partial credit IRT model was used to cross-calibrate the FACIT-Fatigue and VT items and weighted maximum-likelihood estimation was used to score a composite fatigue index. Analysis of variance was used to compare the composite fatigue index with the original scales in responding to ACR improvement and treatment effects. Results: CFA found less than adequate fit to a unidimensional model. However, specifications of alternative multidimensional models were insufficient in explaining the common variance among items. An IRT model was successfully fitted and the composite fatigue index score was found to be more responsive than the original scales to ACR improvement and treatment effects. Effect sizes and significance tests for changes in scores on the composite index were generally larger than those observed with the original scales. Conclusion: IRT methods offer a promising approach to combining items from different scales measuring the same concept that could improve the detection of treatment effects in clinical studies of RA.
1. Background
Rheumatoid arthritis (RA) is a systemic, chronic inflammatory disease characterized by joint pain, stiffness, and deformity in multiple regions, particularly the hands and feet. The disease affects approximately 0.5% - 1% of the population in developed countries [1-3]. The natural course of the disease is one of persistent symptoms, varying in intensity, with a progressive deterioration of joint structures leading to deformity and disability. The progression of the disease places an enormous burden on the patients, their families, and society as a whole. The annual direct costs of care attributable to RA from the societal perspective was estimated to be $3.6 billion [4] and increasing functional impairment due to RA often leads to work disability [5-8]. In addition, RA has a profound effect on health-related quality of life (HRQoL), impacting not only physical aspects, but psychological well-being, social and role functioning, and other areas as well [9-11]. Lastly, patients with RA are at a greater risk of early death [12]; it is estimated that RA reduces a patient’s lifespan by anywhere from 3 to 12 years [13].
The disease course of RA varies greatly across individuals. Some experience mild short-term symptoms, but in most cases the disease is progressive for life. The goals of RA treatment include minimizing the clinical symptoms such as pain and swelling, preventing bone deformity and radiographic damage, and maintaining the individual’s functional capacity and health-related quality of life [14]. With these treatment goals in mind, measuring the efficacy of RA treatment can be complex. Some of the clinical signs and symptoms of RA, such as swollen joints, elevated erythrocyte sedimentation rates (ESR), elevated C-reactive protein (CRP) levels, and radiographic damage, do not always correlate well with physical, social, or role functioning, fatigue, sense of wellbeing, or other long term outcomes [15,16]. Therefore, reductions in any one of the clinical indications of RA may not always translate into improved functioning and well-being for the patient. Because one of the primary goals of RA treatment is to maintain and improve functional capacity, it is vital that effectiveness of treatments is also measured by patient self-reports of functional ability and well-being.
Patient-reported outcome (PRO) measures of fatigue are recommended as core end points in clinical studies of rheumatoid arthritis [17]. Accordingly, many clinical trials include multiple PROs to measure fatigue as secondary or exploratory endpoints of treatment effectiveness. Often, these instruments have overlapping content. For example, the SF-36 Health Survey [18] and the FACIT-Fatigue [19] both measure energy and fatigue. Differences in item response options and scoring methods prevent investigators from simply combining the items of common content from these tools to score a composite index of fatigue. However, with the recent emergence of modern psychometric methods (Rasch and Item Response Theory) in constructing health status measures, it has been shown that items of similar content from different instruments can be successfully calibrated onto a single scale [20-24]. The advantages of a single cross-calibrated scale include extending the range of the concept being measured, allowing minimization of ceiling and floor effects, and improving the measurement precision over scales scored from the items scaled independently [25-27].
In this study, we employed methods of item-response theory (IRT) to evaluate the underlying measurement properties of two measures of fatigue (FACIT-Fatigue and SF-36 vitality scale) used in a randomized clinical trial setting of secukinumab (Novartis Pharma AG, Basel, Switzerland) treatment for RA [28]. The goal of this research was to examine whether the two measures of fatigue can be calibrated on a common metric with IRT methods to yield one composite index of fatigue. As a practical test to this cross-calibration of items from different instruments, we compared the ability of the composite fatigue index to detect change over time against the original scoring of the fatigue scales of each instrument independently. Criteria for change over time included measures of change in disease status (ACR improvement criteria) and fatigue outcome comparisons between treatment and placebo groups.
2. Methods
Regulatory and ethical review board approvals from competent authorities in each country were obtained for the study protocol. All patients signed an informed consent document, and the study was conducted in accordance with the Declaration of Helsinki and followed good clinical practice guidelines.
2.1. Study Population
A total of 237 adults with RA participated in a 52-week, multi-center, double-blind, placebo-controlled, parallel group, dosing study to evaluate the efficacy, safety and tolerability of subcutaneous secukinumab as add-on therapy in patients with active RA despite stable treatment with methotrexate. Eligible patients met the ACR 1987 revised classification criteria for RA for at least 3 months and were required to present active RA defined by ≥6 out of 28 tender joints and ≥6 out of 28 swollen joints, and high sensitivity CRP ≥10 mg/L or ESR ≥28 mm/1st hour at the time of randomization. Eligible patients were also required to be on methotrexate for at least 3 months and treated with a stable weekly dose of ≥7.5 mg/week - ≤25 mg/week for at least 4 weeks.
2.2. Measures
2.2.1. Functional Assessment of Chronic Illness Therapy—Fatigue (FACIT-Fatigue)
The FACIT-Fatigue is part of the FACIT measurement system, a comprehensive compilation of questions that measure a range of health-related quality of life concepts with cancer and other chronic illnesses [29-31]. The FACIT-Fatigue consists of 13 items that assess self-reported fatigue and its impact upon daily activities and function over the past 7 days. Patients are asked to answer each of the following questions on a 5-point Likerttype scale (0 = not at all; 1 = a little bit; 2 = somewhat; 3 = quite a bit, and 4 = very much). The items are: 1) I feel fatigued; 2) I feel weak all over; 3) I feel listless (washed out); 4) I feel tired; 5) I have trouble starting things because I am tired; 6) I have trouble finishing things because I am tired; 7) I have energy; 8) I am able to do my usual activities; 9) I need to sleep during the day; 10) I am too tired to eat; 11) I need help doing my usual activities; 12) I am frustrated by being too tired to do the things I want to do; and 13) I have to limit my social activity because I am tired. After reverse coding all items but 7 and 8, a total score is computed by summing up the response values, with a higher score indicative of less fatigue. During the efficacy evaluation period of this study the FACIT-Fatigue was administered at baseline and weeks 2, 4, 8, 12 and 16.
2.2.2. SF-36 Health Survey Vitality Scale
The SF-36 Health Survey includes 4 items that are used to score the vitality (VT) scale [18,32]. The items of the VT scale are scored on a scale from 1 (all of the time) to 5 (none of the time). Patients are asked to give an answer that comes closest to the way they have been feeling in the past 4 weeks on the following questions: 1) did you feel full of life?; 2) Did you have a lot of energy?; 3) Did you feel worn out?; and 4) Did you feel tired? The SF-36 VT scale was scored using norm-based methods that standardize the scores to have a mean of 50 and standard deviation of 10 in the general US population, with higher scores indicating more energy, less fatigue [33]. During the efficacy evaluation period of this study the SF-36v2 was administered at baseline and weeks 2, 4, 8, 12 and 16.
2.3. Factor Analysis
A primary assumption underlying Item Response Theory (IRT) is that the items under evaluation are unidimensional. To examine whether the items from the SF-36 VT and FACIT-Fatigue scales measure one unidimensional construct of “fatigue,” baseline data were analyzed using confirmatory factor analyses appropriate for categorical data and weighted least squares parameter estimation with the Mplus software [34]. The goodness of fit of the factor models was evaluated using the comparative fit index (CFI) [35] (suggested cut-off for acceptable fit > 0.9 [36]) and the root mean square error of approximation (RMSEA) (suggested cut-off for acceptable fit < 0.10 [37]), as well as an examination of residual correlations. Three different models were tested: 1) a one-factor model, 2) a two-factor model assuming that each form loaded on a separate factor, and 3) a model with several factors derived from theoretical considerations and results of previous models. The theoretical model for fatigue evaluated a separate factor for vitality (as opposed to fatigue) and a factor for fatigue impact (as opposed to the symptom fatigue). For models 2 and 3 we used a bifactor model [38], which specifies both a global factor and specific factors, thus allowing a direct comparison of which factors explain more of the item variance.
2.4. IRT Analyses
Once it was confirmed that the items from the SF-36 VT and FACIT-Fatigue scales formed a unidimensional construct of fatigue, the next step consisted of fitting an IRT model for patients at baseline with complete responses to all items. The current analyses used the generalized partial credit (GPC) IRT model that can be defined in the following way:
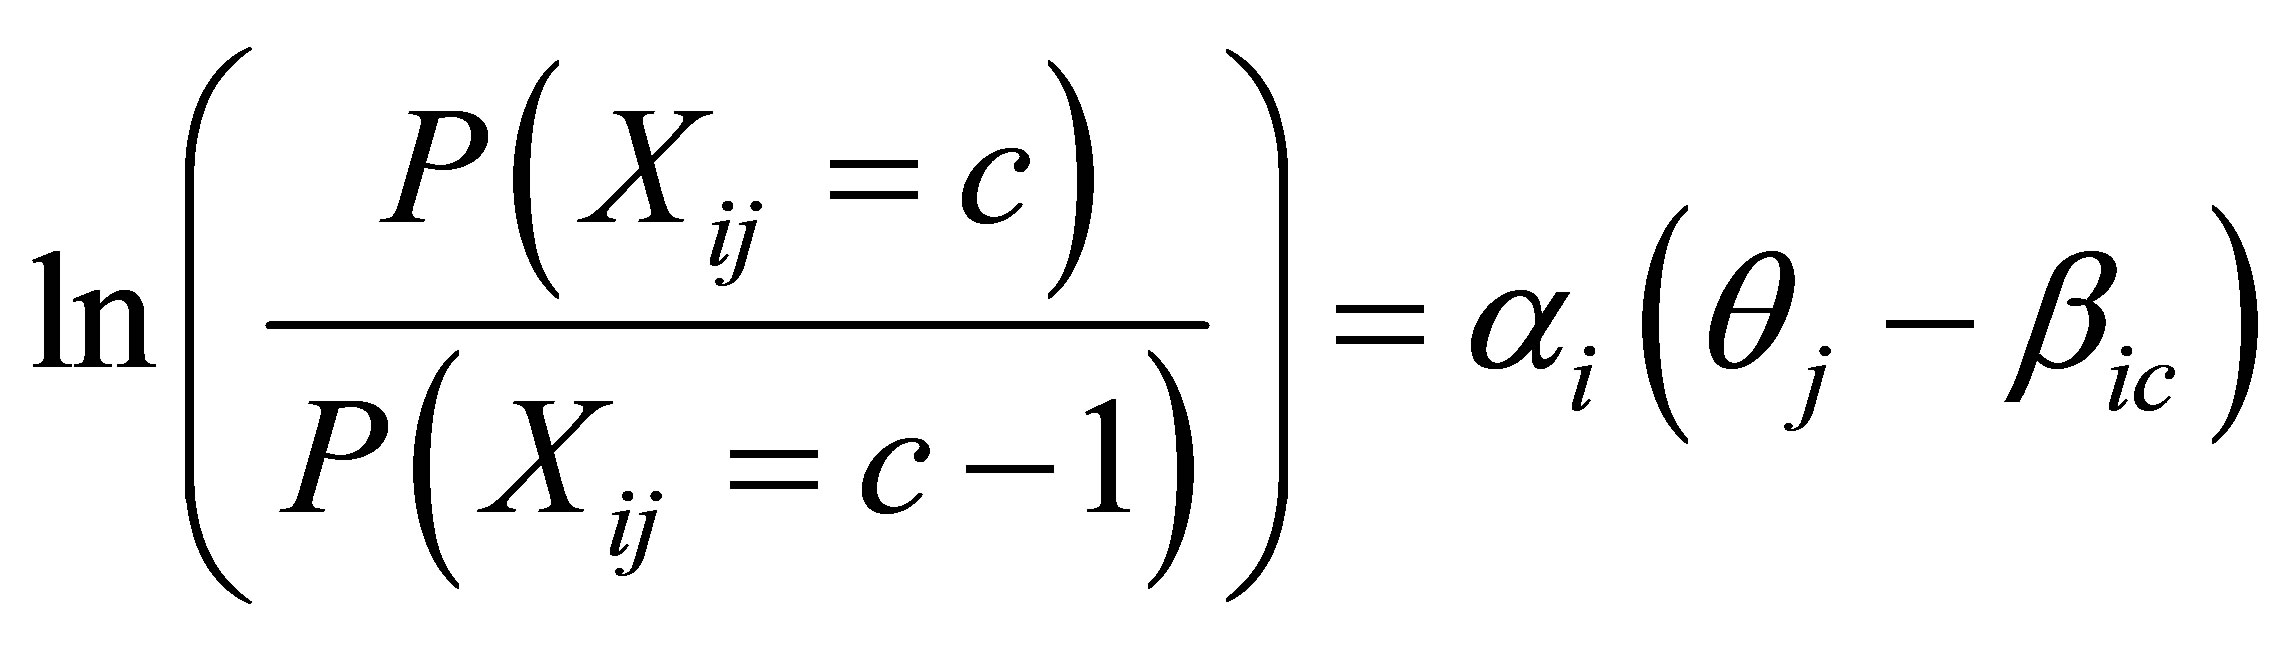
where the item category parameters βic are the values where the category response functions for two adjacent categories intersect (point on latent scale where there is an equal likelihood of selecting two adjacent response categories), the slope parameter αi (only one for each item) described the steepness of the curves, and θj is the IRT score for each person. The GPC model has previously been used in the analysis of health outcomes data [21]. The GPC model assumes that the item response categories have a rank order and was selected over other types of IRT models, such as the partial credit model [39] or the graded response model [40], based on previous successes in the analysis of patient-reported outcome instruments with the GPC model [20-22,25]. Using the item category and slope parameters estimated from the GPC model, IRT scores for the composite fatigue index were estimated using the expected a posteriori (EAP) approach [41]. Scores for the composite fatigue index was rescaled so that the “average” score in the trial population was 50, with a standard deviation of 10, at baseline.
2.5. Analysis of Discriminant Validity and Responsiveness to Change
Analyses were conducted to evaluate and compare the responsiveness of the composite fatigue index with the SF-36 VT and FACIT-Fatigue scales. First, mean changes in each scale from baseline to week 16 were compared between patients who did and did not meet the ACR 20, ACR 50, and ACR 70 response criteria. Student’s t-tests were conducted to test the significance of differences in mean score changes between ACR responder groups. Since each scale was scored using different scaling methods, effect sizes (ES) were computed for each scale by dividing the difference in mean change scores by the baseline standard deviation (SD) of each scale. The ES provided a means to compare the relative magnitude of difference in mean score change between ACR responder groups across scales. Second, the responsiveness of each scale was evaluated by comparing mean changes in scale scores from baseline to week 16 within and between treatment groups. Student’s t-tests were conducted to test the significance of mean changes in scale scores within treatment groups (change from zero) and between each treatment and placebo group. Effect sizes were computed for each scale by dividing the change in score within groups by the baseline SD and the difference in mean change scores between groups by the baseline SD.
Comparisons of the relative efficiency of each scale and index in responding to changes in disease status (ACR response) and treatment were conducted by computing relative validity (RV) coefficients. The RV is computed as a ratio of F-statistics in a given test. Each Student’s t-test was transformed into an F-statistic by squaring the t-statistic. The F-statistic is a ratio of the amount of separation in scores between groups relative to the within-group variance (error). The F-statistic is larger when the separation between groups is larger or when the within-group error variance is smaller. The RV coefficient for each scale and index in each test indicates, in proportional terms, its empirical validity relative to the best measure in the test [42,43].
3. Results
3.1. Patient Characteristics
The average age of the RA trial patients was 55 years (ranging from 26 to 78); 77% of these patients were female and 74% were Caucasian. At baseline, patients showed elevated disease activity. The average number of swollen and tender joints was 11.2 and 14.6, respectively. The mean DAS28 score derived from CRP was 5.7 and the mean DAS28 score derived from ESR was 6.4.
3.2. Factor Analyses
Table 1 presents CFA results for the FACIT-Fatigue and SF-36 VT scale items. In a one-factor model for fatigue, most items loaded strongly on the global factor, except for two items with positive formulation (FACIT7 I have energy and FACIT8 Able to do usual activities). However, model fit was poor (CFI = 0.85, RMSEA = 0.21). A two-factor model improved fit, although not sufficiently (CFI = 0.93, RMSEA = 0.14). Also, items had strong loading on the global factor and some items had strong negative loadings on the form-specific factors (FACIT7, FACIT8, VT3, and VT4), again suggesting that the forms do not define different sub-domains. Acceptable fit (CFI = 0.97, RMSEA = 0.09) was achieved by a model that included two conceptual factors (fatigue impact and vitality) and further specified correlated error terms (local dependence) between adjacent items with similar content (FACIT5/FACIT6, FACIT7/FACIT8, VT1/VT2, VT3/ VT4). Loading on the global factor was strong for all items except FACIT7 and FACIT8, which had weak loadings on the global factor and loaded higher on the specific vitality factor. Based on these results, an IRT model was pursued for the combined set of items. The issue of local dependence was handled by fitting the IRT model in two steps, first excluding the first item from each pair of locally dependent items, then excluding the second item from each pair.
3.3. IRT Analyses
Table 2 presents the item threshold parameters and fit statistics for the generalized partial credit model for the FACIT-Fatigue and SF-36v2 VT items. The most discriminating items (highest slopes) were from the FACITFatigue (FACIT4, FACIT5, and FACIT6). All three of these FACIT-Fatigue items measure the impact of tiredness on the individual’s ability to function. As previously explained, item step parameters indicate the “location” at which each item response option falls on the latent scale, with the latent fatigue scale having a mean of 0 and SD of 1. As shown, the step parameters ranged from −4.53 (FACIT10 Too tired to eat) to 5.78 (FACIT8 Able to do usual activities). In looking at the location values, which is the mean of the step parameters of each item, the item indicative of the greatest impairment (“easiest item”) is FACIT10 (−2.14, Too tired to eat) and the item indicative of the least impairment (“hardest item”) is FACIT7 (1.72, Have energy). Lastly, only one item, VT03, showed significant misfit (Chi-square was 30.4, df = 15, p < 0.01), however the result was considered non-significant after controlling for multiple testing.
Table 3 presents mean changes in fatigue scale scores by ACR responder groups (ACR20, ACR50, and ACR70). As shown, mean changes in all fatigue scales differed significantly between the ACR responder groups in the hypothesized manner. Patients categorized as responders showed significantly greater improvement in fatigue scale scores than non-responders. As shown, the SF-36 VT scale had the largest effect size in tests involving the ACR50 and ACR70 response criteria, while the composite fatigue index had a slightly higher effect size in the test involving the ACR20 response criteria. The composite fatigue index was the most efficient at discriminating between responders and non-responders in tests involving the ACR20 and ACR50 response criteria. In these two tests, the SF-36 VT scale was 65% (ACR 20) and 91% (ACR 50) as efficient, and the FACIT-Fatigue was 95% (ACR 20) and 89% (ACR 50) as efficient. In the test involving the ACR70 response criteria, the SF-36 VT scale was most efficient at discriminating between re-

Table 1. Factor analysis of fatigue and vitality items.
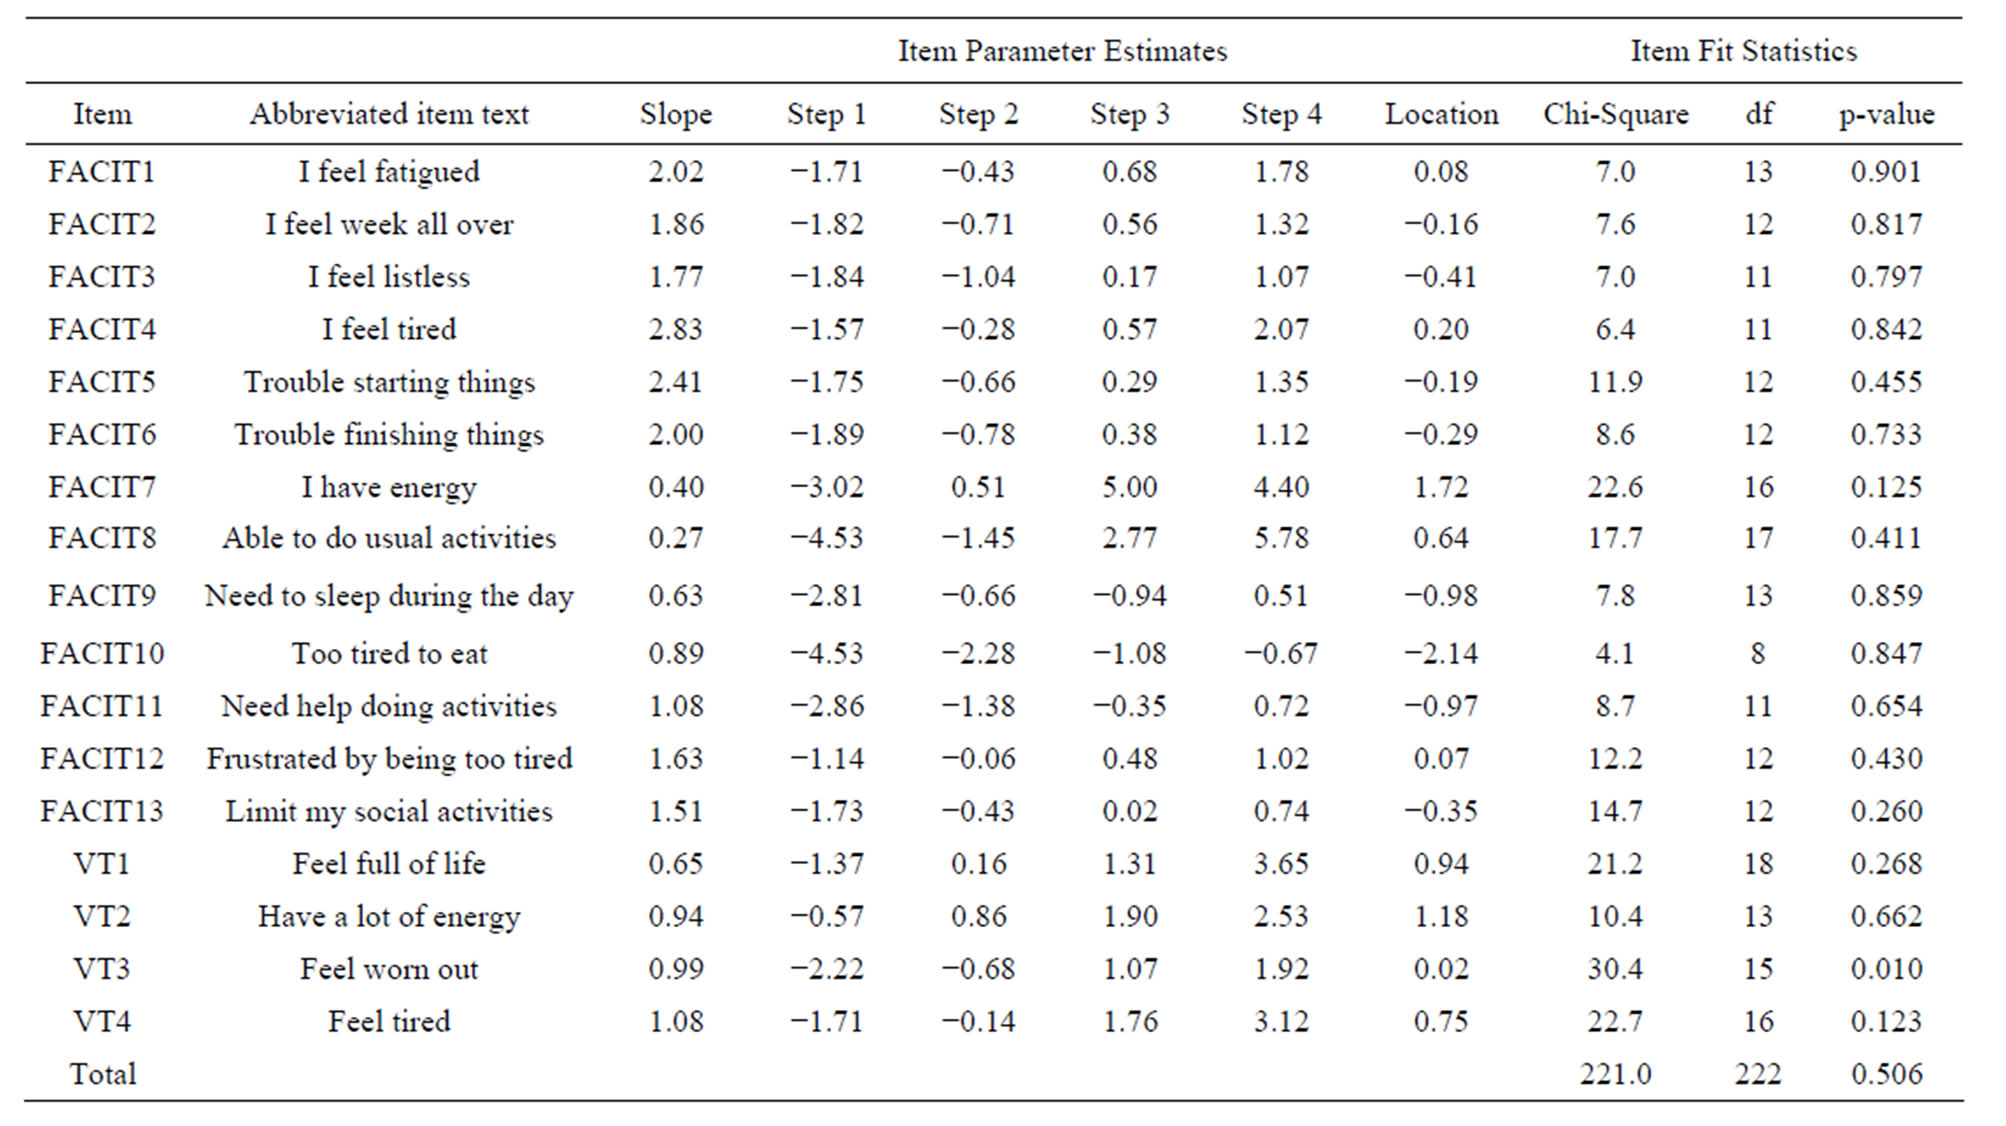
Table 2. IRT parameter estimates and fit statistics for FACIT fatigue and SF-36 VT items.
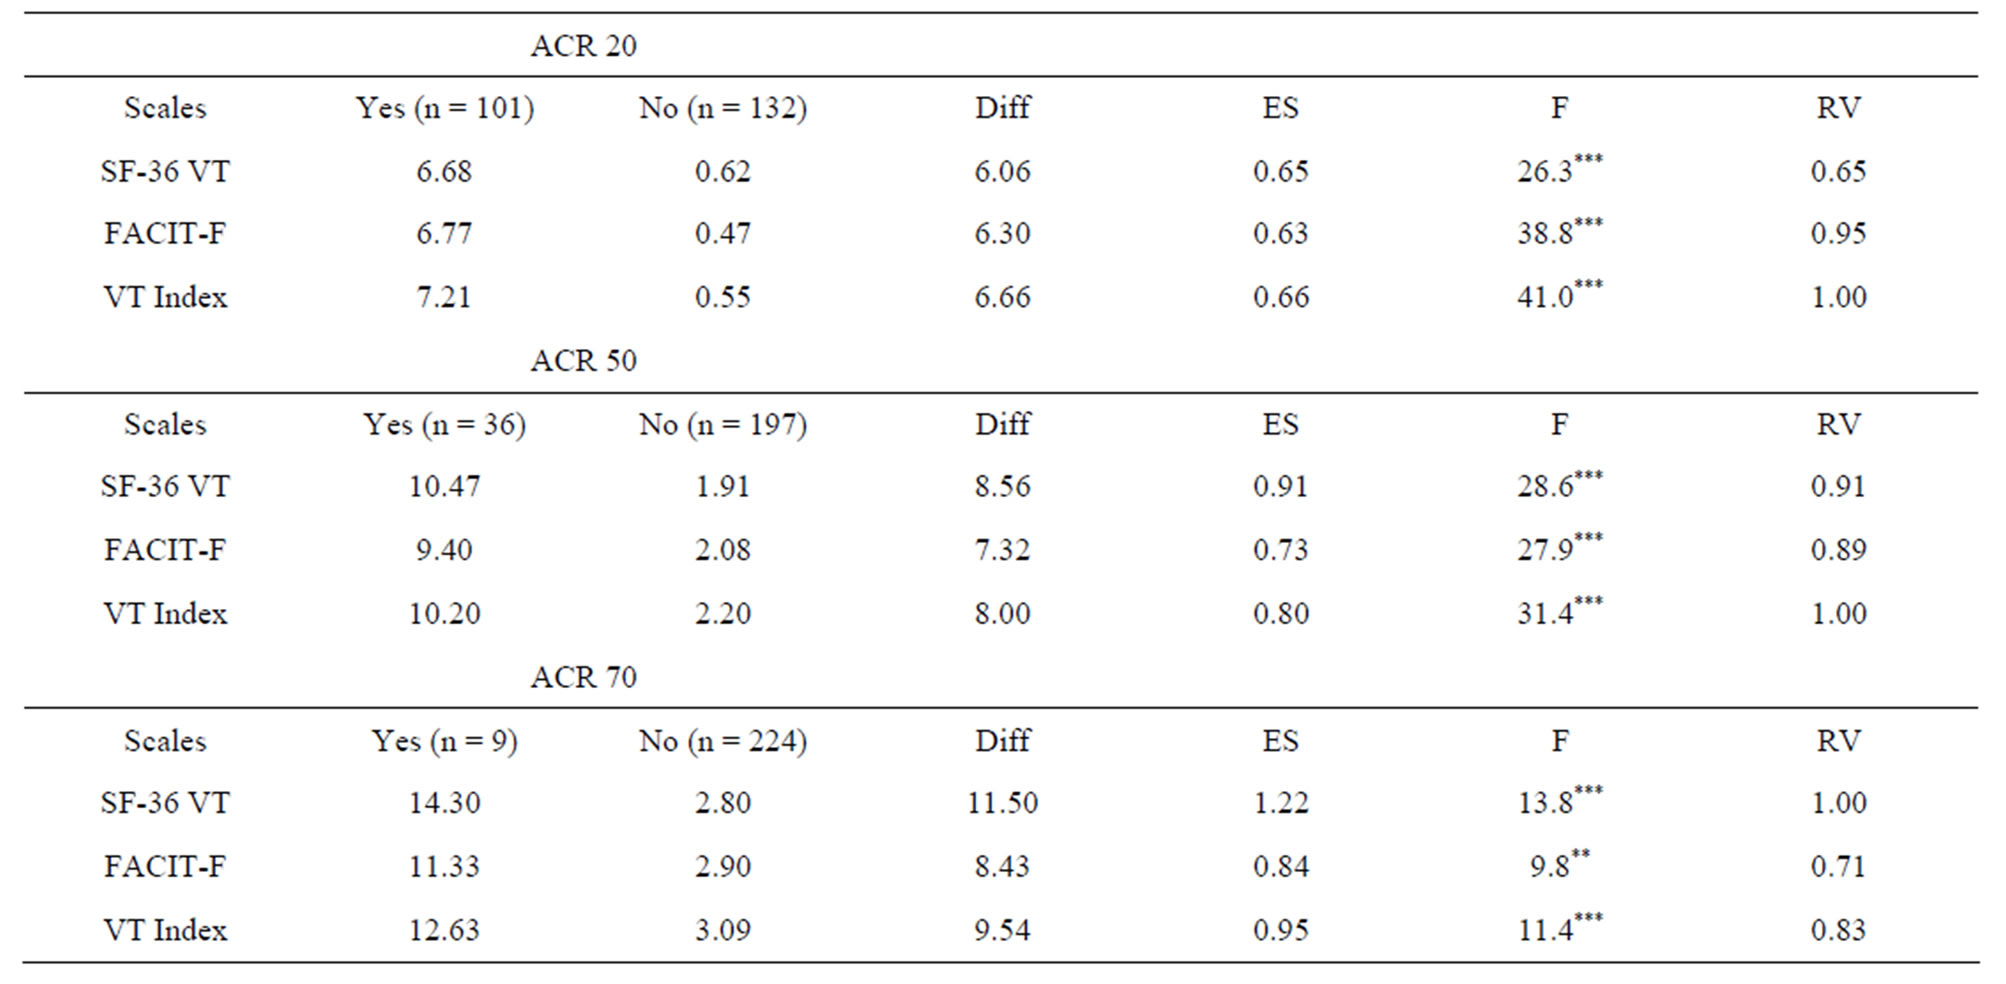
Table 3. Comparison of mean changes fatigue scale scores by ACR response categories.
sponder and non-responder, followed by the composite fatigue index (83%) and the FACIT-Fatigue (71%).
Table 4 presents changes from baseline to week 16 for each of the fatigue scales by treatment group. From the within-groups analyses the composite fatigue index was found to be the most responsive to secukinumab treatment for all 4 secukinumab dose groups compared to the SF-36 VT and FACIT-F scales. Across secukinumab dose groups the effect size for the composite fatigue index was 11% - 93% larger than the effect sizes observed for the SF-36 VT and FACIT-F scales. In addition, the F-statistics testing the difference in change score from 0 within each of the secukinumab dose groups was largest for the composite fatigue index, indicating a greater response to treatment. In the between-groups analyses, both the 75 mg (mean difference of 3.4 points, F = 3.8, p < 0.05) and 150 mg (mean difference of 4.2 points, F = 4.8, p < 0.05) secukinumab groups showed significantly greater improvement in fatigue scores on the composite index compared to placebo. No significant differences in change scores between the 75 mg and 150 mg dose groups and placebo was observed with either the SF-36 VT or FACIT-F scales.
4. Discussion
In this study, we used factor analytic and IRT methods to evaluate the measurement properties of the FACIT-Fatigue and SF-36 VT scale in the context of an RA clinical trial setting. The purpose of these analyses was to evaluate the possibility of combining the items of the two fatigue measures to score one composite index. Additional tests were conducted to determine whether combining the items from the two fatigue measures resulted in a scale that is more responsive to changes in disease status and treatment effects.
A requirement for combining items from different scales to score a composite index using IRT methods is evidence supporting unidimensionality, namely, evidence that shows all items to be defining one underlying construct. While a requirement for fitting an IRT model, the broader implication of items not fitting a unidimensional construct warrants further interpretation. Scales that combine items of various concepts into one scale are difficult to interpret as the item-content driving a difference in score between groups or a change in score over time is largely unknown. Furthermore, combining items that lack unidimensionality calls into question whether the scale validly measures the concept it was intended to measure. The results of factor analyses of the fatigue items of the FACIT-Fatigue and SF-36 VT scale did not point unequivocally to either a unidimensional or multidimensional structure underlying the items. Fit of the FACIT-Fatigue and SF-36 VT items to a unidimensional model was not ideal. Specification of survey-specific factors for the FACIT-Fatigue and SF-36v2 VT scale showed minimal improvement in model fit. Specification of models consisting of factors that were more conceptually based, such as fatigue impact and vitality for the fatigue index, showed the best overall model fit. However, all items showed sufficiently strong correlations on the global fatigue factor to warrant fitting a single IRT model. One potential source of the model fit problem may be
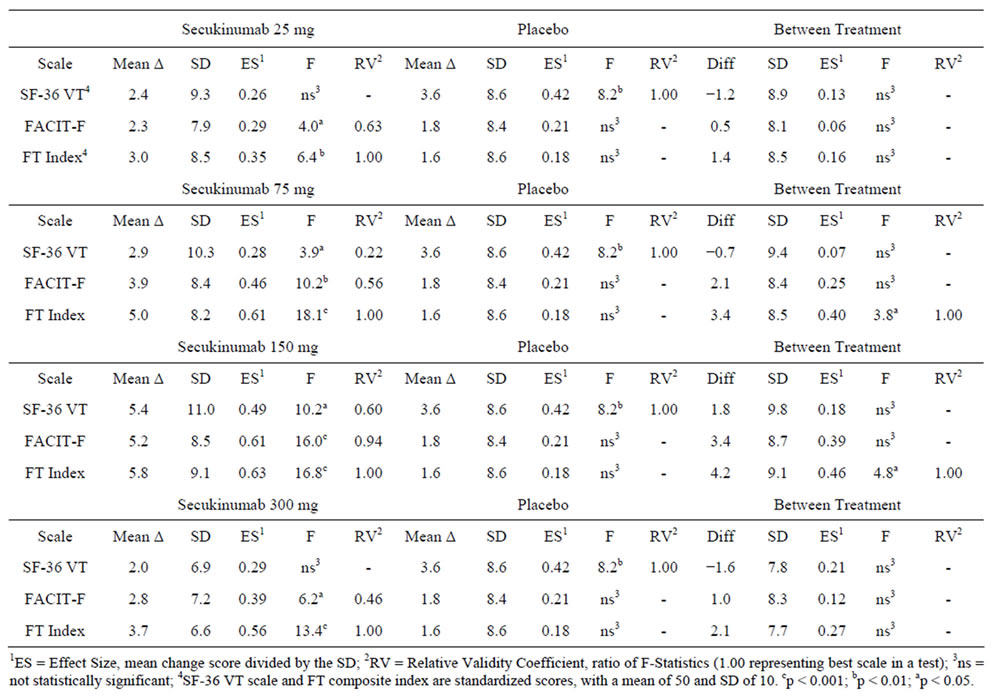
Table 4. Comparison of treatment outcomes (baseline to week 16) across the SF-36v2 vitality (VT) and FACIT-fatigue scales, and a composite fatigue (FT) index comprised of the cross calibration of items from both SF-36v2 VT and FACIT-fatigue items.
due to the use of baseline data from the trial. Inclusion and exclusion criteria in clinical trials are often designed to produce a fairly homogenous sample with respect to disease activity. This in turn can result in less variability in item response distributions, which can potentially pose a challenge in psychometric testing. In data not shown, fit of a unidimensional model improved significantly with data from post-treatment assessment periods for the fatigue items due in part to more variability in item response distributions.
Despite less than optimal fit to a unidimensional structure observed for fatigue items, the strength of the current study lies in comparing the composite fatigue index to the original scales in terms of responsiveness to changes in underlying clinical status, such as ACR improvement criteria. The results showed that the composite fatigue index was more responsive to changes in clinical disease activity than the FACIT-Fatigue and SF-36 VT scales in tests involving the ACR20 and ACR50. In tests of treatment response, the composite fatigue index showed larger effect sizes than the original scales with the within-group evaluation of changes in scores for each dose group. Additionally, the composite fatigue index showed a greater response to treatment in comparisons of outcome scores between the 150 mg secukinumab dose group and placebo. These findings suggest that the deviation from unidimensionality detected with the psychometric tests had little impact on the ability of each index to respond in hypothesized ways to changes in underlying clinical status and treatment effects.
Previous studies investigating the implications of applying IRT methods to the scoring of a composite physiccal functioning index resulted in improved responsiveness to changes in disease status and treatment effects [27]. For example, item parameters estimated with IRT methods showed that the items of the Health Assessment Questionnaire (HAQ) and SF-36v2 physical functioning scale defined different ranges of physical functioning, with the HAQ items defining a very low range and the SF-36 defining a higher range of functioning [27,44]. The consequence of combining the items from both instruments extended the range of physical functioning measured and reduced problematic ceiling and floor effects, which resulted in improve responsiveness [27]. However, the explanation as to why the composite fatigue index performed relatively better than the original scales in this study seems less straightforward. Evaluating the IRT item parameters does not clearly indicate that either the FACIT-Fatigue or the SF-36 VT scale defines different ranges of the fatigue spectrum. In fact, both instruments conceptualize fatigue as a bipolar concept, including items that measure fatigue (lower range) and energy (upper range). Interestingly, the item parameters of “energy” (FACIT7, FACIT8, VT1, VT2) were less discriminating in both instruments as indicated by the magnitude of the slope parameters. This may be attributed to a greater number of items that measure fatigue. While further research is necessary to understand why the composite fatigue index performed better than the original scales, one possible explanation could be that the IRT item parameters provide better scaling of item responses by spreading them more appropriately throughout the continuum of fatigue as opposed to treating each item equally, as would the sum score approach. For example, the item FACIT12 (too tired to eat) has an item category parameter of −4.53, which defines a place on the continuum of fatigue that is almost 5 standard deviation units below the average of 0 in the trial sample, whereas the item category parameter of the item FACIT8 (able to do usual activities) has a value of +5.78, which is nearly 6 standard deviation units above the average of 0 in the trial sample. These parameter estimates are more than 9 standard deviations apart, yet the sum score approach would weight these items equally in the total score. This difference in the manner in which items are scored may explain the difference in the performance of the composite fatigue index over the original scales.
Several limitations of this study are recognized. First, this study included a relatively small sample size for IRT modeling. It is possible that the small sample size lacked the power to produce robust item parameter estimates as well as the ability to detect misfit or item bias among the items. Further studies with larger sample sizes are necessary to determine the underlying structures of both physical function and fatigue items from the instruments evaluated in this study. Another potential limitation concerns the use of multiple language versions of questionnaires in this trial. Coupled with the relatively small sample size, any chance of evaluating item bias as a result of differences in language was negligible. Such item bias tends to add noise in model testing of unidimensionality and parameter estimation. Additional studies in multinational settings with larger sample sizes is warranted to understand any differential item functioning that arises due to language or cultural differences.
5. Conclusion
In conclusion, IRT methods were useful in evaluating the underlying measurement properties of two widely used fatigue measures in RA treatment studies. Specifically, the use of IRT methods to cross calibrate the items from two different fatigue scales improved the measurement precision over a larger continuum on the latent physical fatigue measure, as compared to the original scales. Combining the best features of each instrument yielded a more powerful measure with greater sensitivity to clinical change and treatment response. As demonstrated in this study, a more precise measure may be important in deciding the optimal dose in treating patients with RA.
REFERENCES
- D. Symmons, G. Turner, R. Webb, et al., “The Prevalence of Rheumatoid Arthritis in the United Kingdom: New Estimates for a New Century,” Rheumatology, Vol. 41, No. 7, 2002, pp. 793-800. http://dx.doi.org/10.1093/rheumatology/41.7.793
- K. Jordan, A. M. Clarke, D. P. Symmons, D. Fleming, M. Porcheret, U. T. Kadam, et al., “Measuring Disease Prevalence: A Comparison of Musculoskeletal Disease Using Four General Practice Consultation Databases,” British Journal of General Practices, Vol. 57, No. 534, 2007, pp. 7-14.
- L. A. Rodriguez, L. B. Tolosa, A. Ruigomez, S. Johansson and M. A. Wallander, “Rheumatoid Arthritis in UK Primary Care: Incidence and Prior Morbidity,” Scandinavia Journal of Rheumatology, Vol. 38, No. 3, 2009, pp. 173- 177. http://dx.doi.org/10.1080/03009740802448825
- M. M. Ward, H. S. Javitz and E. H. Yelin, “The Direct Cost of Rheumatoid Arthritis,” Value Health, Vol. 3, No. 4, 2000, pp. 243-252. http://dx.doi.org/10.1046/j.1524-4733.2000.34001.x
- R. C. Kessler, J. R. Maclean, M. Petukhova, C. A. Sarawate, L. Short, T. T. Li, et al., “The Effects of Rheumatoid Arthritis on Labor Force Participation, Work Performance, and Healthcare Costs in Two Workplace Samples,” Journal of Occupational and Environmental Medicine, Vol. 50, No. 1, 2008, pp. 88-98. http://dx.doi.org/10.1097/JOM.0b013e31815bc1aa
- R. J. Ozminkowski, W. N. Burton, R. Z. Goetzel, R. Maclean and S. Wang, “The Impact of Rheumatoid Arthritis on Medical Expenditures, Absenteeism, and Short-Term Disability Benefits,” Journal of Occupational and Environmental Medicine, Vol. 48, No. 2, 2006, pp. 135-148. http://dx.doi.org/10.1097/01.jom.0000194161.12923.52
- C. H. van Jaarsveld, J. W. Jacobs, A. J. Schrijvers, G. A. Albada-Kuipers, D. M. Hofman and J. W. Bijlsma, “Effects of Rheumatoid Arthritis on Employment and Social Participation during the First Years of Disease in The Netherlands,” British Journal of Rheumatology, Vol. 37, No. 8, 1998, pp. 848-853. http://dx.doi.org/10.1093/rheumatology/37.8.848
- F. Wolfe, K. Michaud, H. K. Choi and R. Williams, “Household Income and Earnings Losses among 6396 Persons with Rheumatoid Arthritis,” Journal of Rheumatology, Vol. 32, No. 10, 2005, pp. 1875-1883.
- M. Kosinski, S. C. Kujawski, R. Martin, L. A. Wanke, M. C. Buatti, J. E. Ware, et al., “Health-Related Quality of Life in Early Rheumatoid Arthritis: Impact of Disease and Treatment Response,” American Journal of Managed Care, Vol. 8, No. 3, 2002, pp. 231-240.
- T. P. Suurmeijer, M. Waltz, T. Moum, F. Guillemin, F. L. van Sonderen, S. Briancon, et al., “Quality of Life Profiles in the First Years of Rheumatoid Arthritis: Results from the EURIDISS Longitudinal Study,” Arthritis Rheum, Vol. 45, No. 2, 2001, pp. 111-121. http://dx.doi.org/10.1002/1529-0131(200104)45:2<111::AID-ANR162>3.0.CO;2-E
- J. Talamo, A. Frater, S. Gallivan and A. Young, “Use of the Short Form 36 (SF36) for Health Status Measurement in Rheumatoid Arthritis,” British Journal of Rheumatology, Vol. 36, No. 4, 1997, pp. 463-469. http://dx.doi.org/10.1093/rheumatology/36.4.463
- T. Sokka, B. Abelson and T. Pincus, “Mortality in Rheumatoid Arthritis: 2008 Update,” Clinical and Experimental Rheumatology, Vol. 26, No. 5, 2008, pp. S35-S61.
- A. M. Wasserman, “Diagnosis and Management of Rheumatoid Arthritis,” American Family Physician, Vol. 84, No. 11, 2011, pp. 1245-1252.
- K. G. Saag, G. G. Teng, N. M. Patkar, J. Anuntiyo, C. Finney, J. R. Curtis, et al., “American College of Rheumatology 2008 Recommendations for the Use of Nonbiologic and Biologic Disease-Modifying Antirheumatic Drugs in Rheumatoid Arthritis,” Arthritis Rheum, Vol. 59, No. 6, 2008, pp. 762-784. http://dx.doi.org/10.1002/art.23721
- R. B. Terry and G. Singh, “Quality of Life Measures in the Treatment of Arthritis in Clinical Practice,” New Standards in Arthiritis Care, Vol. 5, No. 3, 2013, pp. 2-6.
- T. Pincus, R. H. Brooks and L. F. Callahan, “Prediction of Long Term Mortality in Patients with Rheumatoid Arthritis According to Simple Questionnaire and Joint Count Measures,” Annals of Internal Medicine, Vol. 120, No. 1, 1994, pp. 26-34. http://dx.doi.org/10.7326/0003-4819-120-1-199401010-00005
- D. Aletaha, R. Landewe, T. Karonitsch, J. Bathon, M. Boers, C. Bombardier, et al., “Reporting Disease Activity in Clinical Trials of Patients with Rheumatoid Arthritis: EULAR/ACR Collaborative Recommendations,” Annals of the Rheumatic Diseases, Vol. 67, No. 10, 2008, pp. 1360-1364. http://dx.doi.org/10.1136/ard.2008.091454
- J. E. Ware Jr. and C. D. Sherbourne, “The MOS 36-Item Short-Form Health Survey (SF-36). I. Conceptual Framework and Item Selection,” Medical Care, Vol. 30, No. 6, 1992, pp. 473-483. http://dx.doi.org/10.1097/00005650-199206000-00002
- D. Cella, S. Yount, M. Sorensen, E. Chartash, N. Sengupta and J. Grober, “Validation of the Functional Assessment of Chronic Illness Therapy Fatigue Scale Relative to Other Instrumentation in Patients with Rheumatoid Arthritis,” Journal of Rheumatology, Vol. 32, No. 5, 2005, pp. 811-819.
- J. B. Bjorner, M. Kosinski, X. Sun and J. E. Ware Jr., “Calibration of Item Banks for Use in Improving Estimates of Eight SF-36 Health Constructs,” 2006.
- J. B. Bjorner, M. Kosinski and J. E. Ware Jr., “Using Item Response Theory to Calibrate the Headache Impact Test (HIT) to the Metric of Traditional Headache Scales,” Quality Life Research, 2003, pp. 981-1002. http://dx.doi.org/10.1023/A:1026123400242
- J. B. Bjorner, M. Kosinski and J. E. Ware Jr., “Calibration of an Item Pool for Assessing the Burden of Headaches: An Application of Item Response Theory to the Headache Impact Test (HIT™),” Quality of Life Research, Vol. 12, No. 8, 2003, pp. 887-902. http://dx.doi.org/10.1023/A:1026175112538
- J. Fries, M. Rose and E. Krishnan, “The PROMIS of Better Outcome Assessment: Responsiveness, Floor and Ceiling Effects, and Internet Administration,” Journal of Rheumatology, Vol. 38, No. 8, 2011, pp. 1759-1764. http://dx.doi.org/10.3899/jrheum.110402
- M. Rose, J. B. Bjorner, J. Becker, J. F. Fries and J. E. Ware, “Evaluation of a Preliminary Physical Function Item Bank Supported the Expected Advantages of the Patient-Reported Outcomes Measurement Information System (PROMIS),” Journal of Clinical Epidemiology, Vol. 61, No. 1, 2008, pp. 17-33. http://dx.doi.org/10.1016/j.jclinepi.2006.06.025
- J. B. Bjorner, M. Kosinski and J. E. Ware Jr., “The Feasibility of Applying Item Response Theory to Measures of Migraine Impact: A Reanalysis of Three Clinical Studies,” Quality Life Research, Vol. 12, No. 8, 2003, pp. 887-902. http://dx.doi.org/10.1023/A:1026175112538
- M. Kosinski, J. B. Bjorner, J. E. Ware Jr., A. Batenhorst and R. K. Cady, “The Responsiveness of Headache Impact Scales Scored Using ‘Classical’ and ‘Modern’ Psychometric Methods: A Re-Analysis of Three Clinical Trials,” Quality Life Research, Vol. 12, No. 8, 2003, pp. 903-912. http://dx.doi.org/10.1023/A:1026111029376
- M. Martin, M. Kosinski, J. B. Bjorner, J. E. Ware Jr., R. Maclean and T. Li, “Item Response Theory Methods Can Improve the Measurement of Physical Function by Combining the Modified Health Assessment Questionnaire and the SF-36 Physical Function Scale,” Quality Life Research, Vol. 16, No. 4, 2007, pp. 647-660. http://dx.doi.org/10.1007/s11136-007-9193-5
- M. Genovese, P. Durez, H. Richards, et al., “Secukinumab Improves Signs and Symptoms in Patients with Active Rheumatoid Arthritis: Results of Dose-Finding, Double-Blind, Randomized, Placebo-Controlled, Phase II Studies,” World Psoriasis & Psoriatic Arthritis Conference, 2012.
- D. Cella, “The Functional Assessment of Cancer Therapy-Anemia (FACT-An) Scale: A New Tool for the Assessment of Outcomes in Cancer Anemia and Fatigue,” Seminars in Hematology, Vol. 34, No. 3, 1997, pp. 13-19.
- D. F. Cella, D. S. Tulsky, G. Gray, B. Sarafian, E. Linn, A. Bonomi, et al., “The Functional Assessment of Cancer Therapy Scale: Development and Validation of the General Measure,” Journal of Clinical Oncology, Vol. 11, No. 3, 1993, pp. 570-579.
- K. Webster, D. Cella and K. Yost, “The Functional Assessment of Chronic Illness Therapy (FACIT) Measurement System: Properties, Applications, and Interpretation,” Health Quality Life Outcomes, Vol. 1, 2003, p. 79. http://dx.doi.org/10.1186/1477-7525-1-79
- J. E. Ware Jr., K. K. Snow, M. Kosinski and B. Gandek, “SF-36 Health Survey Manual and Interpretation Guide,” The Health Institite, New England Medical Center, Boston, 1993.
- J. E. Ware Jr., M. Kosinski and J. Dewey, “How to Score Version Two of the SF-36 Health Survey,” Quality Metric Inc., Lincoln, 2000.
- “Mplus User’s Guide [Computer Program],” Version 1. Muthén & Muthén, Los Angeles, 1998.
- P. M. Bentler, “Comparative Fit Indexes in Structural Models,” Psychological Bulletin, Vol. 107, No. 2, 1990, pp. 238-246. http://dx.doi.org/10.1037/0033-2909.107.2.238
- L. Hu and P. M. Bentler, “Cutoff Criteria for Fit Indexes in Covariance Structure Analysis: Conventional Criteria versus New Alternatives,” Structural Equation Modeling, Vol. 6, No. 1, 1999, pp. 1-55. http://dx.doi.org/10.1080/10705519909540118
- M. W. Browne and R. Cudeck, “Alternative Ways of Assessing Model Fit,” Sociological Methods and Research, Vol. 21, No. 2, 1992, pp. 230-258. http://dx.doi.org/10.1177/0049124192021002005
- R. P. McDonald, “Test Theory: A Unified Treatment,” Lawrence Erlbaum Associates, Hillsdale, 1999.
- G. N. Mastersm, “A Rasch Model for Partial Credit Scoring,” Psychometrika, Vol. 47, No. 2, 1982, pp. 149-173. http://dx.doi.org/10.1007/BF02296272
- F. Samejima, “Graded Response Model,” In: W. J. van der Linden and R. K. Hambleton, Eds., Handbook of Modern Item Response Theory, Springer, Berlin, 1997, pp. 85-100. http://dx.doi.org/10.1007/978-1-4757-2691-6_5
- R. D. Bock and R. J. Mislevy, “Adaptive EAP Estimation of Ability in a Microcomputer Environment,” Applied Psychological Measurement, Vol. 6, No. 4, 1982, pp. 431-444. http://dx.doi.org/10.1177/014662168200600405
- C. A. McHorney, J. E. Ware Jr. and A. E. Raczek, “The MOS 36-Item Short-Form Health Survey (SF-36): II. Psychometric and Clinical Tests of Validity in Measuring Physical and Mental Health Constructs,” Medical Care, Vol. 31, No. 3, 1993, pp. 247-263. http://dx.doi.org/10.1097/00005650-199303000-00006
- C. A. McHorney, S. M. Haley and J. E. Ware Jr., “Evaluation of the MOS SF-36 Physical Function Scale (PF-10): II. Comparison of Relative Precision Using Likert and Rasch Scoring Methods,” Journal of Clinical Epidemiology, Vol. 50, No. 4, 1997, pp. 451-461. http://dx.doi.org/10.1016/S0895-4356(96)00424-6
- W. J. Taylor and K. M. McPherson, “Using Rasch Analysis to Compare the Psychometric Properties of the Short Form 36 Physical Function Score and the Health Assessment Questionnaire Disability Index in Patients with Psoriatic Arthritis and Rheumatoid Arthritis,” Arthritis Care & Research, Vol. 57, No. 5, 2007, pp. 723-729. http://dx.doi.org/10.1002/art.22770
List of Abbreviations
CFI: Comparative Fit Index
CRP: C-Reactive Protein
EAP: Expected a Posteriori
ES: Effect Size
ESR: Erythrocyte Sedimentation Rate
FACIT: Functional Assessment of Chronic Illness Therapy
GPC: Generalized Partial Credit
HAQ: Health Assessment Questionnaire
HRQoL: Health Related Quality of Life
IRT: Item Response Theory
PRO: Patient Reported Outcome
RA: Rheumatoid Arthritis
RMSEA: Root Mean Square Error of Approximation
RV: Relative Validity
SD: Standard Deviation
VT: Vitality
NOTES
*Competing Interests: Mr. Gnanasakthy, Dr. Mallya, and Dr. Mpofu are employees of Novartis and own shares of stock from the company. Mr. Kosinski and Dr. Bjorner have no financial interests related to the work presented in this paper.
Authors’ contributions: All authors were involved in the drafting of the article or reviewing it critically for important intellectual content. In addition, all authors approved the final draft to be published. Mr. Kosinski had full access to all of the data in the study and takes responsibility for the integrity of the data and the accuracy of the data analysis.
#Corresponding author.