Natural Resources
Vol.08 No.11(2017), Article ID:80829,41 pages
10.4236/nr.2017.811045
Petroleum Source-Rock Evaluation and Hydrocarbon Potential in Montney Formation Unconventional Reservoir, Northeastern British Columbia, Canada
Edwin I. Egbobawaye
Department of Earth and Atmospheric Sciences, University of Alberta, Edmonton, Canada

Copyright © 2017 by author and Scientific Research Publishing Inc.
This work is licensed under the Creative Commons Attribution International License (CC BY 4.0).
http://creativecommons.org/licenses/by/4.0/


Received: December 29, 2016; Accepted: November 27, 2017; Published: November 30, 2017
ABSTRACT
Source-rock characteristics of Lower Triassic Montney Formation presented in this study shows the total organic carbon (TOC) richness, thermal maturity, hydrocarbon generation, geographical distribution of TOC and thermal maturity (Tmax) in Fort St. John study area (T86N, R23W and T74N, R13W) and its environs in northeastern British Columbia, Western Canada Sedimentary Basin (WCSB). TOC richness in Montney Formation within the study area is grouped into three categories: low TOC (<1.5 wt%), medium TOC (1.5 - 3.5 wt%), and high TOC (>3.5 wt%). Thermal maturity of the Montney Formation source-rock indicates that >90% of the analyzed samples are thermally mature, and mainly within gas generating window (wet gas, condensate gas, and dry gas), and comprises mixed Type II/III (oil/gas prone kerogen), and Type IV kerogen (gas prone). Analyses of Rock-Eval parameters (TOC, S2, Tmax, HI, OI and PI) obtained from 81 samples in 11 wells that penetrated the Montney Formation in the subsurface of northeastern British Columbia were used to map source rock quality across the study area. Based on total organic carbon (TOC) content mapping, geographical distribution of thermal maturity (Tmax), including evaluation and interpretation of other Rock-Eval parameters in the study area, the Montney Formation kerogen is indicative of a pervasively matured petroleum system in the study area of northeastern British Columbia.
Keywords:
Petroleum, Source-Rock, Rock-Eval, Oil and Gas, Kerogen, Vitrinite Reflectance, Hydrocarbon Reservoir, Montney Formation, Geology, TOC, Tmax, Pyrolysis, Hydrocarbon Generation, British Columbia, Western Canada Sedimentary Basin, WCSB

1. Introduction
Source-rocks are precursors for hydrocarbon accumulation and reservoir potential. In general, source rocks are organic rich sediments that have, or may generate hydrocarbons [1] , and are a primary element in any petroleum system [2] . Successful exploration for oil and gas depends largely upon the quality of source-rock. To determine source rock quantity, total organic carbon (TOC) content, and quality, Rock-Eval technique is used. Rock-Eval pyrolysis methods have been utilized worldwide for more than three decades as an aid to determining source-rock parameters: Tmax, TOC richness, Hydrogen Index (HI), Oxygen Index (OI), Production Index (PI), the remaining hydrocarbon generating potential (S2), and a host of other products [3] - [11] . Rock-Eval pyrolysis is used to rapidly evaluate and depict the petroleum generating potentials of prospective source rocks [11] by providing information about their: 1) kerogen type and organic matter quality; 2) type of organic matter and characteristics; 3) thermal maturity of the organic matter; and 4) hydrocarbon type (oil, gas or both).
The geographical distribution of source-rocks parameters within a particular acreage of exploration objective constitutes part of the assessment mechanics of hydrocarbon exploration [11] . Source-rock evaluation involves assessing the hydrocarbon generating potential of sediments by examining the sediment’s capacity for hydrocarbon generation, type of organic matter present and what hydrocarbons might be generated, including sediment’s thermal maturity and how it has influenced generation [12] . To understand source-rock potential in Montney Formation, Rock-Eval method was utilized.
The Triassic Montney Formation in Forth St. John study area (T86N, R23W and T74N, R13W), northeastern British Columbia (Figure 1) is classified as unconventional hydrocarbon reservoir [13] - [19] ). In general, unconventional hydrocarbon reservoirs comprises tight gas, shale gas and coalbed methane [20] . Until recently, these reservoirs were previously considered non-economical, unproductive, and non-exploitable geological formations owing to poor under- standing of lithological heterogeneity and variability in mineralogy coupled with less advanced technology. However, improved technology has revolutionised unconventional or tight reservoirs. The inherent petrophysical properties of unconventional reservoirs are low matrix porosity of ≤10% and permeability of ≤0.1 mD millidarcy, exclusive of fracture permeability [20] . Typically, these reservoirs depend on stimulation for production, and in general, contain large amounts of hydrocarbons; although, gas recovery factors may be low [21] .
The Montney Formation in the study area is a primary focus of unconventional gas reservoir exploration in Western Canada Sedimentary Basin (WCSB) because: 1) it is a source rock rich in organic matter [22] ; 2) it has a thermal maturity that lies within gas generating window, and it is primarily a gas prone mixed Type II/III kerogen [22] ; 3) the present study shows that the kerogen of the Montney Formation in the study area is mainly composed of Type III/IV and
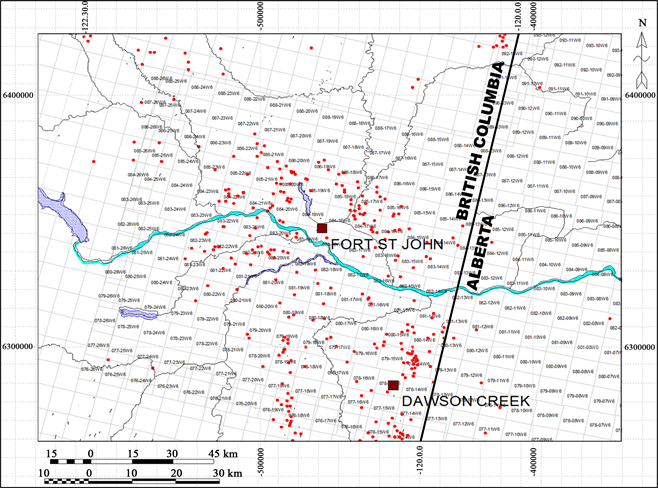
Figure 1. Location map of study area showing wells (red color) that penetrated Montney Formation in northeastern British Columbia and Alberta, Canada.
some mixed Type II/III kerogen with average TOC range of 0.5% - 4wt%; and upto 8.2wt% TOC (rare), but present); 4) it has a reservoir thickness upto 320 meters in the study area; 5) it hosts substantial volumes (Natural Gas reserve = 271 TCF), Liquefied Natural Gas (LNG = 12,647 million barrels), and oil reserve (29 million barrels) according to BC Ministry of Energy, Mines and Natural Gas [23] ; and 6) porosity range from 2% - 10%, and sporadically > 10% in some intervals where ichnofabric or dolomite dissolution have resulted in the formation of secondary porosity. These criteria make the Montney Formation an unconventional resource play with high potential within Fort St. John study area, northeastern British Columbia (Figure 1). However, despite the strong economic significance of this hydrocarbon resource hosted in finer-grained lithologies “siltstone/very fine-grained sandstone” interval, the location and predictability of the best reservoir units remains conjectural: in large part because the geochemistry, lithologic variability, and mineralogy of the Montney tight-rocks hosting thermogenic gas in the subsurface of Western Canada has not been adequately characterized [2] [18] [19] .
The Montney Formation in the study area consists of siltstone with subor- dinate interlaminated very fine-grained sandstone. [2] [24] shows that five lithofacies were identified in the study area: Lithofacies F-1 (organic rich, wavy laminated black siltstone); Lithofacies F-2 (very fine-grained sandstone inter-bedded with siltstone); Lithofacies F-3A (bioturbated silty-sandstone attributed to the Skolithos ichnofacies); Lithofacies F-3B (bioturbated siltstone composed of Cruziana ichnofacies); Lithofacies F-4 (dolomitic siltstone interbedded with very fine-grained sandstone); and Lithofacies F-5 (massive siltstone).
The depositional environments interpreted for the Montney Formation in the study area is characteristic of lower shoreface through proximal offshore to distal offshore settings [2] [24] . The lower shoreface environment record trace fossils attributed to the Skolithos ichnofacies [25] . The proximal offshore environment have sedimentary structures formed under quiescent depositional conditions typically found below the fair weather wave base [26] such as lamination and current ripples [27] ). The distal offshore environment has trace fossils attributed to distal expression of the Cruziana ichnofacies [25] . The observed sedimentary structures recorded in the logged Montney Formation cores includes current ripples, deformation structures, convolute lamination/bedding, etc. The sedi- ment deformation structures, convolute lamination/bedding formed due to mechanical forces causing plasticity, commonly related to gravity acting upon weak sediments usually silt or sands, prior to or soon after, or at deposition along the sediment surface [28] [29] ; and escape traces (Fugichnia?), which are evidence of small scale episodic deposition due to local transport from the lower shoreface or proximal offshore to distal setting.
This paper concerns itself with: 1) evaluation of the Montney Formation source-rock richness; 2) thermal maturity and hydrocarbon generation in the Montney Formation; and 3) geographical distribution of Rock-Eval (TOC and Tmax) parameters in the study area.
2. Geological Setting
The paleogeographic location of the Western Canada Sedimentary Basin (WCSB) during the Triassic time was situated at approximately 30˚N paleolatitude based on analyses of paleomagnetic data, paleolatitude and paleoclimatic zonation [30] , and fauna record [31] . The paleoclimate reconstruction suggests that the paleoclimate may have ranged from sub-tropical to temperate [30] [31] [32] . The region has been interpreted to be arid during the Triassic, and was dominated by winds from the west [30] [33] [34] .
The WCSB forms a northeasterly tapering wedge of sedimentary rocks with thickness of more than 6000 meters, which extends southwest from the Canadian Shield into the Cordilleran foreland thrust belt [32] [35] . The Cordilleran of the WCSB provides the evidence that the origin and development of the basin was associated with tectonic activity [32] [36] . Later epeirogenic episodes resulted in subsidence that created the basin for sediment accumulation, which were attributed to the effects of contemporaneous episodes of orogenic deformation in the Cordillera [35] [37] . This is interpreted to be post Triassic, especially due to mountain influences [32] . [38] [39] [40] interpreted sediment loading, evidenced by the deformed bed, slump structures and small-scale faults as indicators of tectonic influences on the deposition of Triassic successions. Within the Foothills and Rocky Mountain Front Ranges, Triassic rocks were subjected to Jurassic - Cretaceous Columbian and Upper Cretaceous - Lower Tertiary Laramide orogenies, which caused a series of imbricate thrust faults and folds in the region [41] .
In Alberta and British Columbia, Triassic sediments were deposited in a central sub-basin known as the Peace River Embayment, which extended eastward from the Panthalassa western ocean onto the North American craton [41] . During the Triassic period, the Peace River Embayment was a low mini basin associated with minor fault block movement associated with a broad downwarp resulted in the rejuvenation of structural deformation within the Monias areas of southwest Fort St. John, British Columbia [41] .
Stratigraphically (Figure 2), the Triassic Montney Formation is Griesbachian to Spathian in age [42] . The Triassic succession thickened westward [41] , and rests unconformably in most areas, upon the Belloy Formation in outcrop of northeastern British Columbia; Carboniferous in parts of northeastern British Columbia and Alberta; and Fantasque in outcrop at Williston [42] . The thickness of Triassic deposits is about 1200 meters in the western-most outcrop in the Rocky Mountain Foothills [43] . The Montney Formation structure map (Figure 3) indicates higher paleostructure in the east and low in the western portion of the study area. This structural tilt shows a depositional thinning to the east and north due to erosional removal [2] [24] [41] .
3. Method of Study
Drilled cores of the Montney Formation from the study area in Fort St. John vicinity, northeastern British Columbia were logged to assess sedimentological, ichnological and facies characteristics. The lithologic features and accessories, sedimentary texture, sedimentary structure, the nature of bedding contacts, and lithofacies were compiled in detail (Figure 4 and Figure 5).
Samples were crushed into powder using the pulverized shatter-box machine at the University of Alberta’s rock-crushing lab. Samples were sent to Geological Survey of Canada and Chesapeake Energy Corporation, Oklahoma City, USA, for Rock-Eval analyses (Table 1). Additional Rock-Eval data (Table 2) included in this paper comes from Oil and Gas Commission, Ministry of Energy, British Columbia, and (Table 3) comes from [13] .
The anhydrous pyrolysis technique used in this study evaluates oil and gas shows, oil and gas generation potential, thermal maturity and identifies organic matter type [1] [11] [44] [45] [46] [47] . The Montney Formation rock samples were pyrolyzed using Rock-Eval 6. [46] described the Rock-Eval technique as an apparatus, which consists of a programmed temperature heating of a small amount of rock sample (100 mg) in an inert atmosphere (Helium or Nitrogen)
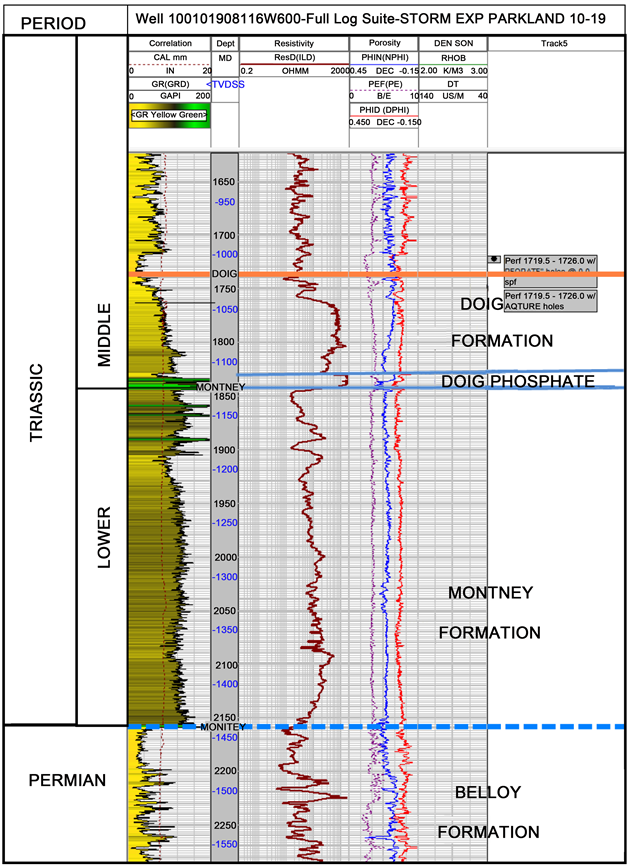
Figure 2. Type log of the Montney Formation in the study area, northeastern British Columbia, Western Canada Sedimentary Basin (WCSB), adapted from [24] .
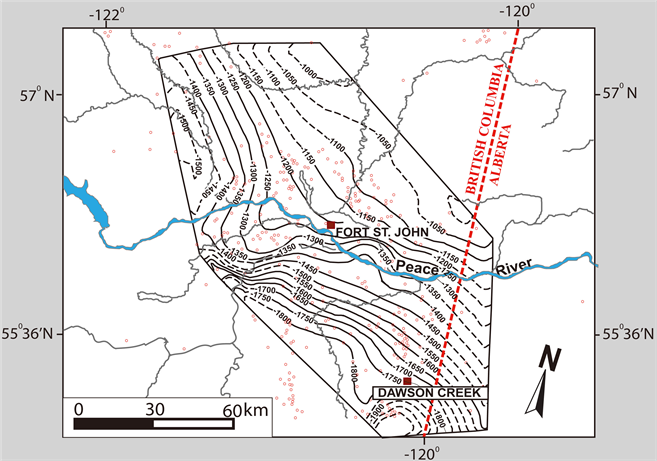
Figure 3. Structure contour map of the Montney Formation in the study area, northeastern British Columbia. Dash contour lines indicate no data point for well control. The structure map decreases in elevation westward, which indicates that sediment source area was from east, and prograded westward [2] .

Table 1. Rock-Eval data from the Montney Formation, Fort St. John study area and environs, northeastern British Columbia, Canada.
Table 2. Rock-Eval data from the Montney Formation (outside of study area), northeastern British Columbia. Data source: B.C Oil and Gas Ministry of Energy, British Columbia.
Table 3. Montney Formation Rock-Eval data [13] .

Figure 4. Montney Formation core description from well 9-29-79-14W6.

Figure 5. Shows lithofacies of the Montney Formation (a) Plane lamination; (b) fractured siltstone along bedding plane; (c) silty-sandstone with current ripple sedimentary structure; (d) shows sediment deformation structure; (e) bioturbation by Phycosyphon?; (f) interbedded silty-sandstone.
to determine the amount of free hydrocarbons present in a sample (usually denoted by the S1 peak). The amount of hydrocarbons and oxygen containing compounds (CO2) that are produced during the thermal cracking of the insoluble organic matter (kerogen) in the rock is represented by the S2 peak, which indicates the oil not yet released from the rock by natural processes and represents the residual petroleum potential (Figure 6).
Rock-Eval pyrolysis is a standard analytical method used to determine petroleum generating potential and the thermal maturity of the kerogen occurring in a rock [5] [47] . The procedure consists of progressive heating the whole-rock from initial temperature of 25˚C by using the Rock-Eval 6 analyzer to measure the hydrocarbons released during the increased artificial thermal heating to 650˚C [46] as shown in Figure 6. The key parameters from Rock-Eval
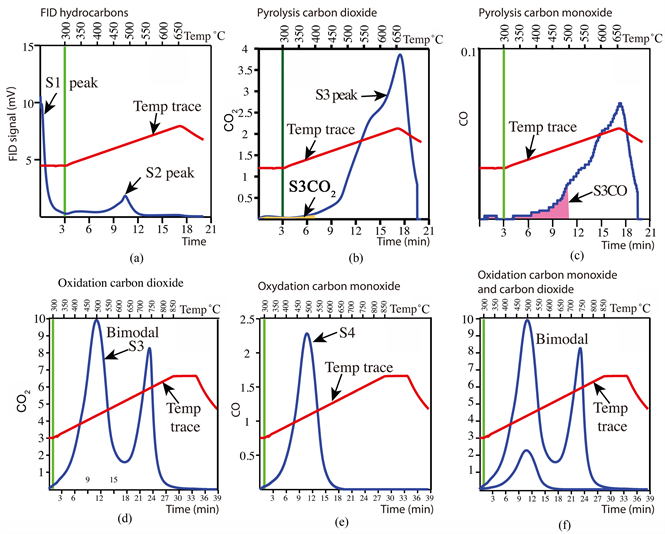
Figure 6. Rock-Eval pyrolysis for Montney Formation sample (well 2-19-79-14W6, depth: 2085 m). (a) illustrates the effect of pyrolysis temperature with Rock-Eval. The S1 peak is the free hydrocarbon liberated during thermal decomposition at less than 300˚C. The S2 peak is derived from the conversion of total organic matter to kerogen during pyrolysis (pyrolyzed fraction). The S2 corresponds to the maximum temperature (Tmax); (b) shows the S3 peak (CO2) corresponding to 400˚C, which represents the oxidation of CO2. It also shows the difference in organic matter; (c) illustrates the pyrolysis carbon monoxide (CO); (d) shows the oxygen indices. The determination of oxygen index (OI) is based on using CO2 and CO; the CO = S3CO × 100/TOC Total oxygen index (OI) = CO2 + OI (CO); (e) shows the S4 peak, the oxidation carbon monoxide (CO); the peak shows the present of siderite mineral (400˚C - 600˚C); (f) Oxidation of CO and CO2. The red line is the temperature trace in 25 minutes from 300˚C to 650˚C. Distinctly bi-modal curve is due to pyrobitumen.
analyses are: 1) the total organic carbon (TOC); 2) Tmax; 3) Hydrogen Index (HI); 4) Oxygen Index (OI); 5) Production Index (PI); and 6) S2 peak.
4. Results
4.1. Rock-Eval Geochemistry
Rock-Eval was originally designed for measuring the maturity of coal mackerel [5] [48] . It is a useful screening technique for recognizing source rock and kerogen quality, and has become a major oil and gas exploration tool that give insights to the exploration geologist in terms of source rock characteristics, and reservoir potential. The key parameters of Rock-Eval (TOC, Tmax, HI, OI, PI and S2 values) are fundamental to determining source rock richness, kerogen type, and maturation, which altogether form critical elements in the assessment of a petroleum system, risks segments and high grading resource plays.
4.2. Description: Montney Formation Total Organic Carbon (TOC)
The TOC content of a rock is determined by oxidation under air, in an oven from the organic carbon residue after pyrolysis [46] . The measured TOC values for the Montney Formation are shown in Tables 1-3. The geographical distribution of average TOC per well is shown in the study area in Figure 7. The general trend of TOC is low in the western part of study area, and TOC value increases eastwards into Alberta Province (Figure 7). TOC in the Montney Formation is variably and statistically grouped into low TOC (<1.5 wt%), medium TOC (1.5 - 3.5wt%), and high TOC (>3.5 wt%).
4.3. Interpretation
TOC is an indicator of the total amount of organic matter present in the sedi-
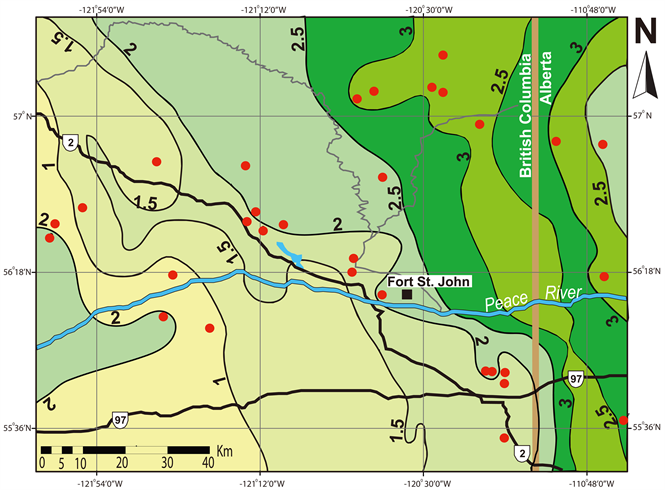
Figure 7. The Montney Formation average TOC (wt%) map within the study area, northeastern British Columbia and northwestern Alberta. The red dots represent wells with Rock-Eval data.
ment [49] . The standard criteria for ranking source-rock richness (Table 4) was proposed by [50] . The hydrocarbon generating potential is commonly interpreted using a semi quantitative scale (Table 3) according to [51] [52] . The Montney Formation TOC richness and distribution within the study area may be related to factors such as: 1) depositional condition of organic matter, its concentration and preservation, including oxygen content of the water column and sediment type, i.e. oxic versus anoxic as proposed by [50] [53] [54] ; 2) biological productivity influence and availability of nutrient and replenishment [50] [54] ), controlled by sunlight, temperature, pH and Eh of waters [52] . Within the study area, the depositional environment interpreted for the Montney Formation is generally an offshore setting (inner shelf-proximal offshore to distal environment). The environment of deposition affects organic matter productivity and preservation [50] [53] [55] .
Organic matter is preserved in oxygen-restricted environment at depths below wave base in waters where density or temperature stratified water columns form, or in locations where oxygen replenishment is low [53] [62] .
It is hypothesize herein that the TOC distribution in the study area (Figure 7) may be related to depositional environment’s proximity to organic matter source and preservation conditions. Where TOC values are greater than 2.4 wt% around Fort St. John (in a NW-SE transverse trending contour value 2) and
Table 4. Criteria for ranking source rock and richness [50] .
Table 5. Hydrocarbon generation and maturity measurement using vitrinite reflectance [51] [56] .
east of that contour boundary (Figure 7), TOC values increases eastwards into Alberta where [13] have reported TOC for the Montney Formation >4 wt% (Table 3). TOC data from well 16-17-83-25W6, provided by Oil and Gas Commission, Ministry of Energy, British Columbia, which is located outside of this study area also shows TOC upto 8.2wt% in Montney Formation (Table 2). In the western portion of study area (west of the boundary contour value 2 in Figure 7), the TOC values are generally lower. In the eastern portion where there is higher TOC value, the area lies within the region that has been interpreted as outer shelf depositional setting. Relatively higher TOC value in this geographical region (eastwards) is probably due to increase oxidation, while reducing condition may have dominated the western portion in the study area where TOC is low in a distal/deep basinal setting. Several workers [11] [50] [53] [54] [55] [57] have reported that high TOC content or richness in sediments are related to the depositional environment, transport of organic matter and preservation. The abundant supply of nutrient and upwelling condition may have dominated the region with higher TOC values in the NE-SE portion of the study area (Figure 7).
Determination of the original total organic carbon (TOC) of a source rock provides a quantitative means to estimate the total volume of hydrocarbons that it can generate depending on kerogen type [58] . However, it is common practice to rate carbonate rocks with lower TOC comparable with richer clastic rock [48] . Extractable Hydrocarbon yields from leaner carbonate rocks are comparable to richer clastic rocks [45] [59] . The organic matter associated with carbonate rocks are often more hydrogen-rich and thermally labile than that in fine-grained clastic rocks [1] [44] [47] . The Montney Formation is partly dolomitic and has variable TOC contents ranging from poor to excellent using the standard TOC richness metrics (Table 4). The low TOC content in Montney Formation in the study area may be related to the mixed siliciclastic-dolomite composition.
4.4. Description: Montney Formation Hydrogen Index and Oxygen Index
The Oxygen Index (OI) measure in mgCO2/gTOC is calculated from the amount of CO2 released and trapped at temperature ranging from 300˚C to 390˚C (Figure 6) during pyrolysis [46] . The Oxygen Index corresponds to the quantity of carbon dioxide from S3 peak (Figure 6) relative to the TOC (mgCO2/gTOC); while Hydrogen Index (HI) corresponds to the quantity of pyrolyzable organic compounds or “hydrocarbons” (HC) from S2 peak relative to the total organic carbon (TOC) according to [11] . The hydrogen index (HI) was calculated from the ratio of S2/TOC using the method of [47] .
In the Montney Formation samples analyzed in this study, which shows that the HI is statistically distributed into three categories in the order of highest percentile: low HI values (0 - 150); medium values (150 - 300); and high values (300 - 900). Of these categories, ~88% of the values are within the low HI values, while about 10% falls into the category of medium values; 2% are of the high values bracket. The OI values are very low (Figure 8), mostly less than 160 and a couple of data point have exceptionally high HI and OI, which maybe outlier (Figure 8).
4.5. Interpretation of Hydrogen Index (HI) and Oxygen Index (OI)
The Hydrogen (HI) and Oxygen (OI) indices are used to determine the type of kerogen (Table 5) present in a source-rock [11] [46] [47] [85] . Based on the data plot of HI and TOC on the pseudo Van Kravelen diagram, it shows that the Montney Formation in the study area is primarily a Type III/IV kerogen with some mixed Type II/III kerogen (Figure 8-10, Table 6). For organic matter to generate hydrocarbons, the carbon has to be associated with hydrogen [12] ). [1] [45] [48] define kerogen as a polymeric organic material from which hydrocar- bons are produced with increasing burial and temperature. Kerogen is composed of the remains of algae, spores, pollen, and vegetative tissues and they are the same groups of maceral found in coals: liptinite,vitrinite, and inertinite [11] [45] [48] [50] [55] .
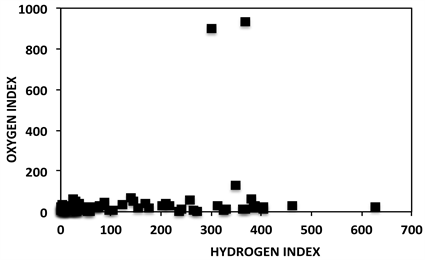
Figure 8. Shows a plot of Oxygen Index (OI) vs. Hydrogen Index (HI). The low OI and HI indicate that the Montney Formation in the study area is primarily a Type III/IV kerogen, with a mixed Type II/III kerogen.
Table 6. Interpretation of Hydrogen Index (HI) and Oxygen Index (OI) Values to determine Kerogen types [11] [12] .
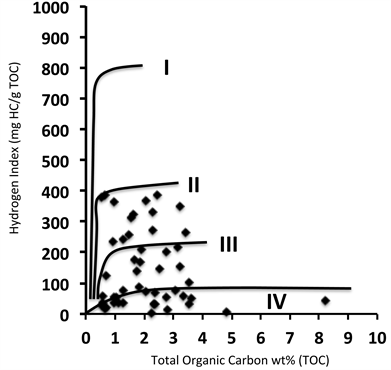
Figure 9. Pseudo Van Krevelen diagram showing kerogen types and TOC richness in the Montney Formation.

Figure 10. Shows the remaining hydrocarbon generating capacity (S2 peak) in the Montney Formation.
Kerogen is mainly classified into three types: Type I, Type II, Type III, [1] [45] and Type IV [53] . Kerogen types are defined on the basis of hydrogen/carbon (H/C) and oxygen/carbon (O/C) values, i.e., Hydrogen Index (HI) and Oxygen Index (OI) according to [54] [60] [61] . The use of Van Krevelen diagram was extended by [45] from coals to include kerogen dispersed in sedimentary rocks.
4.6. Type II Kerogen
The analyzed Montney Formation sediments in the study area show that Type II kerogen is present in the Montney Formation (Figure 9). Type II kerogen is oil prone [11] , relatively rich in hydrogen and characterized by its pure (monomaceral) form of exinite [54] . Examples of materials from which Type II kerogen are derived are spores and pollen grains of land plants, marine phytoplankton cysts, some leaf and stem cuticles [48] [54] . The occurrence of Type II kerogen depends on high biological productivity due to nutrient supply, low mineralogical dilution, and restricted oxygenation [54] .
4.7. Type III Kerogen
Type III kerogen is present in Montney Formation sediments in the study area (Figure 9) Using the S2 values (remaining hydrocarbon generating potential) versus TOC, the ratio of Type III kerogen to Type IV kerogen is approximately 3:1 (Figure 11). [11] described Type III kerogen as primarily a gas prone kerogen, which contains dominantly vitrinite, and it is identical to macerel of humic coal [48] ) formed from land plant, or largely woody and cellulosic debris [48] . However, various macerel mixtures or degradational processes can contribute to the Type III kerogen formation [54] . Type III kerogen is the most reliable kerogen to estimate in terms of the degree of maturation using Tmax [47] .
4.8. Type IV Kerogen
Analyzed data in this study shows that Type IV kerogen constitutes the highest percentile in the Montney Formation. [48] [50] [53] [54] defined Type IV kerogen as inertinite (gas prone), composed of hydrogen poor (HI ≤ 50) constituent, difficult to distinguish from Type III kerogen by using only Rock-Eval pyrolysis [54] . A graphical plot of S2 versus TOC with pseudo HI indicates that Type IV kerogen constitutes about 80% of the kerogen based on Rock-Eval dataset (Figure 11, Figure 12 and Tables 1-3). Type IV kerogen is formed from materials of various origin, and has undergone extensive oxidation, or may in some cases represent detrital organic matter oxidized directly by thermal maturation, sedimentological recycling of materials [54] , or organic facies that has been reworked from a previous depositional cycle [48] [50] [53] [54] .
4.9. Thermal Maturity
Thermal maturity of organic rich sediment is the resultant effect of temperature driven reactions dependent upon time duration that convert sedimentary or-

Figure 11. Shows S2 peak (remaining hydrocarbon generating capacity) for the Montney Formation, which corresponds to the Tmax. The S1 peak is the liberated hydrocarbon during rapid artificial thermal cracking of kerogen during pyrolysis (see Figure 10). Sample location: well 2-19-79-14W6 (depth: 2085 m).
ganic matter (source-rock) to oil, wet gas, and finally to dry gas and pyrobitumen [50] . Thermal maturity is conventionally classified into three categories: 1) immature; 2) mature; and 3) post-mature sources rocks [48] [50] . Knowing a rock’s remaining source-rock capacity solves only one part of the source rock evaluation puzzle; it is also necessary to know what level of thermal maturity is represented by the source rock [12] . Maturity can be estimated by several techniques [11] [45] [46] [47] [48] . In this study, Tmax and vitrinite reflectance (Ro) measurements were used in the determination of thermal maturity of Montney Formation in the study area. The key to using maturity parameters effectively lies in evaluating the measured data carefully (and sometimes with skepticism), and whenever possible, it is better to obtain more than one maturity parameter [48] . Thus, Tmax, vitrinite reflectance (Ro) and Production index (PI) were interpreted separately in this study, and then, a comparison between the three maturity parameters were synchronized to verify similarity or dichotomy between the three data.
The amount and composition of hydrocarbons generated from a particular kerogen vary progressively with increasing maturity [55] . Thermal maturity of kerogen is commonly measured using Tmax and virtinite reflectance [3] [12] [63] [64] , however, there are other parameters that are used as indicators of thermal maturity [48] [51] . Tmax and transformation ratio for organic matter (OM) Type 1, II and Type III/IV, shows that the maximum paleotemperatures and vitrinite reflectance indicates the level of kerogen maturity [45] .
4.10. Description: The Montney Formation Thermal Maturity―Tmax
Tmax is defined as the maximum pyrolysis temperature at which the maximum amount of hydrocarbon is released by kerogen [5] . It is the maximum S2 peak in Rock-Eval pyrolysis (Figure 10 and Figure 11), the point at which the abundance of artificially generated hydrocarbons are at the greatest as a result of ramping up of temperature upto 550˚C [46] . The macromolecular kerogen network is cracked during pyrolysis to give an estimate of the thermal maturity of a source rock [3] [5] [65] .
Tmax values in analyzed core samples from the Montney Formation in the study area range from Tmax 347 to Tmax 526 (Tables 1-3). The average Tmax values range from Tmax 423 to Tmax 567 from each well and were plotted as Tmax contour map to show the geographical distribution of thermal maturity within the study area in Fort St. John, northeastern British Columbia. Statistical distribution of the analyzed Tmax values for the Montney Formation in the study area shows that >90% of the reported Tmax values are within Tmax 450 and Tmax 528.
4.11. Interpretation of Tmax
The interpretation of thermal maturity using Tmax criteria of [51] indicates that more than 90% of the Montney Formation samples reported in this study are thermally matured (Figure 12 and Figure 13). The geographical distribution of
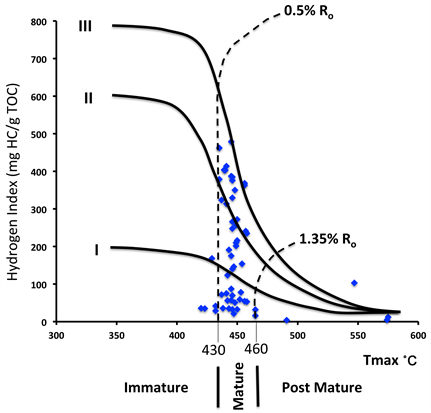
Figure 12. Thermal maturity of the Montney Formation determined with Tmax and vitrinite reflectance (Ro). The dotted line (Ro) is vitrinite reflectance calibrated with Tmax. This shows that the Montney Formation in northeastern British Columbia is extensively matured [24] .
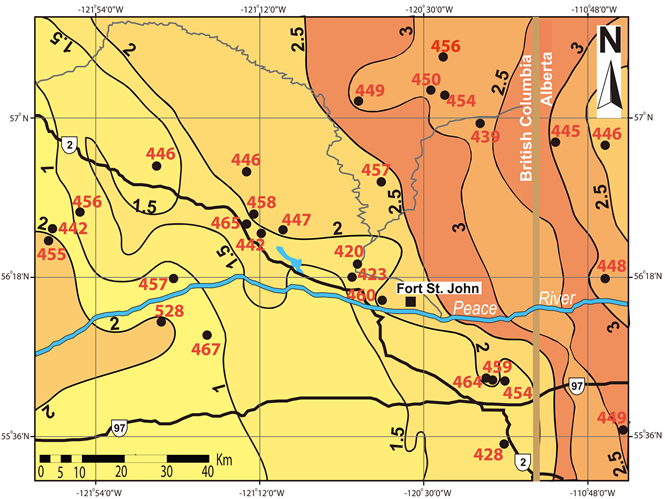
Figure 13. The Montney Formation average Tmax (˚C) map. Tmax values are posted over TOC map to show geographical distribution of source rock quality (TOC), and thermal maturity of source rock. The red dots represent wells with Rock-Eval data. Evidently, the Montney Formation kerogen is thermally matured, and it is within the “peak gas” generation window in the study area, northeastern British Columbia, and northwestern Alberta as shown by the average Tmax values.
Tmax values in the study area prompted a consideration of what might be the controlling factors on thermal maturity and the relationships with geothermal gradient in the study area (Figure 13). The understanding of the geothermal regime in sedimentary basin is important for the studies of the evolution of a sedimentary basin as well as accumulation of hydrocarbons and other energy resources [66] . The generation of hydrocarbons (oil and gas) from any basin is dependent on the temperature reached by the organic-rich source rocks during their burial history [67] . Several workers [68] - [80] have reported heat transfer processes (convection and conduction), observed geothermal pattern, thermal and hydraulic conductivities, heat generated internally in the crust by the decay of radioactive elements, regional scale distribution of geothermal gradient, hydrogeological effects in establishing geothermal pattern, and statistical distribution of geothermal values in Western Canada Sedimentary Basin. Using geothermal calculations of [67] [72] [73] [74] [75] in Western Canada Sedimentary Basin, a comparison of the distribution of Tmax in the study area shows no particular striking relationship with the distribution of geothermal gradient owing to the small size of the study area. There appears to be no distinct distribution of Tmax values. [75] shows a regional-scale (basin-wide) distribution of the internal geothermal gradient across the entire Western Canada Sedimentary Basin, which shows a NW-SE increase in geothermal gradients. [69] reported a northerly trending increase in heat flow, which was interpreted to be caused by crustal thinning. The controlling mechanisms of heat transfer in the Western Canada Sedimentary Basin are conduction and convection by moving fluids or flow of formation water [75] , and hydrogeological effects [72] - [80] . This interpretation of geothermal distribution provides the underlying factors responsible for Tmax values in the study area. The geothermal gradient provides the answer to thermal maturity differences evident by the Tmax values in the Montney Formation within the study area in northeastern British Columbia (where the Montney Formation is mainly a gas prone reservoir) and in Alberta (the Montney Formation is mostly oil prone). The type of hydrocarbons produced (oil vs. gas) in the two Provinces (British Columbia and Alberta) from the Montney Formation is interpreted herein to be related to geothermal gradient that differentially affected source-rock thermal maturity in British Columbia and Alberta [75] [69] . The differential heating of the Montney Formation Kerogen at different temperatures (higher) in British Columbia than in Alberta (lower) as shown by [69] is responsible for the type of hydrocarbon that have been generated in Montney Formation in British Columbia and in Alberta.
4.12. Description: The Montney Formation Thermal Maturity―Vitrinite Reflectance
The vitrinite data analyzed from the Montney Formation in this study is shown in Table 7. The available organic matter for each samples analyzed varies from 0 - 6 (Table 7). The vitrinite particles available for analysis in the analyzed samples range from 0 - 4. The measurement of vitrinite particles involves recording of the percentage of incident light, usually at a wave length of 546 nm, reflected from vitrinite particles under oil immersion [61] . The none availability (zero values in Table 7) of vitrinite particles, and very low vitrinite particles in the organic matter composition resulted in low level of confidence as shown in Table 7 (using a ranking scale 0 - 9). The level of thermal maturation of Montney Formation kerogen as revealed by vitrinite reflectance (Ro) analysis shows that data values range from (Ro 0.74% to 2.09%). Samples that have no vitrinite particles to measure are designated null (zero values) of vitrinite in Table 7.
4.13. Interpretation of Vitrinite Reflectance (Ro)
Vitrinite is a type of kerogen particle formed from humic gels thought to be derived from the lignincellulose cell walls of higher plants [81] . Vitrinite is a common component of coal, and the reflectance of vitrinite particles was first observed to increase with increasing time and temperature in a predictable manner in coals [82] .
Table 7. Vitrinite reflectance measured from the Montney Formation sediments in British Columbia.
Based on the vitrinite reflectance data from Montney Formation in the study area, the results indicate that vitrinite reflectance (Ro) range from 0.74% - 2.09%, which is interpreted herein as primarily a gas prone kerogen (Figure 14) using standard vitrinite interpretation criteria (Table 5) of [51] . This interpretation has credibility because it corresponds to the same indication of gas window maturity using Tmax interpretive standard of [51] as shown in Figure 12. However, it is common, or not unusual to encounter low availability of vitrinite particles during laboratory analysis as seen in some of the samples shown in Table 7.
The low, or none availability of vitrinite particles can result to difficulty in differentiation of primary vitrinite coupled with insufficient grains to make a reliable determination of the reflectance of the samples constitute factors that affect the quality of vitrinite reflectance [64] . Similarly, inconsistencies or error can result from the measurements of vitrinite reflectance [12] [83] , and variation in chemical composition of vitrinite may lead to invalid comparison of vitrinite gradient [64] . Although the aforementioned analytical mechanics makes vitrinite reflectance results to be viewed with skepticism [48] , the method remains useful and conventionally implored in thermal maturity determination [63] .
Vitrinite reflectance in source-rock kerogen is related to the hydrocarbon generation history of sediments [64] . Vitrinite reflectance has been successfully used to demonstrate the reliability of the technique as indicator of organic maturation in source-rock, indicating potential areas of oil and gas generation

Figure 14. Total Organic carbon (TOC) vs. vitrinite reflectance (Ro) showing the thermal maturity of Montney Formation source-rock, and hydrocarbon generating phases in the Montney Formation sediments from study area, northeastern British Columbia [24] .
within a prospect [50] . Vitrinite reflectance (Ro) is one of the methods used in evaluation of thermal transformation of organic-rich sedimentary rocks [63] in hydrocarbon exploration [1] [45] [48] [57] . Vitrinite increases during thermal maturation due to complex, irreversible aromatization reactions [50] . It has been established that vitrinite reflectance correlates well with coal rank, which is primarily a function of time and temperature [60] .
The thermal transformation of vitrinite can be related to geothermal and paleotemperature [64] , which proceeds by a series of irreversible chemical reactions that cause organic matter alteration due to thermal cracking [63] [84] . Thus, vitrinite reflectance is used as thermal maturation indicator that provides a means of determining the maximum temperature exposure of sedimentary rocks [63] [84] .
4.14. Description: Thermal Maturity―Production Index (PI)
The production index (PI) data in Montney Formation from the Rock-Eval analysis shows that PI has very low values (range from 0.11 to 2.6). More than 90% of PI values from the study area are less than 1. The relationship between production index (PI) and Tmax is shown in Figure 15.
4.15. Interpretation of Production Index (PI)
The production index (PI) is also a parameter that is used in conjunction with other thermal maturity parameters to indicate type of hydrocarbon generated [50] , and was interpreted based on the geochemical parameters describing thermal maturation (Table 8). The PI values in this study indicate that the Montney Formation sediment is mostly matured and post matured (Table 8 and Figure 15).
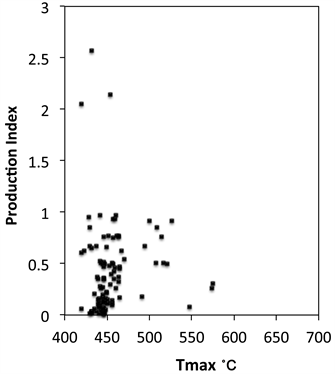
Figure 15. Shows that the Montney Formation kerogen is thermally matured, and extensively composed of gas.
Table 8. Geochemical parameters describing the level of thermal maturation [50] .
5. Reservoir Characterization of the Montney Formation
5.1. Porosity Data-Description
Approximately thirty data point from the Montney Formation samples were analyzed for porosity (porosity of bulk volume and gas filled porosity) in relation to depth (Figure 16). The data show a side-by-side porosity value that nearly mimic bulk volume porosity and gas filled porosity (Figure 16). The highest value of porosity (Table 9) from well 16-17-82-25W6 is 5.67% and lowest value is 1.22%. Some cores of the Montney Formation have porosity greater than 5.6% (Figure 17). Visual observation of porosity from thin-section petrographic analysis revealed vuggy porosity (Figure 18).
Table 9. Petrophysical characterization of the Montney Formation in well 16-17-82-25W6 (Data source: B.C Oil and Gas Commission).

Figure 16. Shows porosity and gas filled porosity of the Montney Formation (well 16-17-82-25W6). The graph shows very excellent correlation between porosity and gas filled porosity. (Data source: B.C. Oil and Gas Commission).
5.2. Interpretation of Porosity
Porosity is dependent on grain texture, which is determined largely by grain shape, roundness, grain size, sorting, grain orientation, packing, and chemical composition (cement precipitation and diagenetic modification). Distribution of pore structure, or pore-throat controls the porosity in tight rock matrix. The low values of measured porosity as observed in thin-section petrography are evidence of a combination of textural heterogeneity, mineral alteration, and transformation produced by diagenesis in the Montney Formation.
The petrographic analysis shows evidence of uniformity of grain size, and sorting of the Montney Formation sediments, which is dominantly siltstone with matrix of clay admixed very fine-grained sandstone and dolomite, precludes the effective inter-particle (inter-void communication), thus, average porosity is
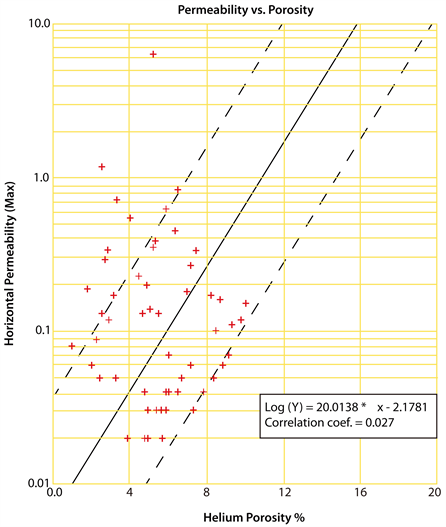
Figure 17. Porosity vs. permeability crossplot for the Montney Formation, well: 2-19-79-14W6 (depth 2037.40 - 2091.90 m). Data source: B.C. Oil and Gas Commission.
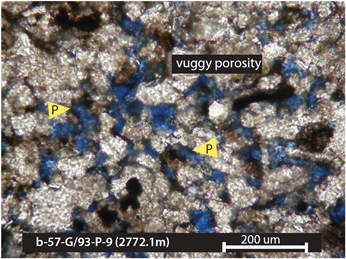
Figure 18. Microphotograph showing dolomitic siltstone facies and the associated vuggy porosity resulting from dissolution of material. Yellow arrow labeled “P” is pointing to vuggy porosity.
considerably low as evident by the measured porosity values (Table 9). Observed vuggy porosity in some interval in the Montney Formation is associated with biogenic modification of textural fabric (Figure 18). The observed porosity in thin-section is partly associated with organic matter dissolution and replacement by pyrite, and biogenically produced secondary porosity. Also, relatively higher porosity in the Montney Formation is associated with bedding plane fractures. Bedding plane porosity observed in the Montney Formation results from varieties of concentrated parallel lamination to bedding planes. The larger geometry of many petroleum reservoirs are controlled by such bedding planes primarily formed by the differences of sediments calibre or particle sizes and arrangements influenced by the depositional environment [85] .
5.3. Permeability Data Description
Measured pressured decay permeability from cores (Figure 19) shows very low permeability values that range from 0.000337 to 0.000110 mD. The statistical

Figure 19. Graph showing permeability vs. depth of the Montney Formation from well 16-17-82-25W6, northeastern British Columbia (Data source: B.C. Oil and Gas Commission).
vertical distribution of permeability values plotted in relation to depth show a cyclic pattern in variation (Figure 19).
5.4. Interpretation Permeability
Apart from the porosity of a reservoir, the ability of the rock to allow the flow of fluid through the interconnected pores, which is permeability (kv = kh), is a crucial reservoir parameter in the evaluation of any oil and gas play. The permeability of a rock depends on its effective porosity; which is controlled by grain size distribution, degree of sorting, grain shape, packing, and degree of cementation [84] [86] . The evaluation of permeability of heterogeneous clastic rocks from core or downhole is one of the most important goals of reservoir geoscience [87] .
The results from permeability analyses in this study are related to the overall textural heterogeneity, porosity, and in part, related to ichnofabric modification. The Montney Formation is composed of dolomitic, silt-size grains and subordinate very fine-grained sandstone. The implication of grains-size in-terms of permeability is in relation to the fact that smaller grain-sizes have smaller permeabilities than those with larger grain-sizes because smaller grain-sizes will produce smaller pores and smaller pore throats, which can constrain the fluid flow in a manner lower than flows in larger grains, which produce larger pore throats [86] . Furthermore, the smaller the grain-size, the larger the exposed surface area to the flowing fluid, which leads to larger friction between the fluid and the rock, and hence lower permeability [86] ). [88] have shown that there is strong correlation between permeability and grain-size of unconsolidated sands and gravels, with permeability increasing exponentially with increasing grain-size [88] .
Intervals were bedding plane fractures and ichnofabric modification occur shows relatively higher values in permeability. The observed porosity in thin-section (micron scale), shows that the porosity is associated with: 1) dissolution of organic matter or dolomitic material caused by diagenesis; 2) bioturbation-en- hanced porosity resulting from burrows by organisms; and 3) fracture porosity along bedding planes. [89] [90] have shown that reservoir enhancement in unconventional thinly bedded, silty to muddy lithologies of unconventional reservoir with low permeability can be enhanced by the activity of burrows.
5.5. Fluid Saturation-Data Description
Data analyzed for fluid saturation (gas saturation, mobile oil saturation, water saturation, and bound hydrocarbon saturation) indicates that water saturation is the second highest fluid, next to gas saturation; while, mobile oil saturation and bound hydrocarbon saturation (Figure 20) are negligible in comparison with gas saturation (Table 9) or water saturation. By far, gas saturation is very high throughout the interval of measurement, yielding as high as 99.56% at the depth of 2330.42m and the lowest value of gas saturation is 70.25% at the depth of 2415.82m (Figure 20, Table 9).
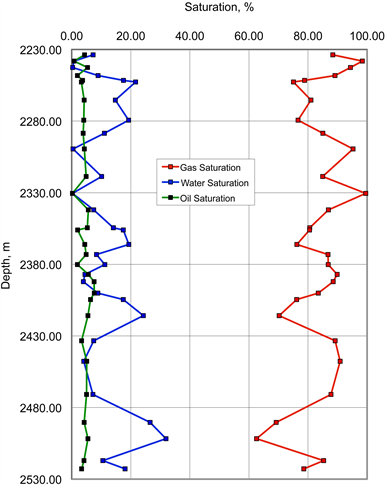
Figure 20. Illustrates fluid saturation (gas, oil, and water) of the Montney Formation from well 16-17-82-25W6, northeastern British Columbia (Data source: B.C. Oil and Gas Commission).
5.6. Interpretation of Saturation
The amount of fluid in pore volume of a rock occupied by formation fluid (oil, gas, and water) refers to fluid saturation [91] . Results from this study shows that gas saturation is the most dominant fluid in the interstitial pores of the Montney Formation (Figure 20) varying from 99.64% to 62.59% through the depth profile. The oil saturation shows a near consistency graph level, particularly indicating a very low (0.81% to 7.64%) oil saturation through the depth profile. The implication of high gas saturation confirms that the Montney Formation in northeastern British Columbia is mainly a gas reservoir. Water saturation varies significantly in an inversely proportional correlative pattern with gas saturation. The relationship of water saturation with gas saturation is interpreted in relation to the proportion of the ratio of gas to water in the pore volume. The relative low water saturation is crucial because water in pore space of low-per-meability occupies critical pore-throat volume and can greatly diminish hydrocarbon permeability, even in rocks at irreducible water saturation [92] . Because of small pore-throat size, low-permeability, gas-producing sandstones are typically characterized by high water saturation and high capillary pressure [93] [94] .
6. Discussions
6.1. Source-Rock Quality
For source-rock to have economic potential or exploration prospect, sufficient organic matter (OM) must have generated hydrocarbons. The measure of the quality of source-rock is the total organic carbon (TOC) content, and the guidelines for ranking source rock quality were proposed by [11] : 1) poor TOC richness range from 0.00 - 0.50 wt% in shale; while in carbonates TOC range from 0.00 - 0.12 wt%; 2) fair TOC range from 0.50 - 1.00 wt% in shale; while in carbonates TOC range from 0.25 - 0.50 wt%; 3) good TOC range from 1.00 - 2.00 wt% in shale; while in carbonates TOC range from 0.25 - 0.50; 4) very good TOC range from 2.00 - 4.00 wt% in shale; while in carbonates TOC range from 0.5 - 1.00 wt%; and 5) excellent TOC starts at values >4.00 wt% in shale; while in carbonates TOC must be >1.00 wt%.
Using the premise above as proposed by [11] , the Montney Formation in the study area, has TOC content that is variably and statistically distributed in the order of highest percentile into low TOC (<1.5 wt%), medium (1.5 - 3.5 wt%), and high (>3.5 wt%). Based on these results, the Montney Formation in the study area has good total organic carbon (TOC) richness (Figure 21). In addition to the TOC content, The Montney Formation Kerogen has been interpreted and classified into: 1) Type III kerogen, which is primarily a gas prone kerogen [11] [12] [48] ; 2) Type IV kerogen, which is inertinite (gas prone), composed of hydrogen poor constituent, difficult to distinguish from Type III kerogen by using only Rock-Eval pyrolysis; and 3) mixed Type II/III kerogen, which is oil prone [11] [46] [48] relatively rich in hydrogen and characterized by materials such as spores and pollen grains of land plants, marine phytoplankton cysts, some leaf and stem cuticles [48] [54] .
6.2. Thermal Maturity
The Montney Formation exhibits different thermal maturities (immature, mature, and post-mature). However, statistical distribution of the Tmax values in the Montney Formation within the study area shows that >95% of the reported Tmax values are within 430 and 528 Tmax, which is within gas window [51] . Some of the sediments are thermally matured (Figure 12). Likewise, the vitrinite reflectance (Ro) results in this study shows that the Montney Formation in the study area is thermally matured, and it is composed mainly of gas with some oil (Figure 14). A comparison of the Tmax data, vitrinite reflectance data, and production index (PI), which show strong correlation in terms of using multiple maturity parameters as argued by [48] as a better method of assessing the accuracy of thermal maturity index. Tmax, Ro and PI (Figure 12, Figure 14 and Figure 15) produced the same thermal maturity, thus, the data boost the credibility of the thermal maturity synthesized and reported for the Montney Formation herein.
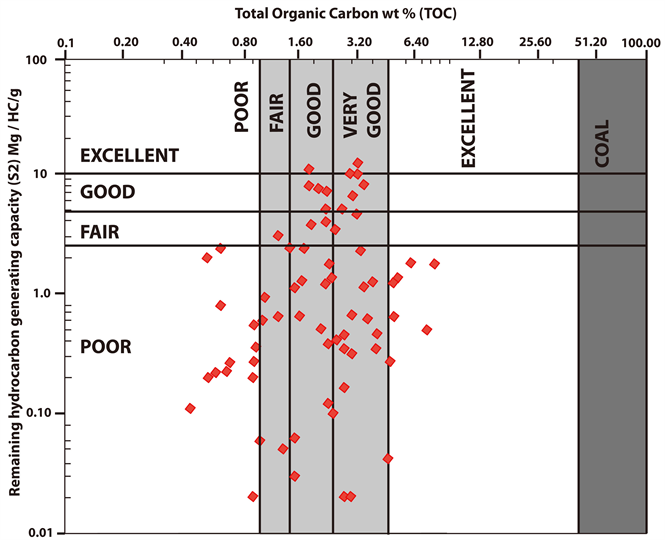
Figure 21. A cross plot showing total organic carbon (TOC wt%) values and S2 values (the amount of hydrocarbon formed during thermal decomposition of kerogen). The higher S2 values indicate greater hydrocarbon generating potential. In general, the S2 and TOC values show that the Montney Formation in the study area, northeastern British Columbia has good source rock quality. However, some of the data points also indicates poor to fair.
7. Conclusions
Source-rock geochemistry evaluation is a pivotal step in the assessment of hydrocarbon reservoir. The Montney Formation source-rock characteristics presented in this study shows that TOC is statistically distributed into low (<1.5 wt%), medium (1.5 - 3.5 wt%), and high (>3.5 wt%). The analysis and interpretation in this study shows that the Montney Formation in the study area is rich in TOC, and thermally matured. The type of hydrocarbon associated with the Montney Formation is mainly thermogenic gas, derived from kerogens of Type III/IV and mixed Type II/III kerogen. Thermal maturity Geographical distribution in the study area shows that the kerogen is pervasively matured in the study area.
The prospect and potential of hydrocarbon exploration is driven and dependent upon economics. Primary factors of significant importance used as a yard- nstick for prospect evaluation are: resource estimates (volume), reservoir thickness, porosity, permeability, source-rock characteristics, hydrocarbon type (oil prone, or gas prone, or mixture of both), and logistics. Fundamental properties affecting reservoir quality are rock texture and composition, gas in place (interstitial and adsorbed), organic content and degree of maturation, and pore pressure. Other relevant parameters such as pore fluid saturation, clay type, and clay-bound water, are indirectly reflected by the above. Thus, most prolific gas-bearing units are identified based on measurements of total gas―canister desorption and a combination of adsorption isotherms and Tight Rock Analysis (TRA) to show gas-filled porosity, pore fluid saturations (water, gas, and mobile oil), and clay-bound water.
Reservoir thickness is crucial in prospect evaluation. Isopach map for the Montney Formation in the study area around Fort St. John, northeastern British Columbia shows a maximum thickness of 320 meters along the NW-SE (Figure 22). The lateral extend of this thickness varies from 320 meters in the west, and thin to about 200 meters in the eastern portion of British Columbia along the Alberta boundary border due to erosional removal. With this hectometers
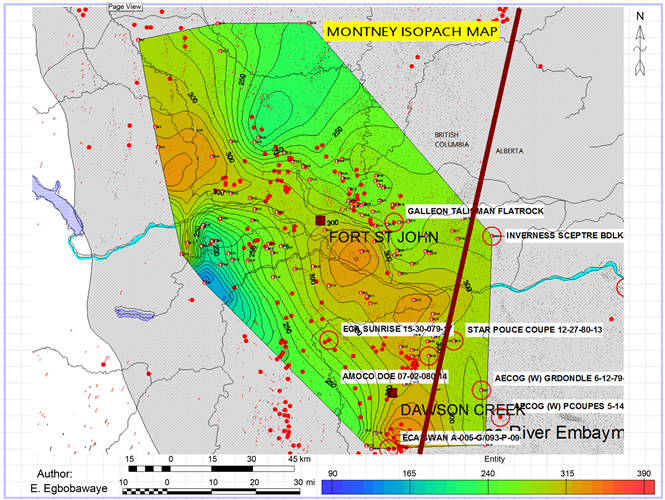
Figure 22. Isopach map of the Montney Formation showing gross thickness in the study area, northeastern British Columbia [24] .
thickness, unconventional resource development method that incorporates hydraulic fracturing and well stimulation will enhance gas production and success in the Montney Formation.
Acknowledgements
My appreciation goes to Prof. Murray Gingras and Prof. J.-P. Zonneveld for their support during this research. Similarly, I’m grateful to Geoscience B.C for awarding scholarship funding in unconventional hydrocarbon reservoir research in British Columbia. The Faculty of Graduate Studies and Research (FGSR) at the University of Alberta is highly appreciated for awarding scholarship and conducive academic environment that enhanced the timely, and successful completion of this research. A big thank you to Mr. Olsen, Core Facility Manager at B.C. Oil and Gas Commission located at Fort St. John for his cooperation during core logging. I'm grateful to B.C. Oil and Gas Commission for granting permission to use the data presented in this publication. My thanks goes to Dr. Andrew Cullen and Doug Bellis for their support that facilitated Chesapeake Energy Corporation to do rock samples analyses used in this paper, and for allowing me to use GeoGraphix mapping software to do all my mapping of the Montney Formation.
Cite this paper
Egbobawaye, E.I. (2017) Petroleum Source-Rock Evaluation and Hydrocarbon Potential in Montney Formation Unconventional Reservoir, Northeastern British Columbia, Canada. Natural Resources, 8, 716-756. https://doi.org/10.4236/nr.2017.811045
References
- 1. Tissot, B.P. and Welte, D.H. (1984) Petroleum Formation and Occurrence. A New Approach to Oil and Gas Exploration, Springer-Verlag, Berlin, 538 p. https://doi.org/10.1007/978-3-642-87813-8
- 2. Egbobawaye, E.I. (2013) Tight Gas Reservoir Characterization in Montney Formation, Northeastern British Columbia, Western Canada. Doctor of Philosophy Thesis, Department of Earth and Atmospheric Sciences, University of Alberta, Edmonton, 431 p.
- 3. Barker, C.E. (1974) Pyrolysis Techniques for Source Rock Evaluation. American Association of Petroleum Geologists Bulletin, 58, 2349-2361.
- 4. Claypool, G.E. and Reed, P.R. (1976) Thermal Analysis Technique for Source Rock Evaluation: Quantitative Estimate of Organic Richness and Effects of Lithologic Variation. American Association of Petroleum Geologists Bulletin, 60, 608-626.
- 5. Espitalié, J., Laporte, J.L. Madec, M., Marquis, F., LePlat, P., Paulet, J. and Boutefeu, A. (1977) Methode rapide de caracterisation des roches meres de leur potentiel petrolier et de leur degre d’evolution. l’Institut Fran?ais du Pétrole, 32, 23-42.
- 6. Espitalié, J., Marquis, F. and Barsony, I. (1984) Geochemical Logging. In: Voorhees, K.J., Ed., Analytical Pyrolysis—Techniques and Applications, Boston, Butterworth, 276-304. https://doi.org/10.1016/B978-0-408-01417-5.50013-5
- 7. Clementz, D.M., Demaison, G.J. and Daly, A.R. (1979) Well Site Geochemistry by Programmed Pyrolysis. Proceedings of the 11th Annual Offshore Technology Conference, Houston, OTC 3410, 1, 465-470. https://doi.org/10.4043/3410-MS
- 8. Larter, S.R. and Douglas, A.G. (1982) Pyrolysis Methods in Organic Geochemistry: An Overview. Journal of Analytical Applied Pyrolysis, 4, 1-19. https://doi.org/10.1016/0165-2370(82)80023-5
- 9. Horsfield, B. (1985) Pyrolysis Studies in Petroleum Exploration. In: Brooks, J. and Welte, D., Eds., Advances in Petroleum Geochemistry, Academic Press, New York, 1, 247-298.
- 10. Peters, K.E. and Simoneit, B.R.T. (1982) Rock-Eval Pyrolysis of Quaternary Sediments from Leg 64, Sites 479 and 480, Gulf of California. Initial Report of the Deep Sea Drilling Project, 64, 925-931. https://doi.org/10.2973/dsdp.proc.64.138.1982
- 11. Peters, K.E. (1986) Guidelines for Evaluating Petroleum Source Rocks Using Programmed Pyrolysis. American Association of Petroleum Geologists Bulletin, 70, 318-329.
- 12. Dembicki Jr., H. (2009) Three Common Source Rock Evaluation Errors Made by Geologists during Prospect or Play Appraisals. American Association of Petroleum Geologists Bulletin, 93, 341-356. https://doi.org/10.1306/10230808076
- 13. Faraj, B., Williams, H., Addison, G., McKinstry, B., Donaleshen, R., Sloan, G., Lee, J., Anderson, T., Leal, R., Anderson, C., Lafleur, C. and Ahlstrom, J. (2002) Shale Potential of Selected Upper Cretaceous, Jurassic, Triassic and Devonian Shale Formations, in the WCSB of Western Canada: Implications for Shale Gas Production. A report for Gas Technology Institute (GTI), Des Plains, Illinois, USA. http://sales.gastechnology.org/020233.html
- 14. Walsh, W., Adams, A., Kerr, B. and Korol, J, (2006) “Regional Shale Gas” Potential of The Triassic Doig and Montney Formations, northeastern British Columbia. Ministry of Energy, Mines and Petroleum Resources, Oil and Gas Division, Resource Development and Geoscience Branch, British Columbia, Petroleum Geology Open File 2006-02, 19 p.
- 15. Berger, Z., Boast, M. and Mushayandebvu, M. (2009) The Contribution of Integrated HRAM Studies to Exploration and Exploitation of Unconventional Plays in North America. Part 2: Basement Structures Control on the Development of the Peace River Arch’s Montney/Doig Resource Plays. Reservoir, 36, 40-44.
- 16. Core Lab (2009) Reservoir Characterization and Production Properties of Gas Shales. American Association of Petroleum Geologists Bulletin, Short Course, 10.
- 17. Zonneveld, J.-P. (2008) Triassic Sedimentary Framework and Sequence Stratigraphy, Wiliston Lake, Canadian Society of Petroleum Geologists, 192.
- 18. Egbobawaye, E.I., Zonneveld, J.-P. and Gingras, M.K. (2010) Tight Gas Reservoir Evaluation in Montney and Lower Doig Formations, Northeastern British Columbia, Western Canada. American Association of Petroleum Geologists Abstract, 19, 66-67.
- 19. Egbobawaye, E.I., Kravchinsky, V.A., Zonneveld, J.-P. and Gingras, M.K. (2011) Magnetostratigraphy Dating and Correlation of the Lower Doig and Upper Montney Formations (Lower Triassic), Northeastern British Columbia, Western Canada. Canadian Society of Petroleum Geologists, CSPG, CSEG, CWLS Convention Abstract, Calgary, Alberta, Canada, 1-5. http://www.searchanddiscovery.com/pdfz/abstracts/pdf/2015/90173cspg/abstracts/ndx_egbob.pdf.html
- 20. Haines, L., Darbonne, N., Barbee, M.A., Williams, P., Clouser, G., Wagman, D., Conly, M. and Grant, J. (2006) Tight Gas. A Supplement to Oil and Gas Investor. Hart Energy Publishing, Houston, Texas, 14 p.
- 21. Schmoker, J.W. (1995) Method for Assessing Continuous-Type (Unconventional) Hydrocarbon Accumulations. In: Gautier, D.L., Dolton, G.L., Takahashi, K.I. and Varnes, K.L., Eds., National assessment of United States Oil and Gas Resources—Results, Methodology, and Supporting Data: U.S. Geological Survey Digital Data Series, 30, CD-ROM.
- 22. Reidiger, C.L., Fowler, M.G., Brooks, P.W. and Snowdon, L.R. (1990) Triassic Oils and Potential Mesozoic Source Rocks, Peace River Arch Area, Western Canada Basin. Organic Geochemistry, 16, 295-305. https://doi.org/10.1016/0146-6380(90)90049-6
- 23. Milelli, S. (2013) New Report Doubles Previous Estimates of Montney Formation Natural Gas Reserves in British Columbia and Alberta. Canadian Energy Perspectives, Development in Energy and Law, 14 November 2013. http://www.canadianenergylawblog.com/2013/11/14/new-report-doubles-previous-estimates-of-montney-formation-natural-gas-reserves-in-british-columbia-and-alberta/
- 24. Egbobawaye, E.I. (2016) Sedimentology and Ichnology of Upper Montney Formation Tight Gas Reservoir, Northeastern British Columbia, Western Cabada Sedimentary Basin. International Journal of Geosciences, 7, 1357-1411. https://doi.org/10.4236/ijg.2016.712099
- 25. MacEachern, J.A., Pemberton, S.G., Bann, K.L. and Gingras, M.K. (2005) Departure from the Archetypal Ichnofacies: Effective Recognition of Physico-Chemical Stresses in the Rock Record. Applied Ichnology, Short Course Note, American Association of Petroleum Geologists Bulletin and SEPM Short Course Note, 52, 66-88.
- 26. Reineck, H.E. and Singh, I.B (1972) Genesis of Laminated Sand and Graded Rhythmites in storm-Sand Layers of Shelf Mud. Sedimentology, 18, 123-128. https://doi.org/10.1111/j.1365-3091.1972.tb00007.x
- 27. Reinson, G.E. (1994) Barrier-Island and Associated Strand-Plain Systems. In: Walker, R.G., Ed., Facies Model, 2nd Edition, Geoscience Canada, Reprinted Series 1, Geological Association of Canada, Geotext 1, 179-194.
- 28. Allen, J.R.L. (1982) Sedimentary Structures: Their Character and Physical Basis. Elsevier, New York, 2, 663.
- 29. Collinson, J., Mounney, J.N. and Thompson, D. (2006) Sedimentary Structures. 3rd Edition. Terra Publishing, England, 292 p. https://www.amazon.com/Sedimentary-Structures-Third-John-Collinson/dp/190354419X
- 30. Habicht, J.K.A. (1979) Paleoclimate, Paleomagnetism, and Continental Drift. American Association of Petroleum Geologists Studies in Geology, 9, 1-29
- 31. Tozer, E.T. (1982) Marine Triassic Faunas of North America: Their Significance for Assessing Plate and Terrane Movements. Geologische Rundschau, 71, 1077-1104. https://doi.org/10.1007/BF01821119
- 32. Gibson, D.W and Barclay, J.E. (1989) Middle Absaroka Sequence, the Triassic Stable Craton. In: Ricketts, B.D., Ed., Western Canada Sedimentary Basin: A Case History, Canadian Society of Petroleum Geologists, 219-231.
- 33. Arnold, K.J. (1994) Origin and Distribution of Aeolian Sandstones in the Triassic Charlie Lake Formation, Northeastern British Columbia. Unpublished M.Sc. Thesis, University of Alberta, Edmonton, 320 p.
- 34. Wilson, K.M., Pollard, D., Hay, W.W., Thompson, S.L. and Wold, C.N. (1994) General Circulation Model Simulations of Triassic Climates: Preliminary Results. In: Klein, G.D., Ed., Pangea: Paleoclimate, Tectonics, and Sedimentation during Accretion, Zenith, and Breakup of a Supercontinent, Geological Society of America, Special Paper, 288, 91-116. https://doi.org/10.1130/SPE288-p91
- 35. Porter, J.W., Price, R.A. and McCrossan, R.G. (1982) The Western Canada Sedimentary Basin. Philosophical Transaction Royal Society, London, 305, 169-192. https://doi.org/10.1098/rsta.1982.0032
- 36. Price, R.A. (1994) Cordilleran Tectonics and the Evolution of the Western Canada Sedimentary Basin. In: Geological Atlas of the Western Canada Sedimentary Basin (Chapter 2). Canadian Society of Petroleum Geologists. http://ags.aer.ca/publications/chapter-2-cordilleran-tectonics.htm
- 37. Monger, J.W.H. and Price, R.A. (1979) Geodynamic Evolution of the Canadian Cordillera—Progress and Problems. Canadian Journal of Earth Sciences, 16, 770-791. https://doi.org/10.1139/e79-069
- 38. Wittenberg, J. and Moslow, T.F. (1991) Origin and Variability of Overthickened Sandstone in the Doig Formation, West-Central Alberta. Canadian Society of Petroleum Geologists, Calgary, 146.
- 39. Cant, D.J. (1984) Possible Syn-Sedimentary Tectonic Controls on Triassic Reservoirs, Halfway and Doig, Charlie Lake formations, West-Central, Canadian Society of Petroleum Geologists, Calgary, 45.
- 40. Cant, D.J. (1986) Hydrocarbon trapping in the Halfway Formation (Triassic) Wenbly Field, Alberta. Bulletin of Canadian Petroleum Geology, 34, 329-338.
- 41. Edwards, D.E., Barclay, J.E., Gibson, D.W., Kvill, G.E. and Halton, E. (1994) Triassic Strata of the Western Canada Sedimentary Basin. Geological Atlas of Western Canada (Chapter 16): Calgary, Canadian Society of Petroleum Geologists/Alberta Research Council, 257-275.
- 42. Orchard, M.J. and Zonneveld, J.-P. (2009) The Lower Triassic Sulphur Mountain Formation in the Wapiti Lake Area: Lithostratigraphy, Conodont Biostratigraphy, and a New Biozonation for the Lower Olenekian (Smithian). Canadian Journal of Earth Sciences, 46, 757-790. https://doi.org/10.1139/E09-051
- 43. Willis, A.J. (1992) Sedimentology and Stratigraphic Framework of the Middle Triassic Halfway Formation, Wembly Oil Field, Alberta. Unpublished Master’s Degree Thesis, University of Alberta, 412 p.
- 44. Behar, F., Beaumont, V., Penteado, H.L. and De, B. (2001) Rock-Eval 6 Technology: Performances and Developments. Oil and Gas Science and Technology—Revue de l’Institut Francais du Petrole, 56, 111-134. https://doi.org/10.2516/ogst:2001013
- 45. Tissot, B.P. and Welte, D.H. (1978) Petroleum Formation and Occurrence. Springer-Verlag, Berlin, 538 p. https://doi.org/10.1007/978-3-642-96446-6
- 46. Lafargue, E., Espitalié, J. Marquis, F. and Pillot, D. (1998) Rock-Eval 6 Applications in Hydrocarbon Exploration, Production and in Soil Contamination Studies. Institut Fran?ais du Pétrole, France, 1-23. https://doi.org/10.2516/ogst:1998036
- 47. Espitalié, J., Deroo, G. and Marquis, F. (1985) Rock-Eval Pyrolysis and Its Applications: Revue de l’Institut Fran?ais du Pétrole, Rueil, France.
- 48. Waples, D.W. (1945) Geochemistry in Petroleum Exploration. International Human Resources Development Corporation, Boston, 232 p.
- 49. Renov, A.B. (1985) Organic Carbon in Sedimentary Rocks (in Relation to the Presence of Petroleum). Geochemistry, 5, 497-509.
- 50. Peters, K.E. and Cassa, M.R. (1994) Applied Source Rock Geochemistry. In: Magoon, L.B. and Dow, W.G., Eds., The Petroleum System—From Source to Trap, 1994. American Association of Petroleum Geologists Memoir, 60, 93-111.
- 51. Senftle, J.T. and Landis, C.R. (1991) Vitrinite Reflectance as a Tool to Assess Thermal Maturity. In: Merrill, R.K., Ed., Source and Migration Processes and Evaluation Techniques: AAPG Treatise of Petroleum Geology, Handbook of Petroleum Geology, 119-125.
- 52. Jarvie, D.M. (1991) Hydrocarbon Generation Modeling of Naturally and Artificially Matured Barnett Shale, Forth Worth Basin, Texas: Southwest Regional Geochemistry Meeting, September 8-9, 1991, The Woodlands, Texas.
- 53. Demaison, G.J., and Moor, G.T. (1980) Anoxic Environments and Oil Source Rock Bed Genesis. American Association of Petroleum Geologists Bulletin, 64, 1179-1209.
- 54. Jacobson, S.R. (1991) Petroleum Source Rocks and Organic Facies. In: Merrill, R.K., Ed., Source and Migration Processes and Evaluation Techniques, American Association of Petroleum Geologists Treatise of Petroleum Geology, Handbook of Petroleum Geology, 3-11.
- 55. Killops, S. and Killops, V. (2005) Introduction to Organic Geochemistry (ed.). Blackwell Science, Oxford, UK, 393 p.
- 56. Dow, W. (1977) Kerogen Studies and Geological Interpretations. Journal of Geochemical Exploration, 7, 79-99. https://doi.org/10.1016/0375-6742(77)90078-4
- 57. Hunt, J.M. (1979) Source Rock. In: Petroleum Geochemistry and Geology, 2nd Edition, New York, 323-380.
- 58. Jarvie, D.M., Hill, R.J., Rubble, T.E. and Pollastro, R.M. (2007) Unconventional Shale-Gas Systems: Mississippian Barnett Shale of North-Central Texas as One Model for Thermogenic shale-Gas Assessment. American Association of Petroleum Geologists Bulletin, 19, 475-499. https://doi.org/10.1306/12190606068
- 59. Gehman Jr., H.M. (1962) Organic Matter in Limestones. Geochimica et Cosmochimica Acta, 26, 885-897. https://doi.org/10.1016/0016-7037(62)90118-7
- 60. Van Krevelan, D.W. (1961) Coal. Amsterdam, Elsevier, 514 p.
- 61. Stach, E., Chandra, D., Mackowsky, M., Taylor, G., Teichmüller, M. and Teichmüller, R. (1982) Coal Petrology (ed.). Geruder Borntraeger, Berlin, 535 p.
- 62. Demaison, G.J., Holck, A.J.J., Jones, R.W. and. Moore, G.T (1983) Predictive Source Bed Stratigraphy; a Guide to Regional Petroleum Occurrence. Proceedings of the 11th World Petroleum Congress, London, 2, 17-29.
- 63. Héroux, Y.A., Chagnon, A. and Bertrand, R. (1976) Compilation and Correlation of Major Thermal Maturation Indicators. American Association of Petroleum Geologists Bulletin, 63, 2128-2144.
- 64. Corcoran, D.V. and Clayton, G. (2001) Interpretation of Vitrinite Reflectance Profiles in Sedimentary Basins, Onshore and Offshore Ireland. In: Shannon, P.M., Haughton, P.D.W. and Corcoran, D.V., Eds., The Petroleum Exploration of Ireland’s Offshore Basins, Geological Society, London, Special Publications, 188, 61-90. https://doi.org/10.1144/GSL.SP.2001.188.01.04
- 65. Alixant, J.L., Looyestijn, W. and Hofman, J. (1998) Unusual Logs in an Unusual Formation: NMR in Athel Silicilyte, Submitted for Presentation at Europen, 20-22 October 1998. The Hague, Netherlands.
- 66. Bachu, S. (1992) Basement Heat Flow in the Western Canada Sedimentary Basin. Tectonophysics, No. 222, Elsevier Science Publishers, Amsterdam, 119-133.
- 67. Bachu, S. and Burwash, R.A. (1991) Regional-Scale Analysis of the Geothermal Regime in the Western Canada Sedimentary Basin. Geothermics, 20, 387-407. https://doi.org/10.1016/0375-6505(91)90028-T
- 68. Garland, G.D. and Lennox, D.H. (1962) Heat Flow in Western Canada. Geophysical Journal, 6, 245-262. https://doi.org/10.1111/j.1365-246X.1962.tb02979.x
- 69. Angling, F.M. and Beck, A.E. (1965) Regional Heat Flow in Western Canada. Canadian Journal of Earth Sciences, 2, 176-182. https://doi.org/10.1139/e65-015
- 70. Rybach, L. (1981) Geothermal Systems, Conductive Heat Flow, Geothermal Anomalies. In: Rybach, L. and Muffler, L.J.P., Eds., Geothermal Systems: Principles and Case Histories, Wiley, New York, 3-76.
- 71. Hitchon, B. (1984) Geothermal Gradients, Hydrodynamics and Hydrocarbon Occurrences, Alberta, Canada. American Association of Petroleum Geologists Bulletin, 68, 713-743.
- 72. Bachu, S. (1985) Influence of Lithology and Fluid Flow on the Temperature Distribution in a Sedimentary Basin: A Case Study from the Cold Lake Area, Alberta, Canada. Tectonophysics, 120, 257-284. https://doi.org/10.1016/0040-1951(85)90054-X
- 73. Bachu, S. (1988) Analysis of Heat Transfer Processes and Geothermal Pattern in the Alberta Basin, Canada. Journal of Geophysical Research, 93, 7767-7781. https://doi.org/10.1029/JB093iB07p07767
- 74. Bachu, S. (1990) On the Effective Thermal and Hydraulic Conductivity of Binary Heterogeneous Sediments. Tectonophysics, 190, 299-314. https://doi.org/10.1016/0040-1951(91)90435-U
- 75. Bachu, S. and Cao, S. (1992) Present and Past Geothermal Regimes and Source Rock Maturation, Peace River Arch Area, Canada. American Association of Petroleum Geologists, 76, 1533-1549.
- 76. Majorowicz, J.A. and Jessop, A.M. (1981) Regional Heat Flow Patterns in the Western Canada Sedimentary Basin. Tectonophysics, 74, 209-238. https://doi.org/10.1016/0040-1951(81)90191-8
- 77. Majorowicz, J.A., Jones, F.W., Lam, H.L. and Jessop, A.M. (1985) Regional Variations of Heat Flow Differences with Depth in Alberta, Canada. Geophysical Journal of the Royal Astronomical Society, 81, 479-487. https://doi.org/10.1111/j.1365-246X.1985.tb06415.x
- 78. Majorowicz, J.A., Jones, F.W. and Jessop, A.M. (1986) Geothermics of the Williston basin in Canada in Relation to Hydrodynamics and Hydrogen Occurrences. Geophysics, 51, 767-779. https://doi.org/10.1190/1.1442129
- 79. Jones, F.W., Lam, H.L. and Majorowicz, J.A. (1985a) Temperature Distributions at the Paleozoic and Precambrian Surfaces and Their Implications for Geothermal and Energy Recovery in Alberta. Canadian Journal of Earth Science, 22, 1774-1780. https://doi.org/10.1139/e85-188
- 80. Jones, F.W., Majorowicz, J.A. and Lam, H.L. (1985b) The Variation of Heat Flow Density with Depth in the Prairies Basin of Western Canada. Tectonophysics, 121, 35-44. https://doi.org/10.1016/0040-1951(85)90266-5
- 81. Teichmüller, M. (1989) The Genesis of Coal from the Viewpoint of Coal Petrology. International Journal of Coal Geology, 12, 1-87. https://doi.org/10.1016/0166-5162(89)90047-5
- 82. Teichmüller, M. (1982) Application of Coal Petrological Methods in Geology Including Oil and Natural Gas Prospecting. In: Stach, E., Mackowsky, M.-Th., Teichmüller, M., Taylor, G.H., Chandra, D. and Teichmüller, R., Eds., Stach’s Textbook of Coal Petrology, Gebrüder Borntraeger, Berlin, 381-413.
- 83. Dembicki Jr., H. (1984) An Interlaboratory Comparison of Source Rock Data. Geochemica et Cosmochimica Acta, 48, 2641-2649. https://doi.org/10.1016/0016-7037(84)90312-0
- 84. Hood, A., Gutjahr, C.C.M. and Heacock, R.L. (1975) Organic Metamorphism and Generation of Petroleum. American Association of Petroleum Geologists Bulletin, 59, 986-996.
- 85. Tiab, D. and Donaldson, E.C. (2004) Petrophysics, Theory and Practice of Measuring Reservoir and Fluid Transport Properties. 2nd Edition, Gulf Professional Publishing, New York, 881 p.
- 86. Chehrazi, A, and Rezaee, R. (2012) A Systematic Method for Permeability Prediction, a Petro-Facies Approach. Journal of Petroleum Science and Engineering, 82-83, 1-16A. https://doi.org/10.1016/j.petrol.2011.12.004
- 87. Ahmed, U., Crary, S.F. and Coates, G.R. (1991) Permeability Estimation: The Various Sources and Their Interrelationships. Journal of Petroleum Technology, 43, 578-587. https://doi.org/10.2118/19604-PA
- 88. Ehrlich, R., Bowers, M.C., Riggert, V.L. and Prince, C.M. (1997) Detecting Permeability Gradients in Sandstone Complexes—Quantifying the Effect of Diagenesis on Fabric. In: Kupeez, J.A., Gluyas, J. and Bloch, S., Eds., Reservoir Quality Prediction in Sand Stones and Carbonates: American Association of Petroleum Geologists Memoir, 69, 103-114.
- 89. Pemberton, S.G., and Gingras, M.K. (2005) Classification and Characterizations of Biogenetically Enhanced Permeability. American Association of Petroleum Geologist Bulletin, 89, 1493-1517. https://doi.org/10.1306/07050504121
- 90. Gordon, J.B., Pemberton, S.G. and Gingras M.K. (2010) Biogenetically Enhanced Permeability: A Petrographic Analysis of Macaronichnus segregatus in the Lower Cretaceous Bluesky Formation, Alberta, Canada. American Association of Petroleum Geologists Bulletin, 94, 1779-1795. https://doi.org/10.1306/04061009169
- 91. Asquith, G., Krygowski, D. Henderson, S. and Hurley, N. (2004) Basic Well Log Analysis. 2nd Edition, AAPG Methods in Exploration Series 6, American Association of Petroleum Geologists, 244 p.
- 92. Castle, J.W. and Bryrnes, A.P. (2005) Petrophysics of Lower Silurian Sandstone and Integration with the Tectonic-Stratigraphic Framework, Appalachian Basin United States. Bulletin of American Association of Petroleum Geologists, 89, 41-60. https://doi.org/10.1306/08170404028
- 93. Thomas, R.D. and Ward, D.C. (1972) Effect of Overburden Pressure and Water Saturation on Gas Permeability of Tight Sandstone Cores. Journal of Petroleum Technology, 25, 120-124. https://doi.org/10.2118/3634-PA
- 94. Dutton, S.P., Clift, S.J. Hamilton, D.S. Hamlin, H.S. Hentz, T.F. Howard, W.E., Akhter, M.S. and Laubach, S.E. (1993) Major Low-Permeability Sandstone Gas Reservoirs in the Continental United States. Texas Bureau of Economic Geology Report of Investigations, 211, 221 p.