Natural Resources
Vol.4 No.8(2013), Article ID:41449,6 pages DOI:10.4236/nr.2013.48060
A Comparative Environmental Evaluation of the Coal and Natural Gas Life Cycle
![]()
Power Plant Department, University Politehnica of Bucharest, Bucharest, Romania.
Email: crisflor75@yahoo.com
Copyright © 2013 Cristian Dincă. This is an open access article distributed under the Creative Commons Attribution License, which permits unrestricted use, distribution, and reproduction in any medium, provided the original work is properly cited. In accordance of the Creative Commons Attribution License all Copyrights © 2013 are reserved for SCIRP and the owner of the intellectual property Cristian Dincă. All Copyright © 2013 are guarded by law and by SCIRP as a guardian.
Received September 24th, 2013; revised October 27th, 2013; accepted November 18th, 2013
Keywords: Natural Gas; Coal; Life Cycle Assessment; Environmental Impact
ABSTRACT
Natural gas and coal are the main primary energy resources used in the Romanian energy sector, 73.7% in 2011, taking into account the fuel imports. The objective of the article consists in analyzing all the processes along the coal and the natural gas life cycle in order to assess their overall environmental impact. Two energy technologies were analyzed, for each resource: the pulverized coal combustion with supra-critical parameters and CO2 capture unit and the natural gas combined cycle. Considering the functional unit of electricity production for 1 year, it was found that the natural gas combined cycle remains the more interesting energy technology from an environmental point of view. However, the pulverized coal with supra-critical parameters equipped with a CO2 capture unit has the lowest environmental impact on the climate change. The weakest point of the coal technology is its low efficiency.
1. Introduction
In 2011, the electricity energy resources (98.4% comes from domestic production) were 1506 GWh (+2.4%) bigger than in 2010. This increase was due to the evolution of the fossil fuel production evolution (+2.0%, representing 1237 GWh). Imports increased by 269 GWh (35.1%), and electricity exports in 2011 were of 2942 GWh, with 99 GWh less than in 2010 (−3.3%). The thermoelectric energy production share in the total electricity production in 2011 was of 73.7%, an increase compared to 2010 when it accounted for 66.3%. This increase had to compensate for the reduced production of hydroelectric power, which was of 5297 GWh (−26.2%) less than in 2011 compared to the previous year [1-6].
Taking into account the high importance of the coal and natural gas in the Romanian energy sector, an environment study is necessary in order to identify the weakest points and to reduce the overall environmental impact on the whole life cycle. In order to evaluate the environmental impact, the life cycle assessment methodology was used. The LCA methodology comprises the followings stages:
• Definition of the objectives and of the boundaries;
• Inventory assessment;
• Impact assessment;
• Results interpretation and solutions to environmental amelioration.
The Life Cycle Assessment methodology is based on the emissions collected for all the processes of the coal and the natural gas life cycle, such as extraction, treatment, transport and fuel combustion for energy production.
The aim of the paper consists in identifying the emissions generated for every stage of the life cycle and in calculating the impact indicator according to environmental eco-systems. The values of the indicators help me choose that environmental friendly technology. On the results of the inventory and impact assessment, environmental solutions will be proposed in order to ameliorate the overall environmental impact.
2. Coal and Natural Gas Life Cycle
Figure 1 presents the processes for every stage of the coal and natural gas life cycle which were included in this analysis.
The life cycle of a fossil primary energy includes the
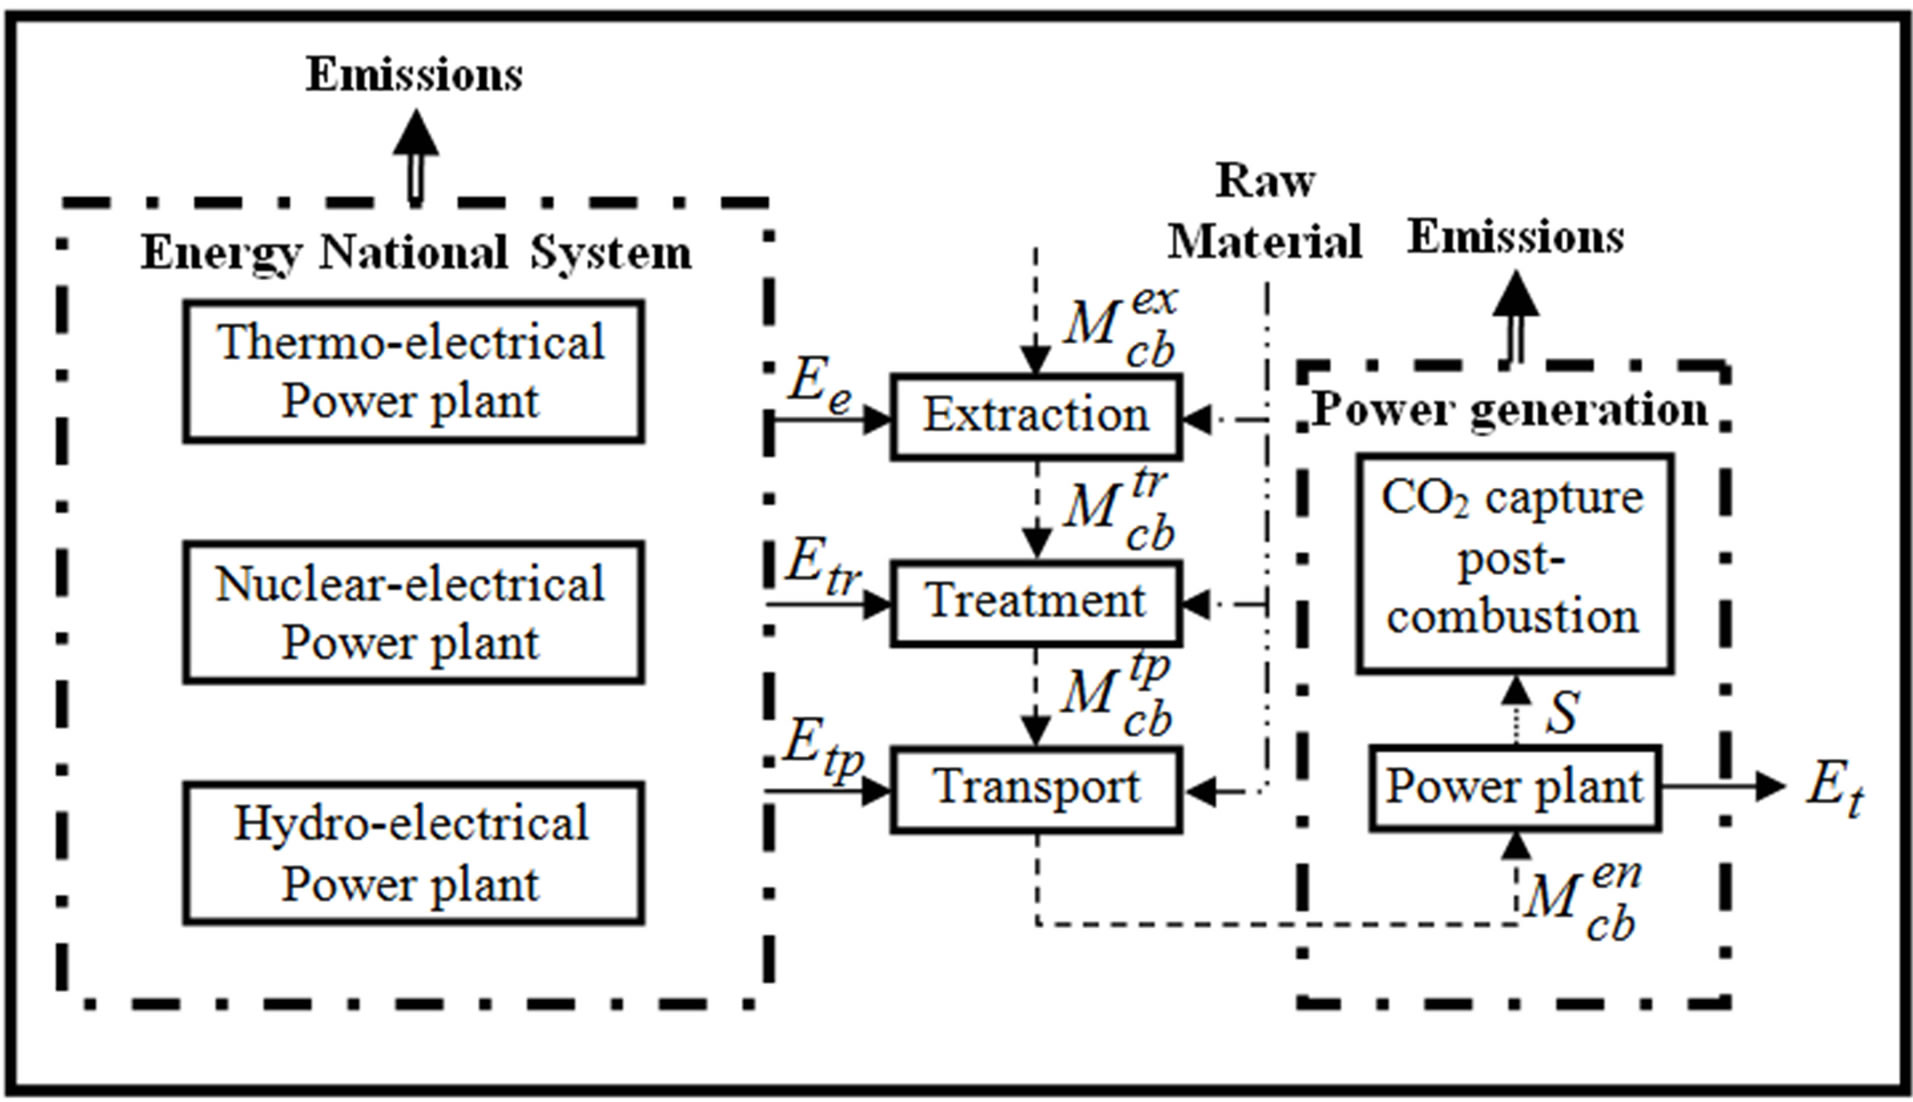
Figure 1. The boundaries of the studied system.
processes like extraction, treatment, transport and combustion for the generation of electricity. An assumption was made that the electricity consumed during every process of the life cycle is provided by the national energy system. Table 1 show the structure (the contribution) of the primary energy resources used in the Romanian electricity sector.
In order to calculate the emissions generated in every stage for coal and natural gas, the followings parameters were taken into account:
• The emission factors for each resource, in gr/kg;
• The contribution of each primary energy resource to the production of the energy used in the processes like extraction, treatment and transport of fuel (see the Table 1).
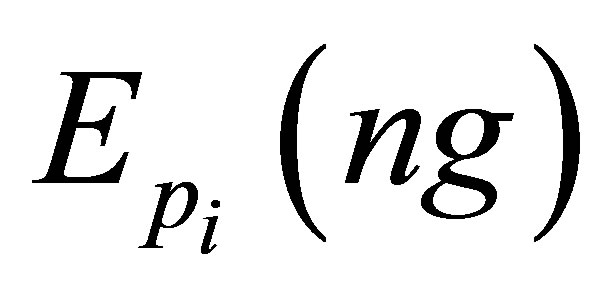
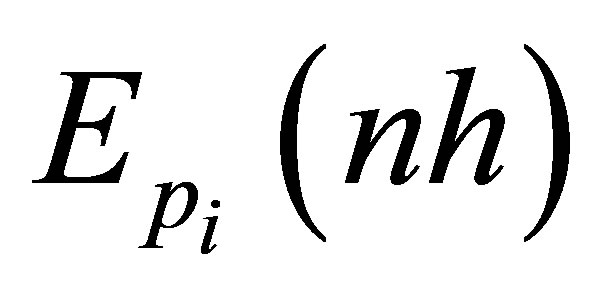
So, for a certain amount of electricity, the global emission for a pollutant, Epi, was determined by Equation (1):
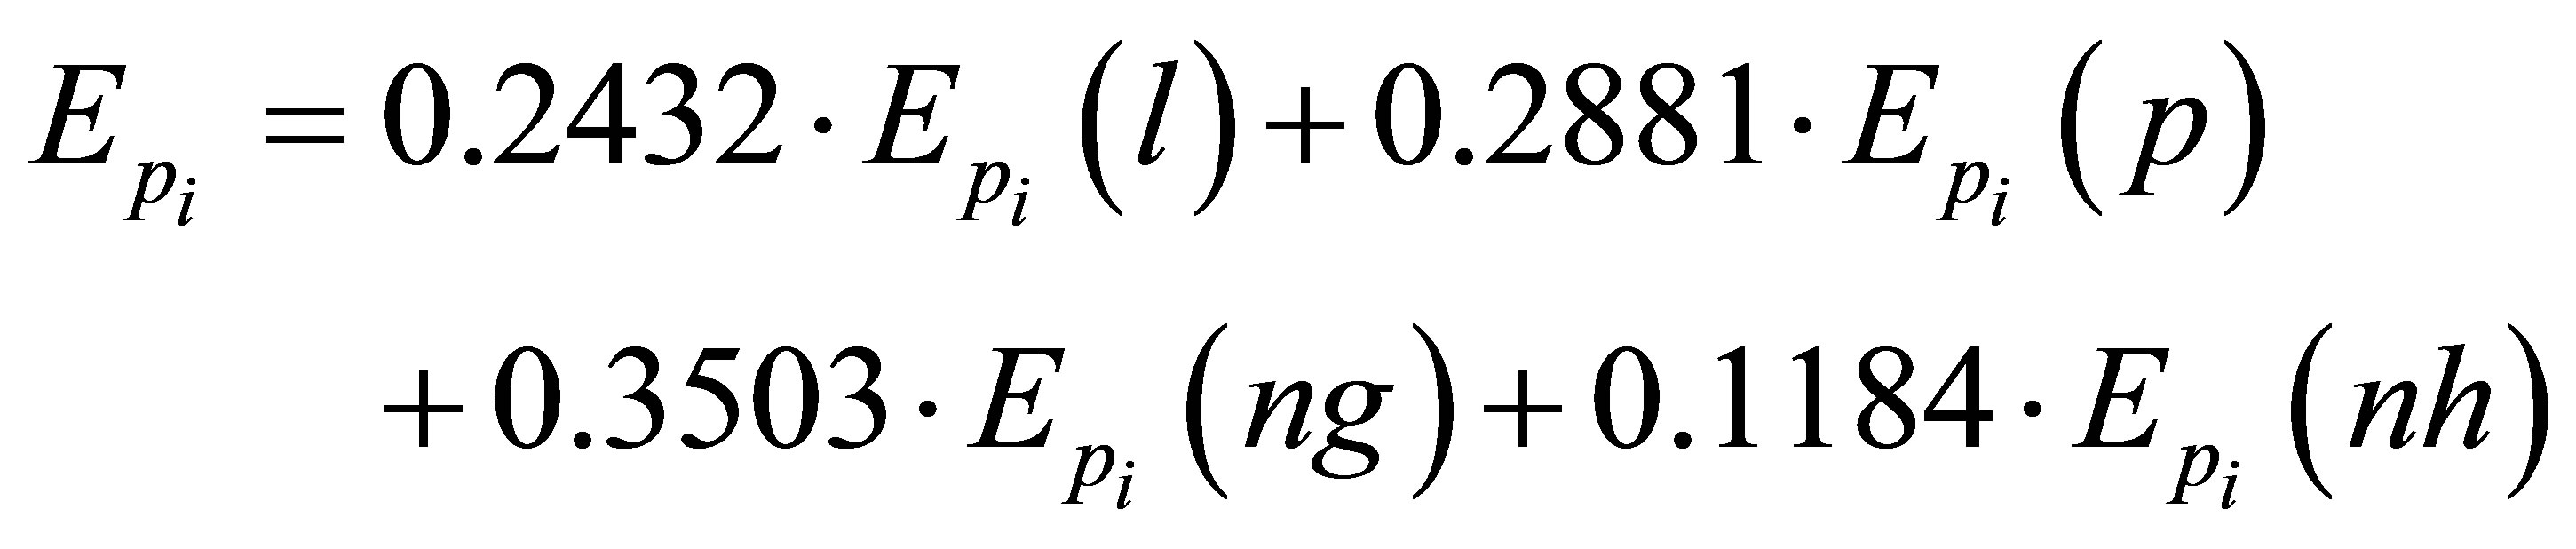 (1)
(1)
where:
 —the amount of the pollutant i generates in the lignite combustion, in gr;
 —the amount of the pollutant i generates in the petroleum combustion, in gr;
 —the amount of the pollutant i generates in the natural gas combustion, in gr;
 —the amount of the pollutant i generates in the nuclear conversion process, in gr.
2.1. Scope and Goal Definition
The aim of the article consists in analyzing the GHG emissions generated by the coal and the natural gas life cycle in the followings stages: coal and natural gas extraction, coal and natural gas treatment, coal and natural gas transport and coal and natural gas combustion for the generation of electricity.
In the electricity generation stage, the natural gas is used in the natural gas combined cycle while the coal is used in the pulverized coal with supra-critical and subcritical parameters. Table 2 shows the technical data for the natural gas combined cycle while Table 3 shows the technical data for the pulverized coal with sub-critical and supra-critical parameters.
2.2. Functional Unit
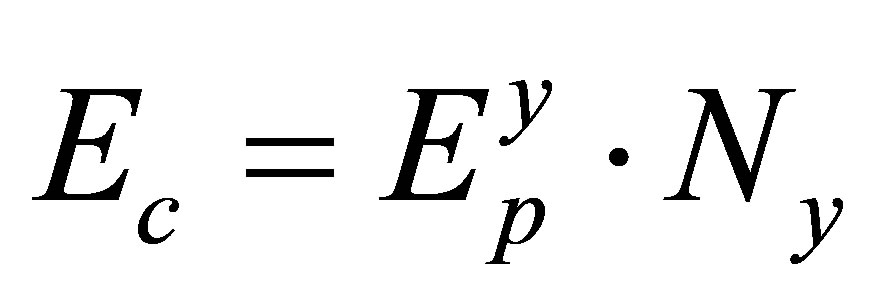
Taking into account the difference between the installed power of the two energy technological solutions, a functional unit needed to be established. Therefore, the functional unit was established according to a time unit, a product unit, and a function unit. Consequently, the functional unit is defined as the amount of electricity produced during one year. The electricity produced duringa one year was calculated using the equation below:
 (2)
(2)
where:
Pi—the gross power output, in MWe;
dyf—the operating hours in a one year, in h;
dv—the period assessment is a one year.
The electricity required by the consumer (Ec) from residential and tertiary sector is:
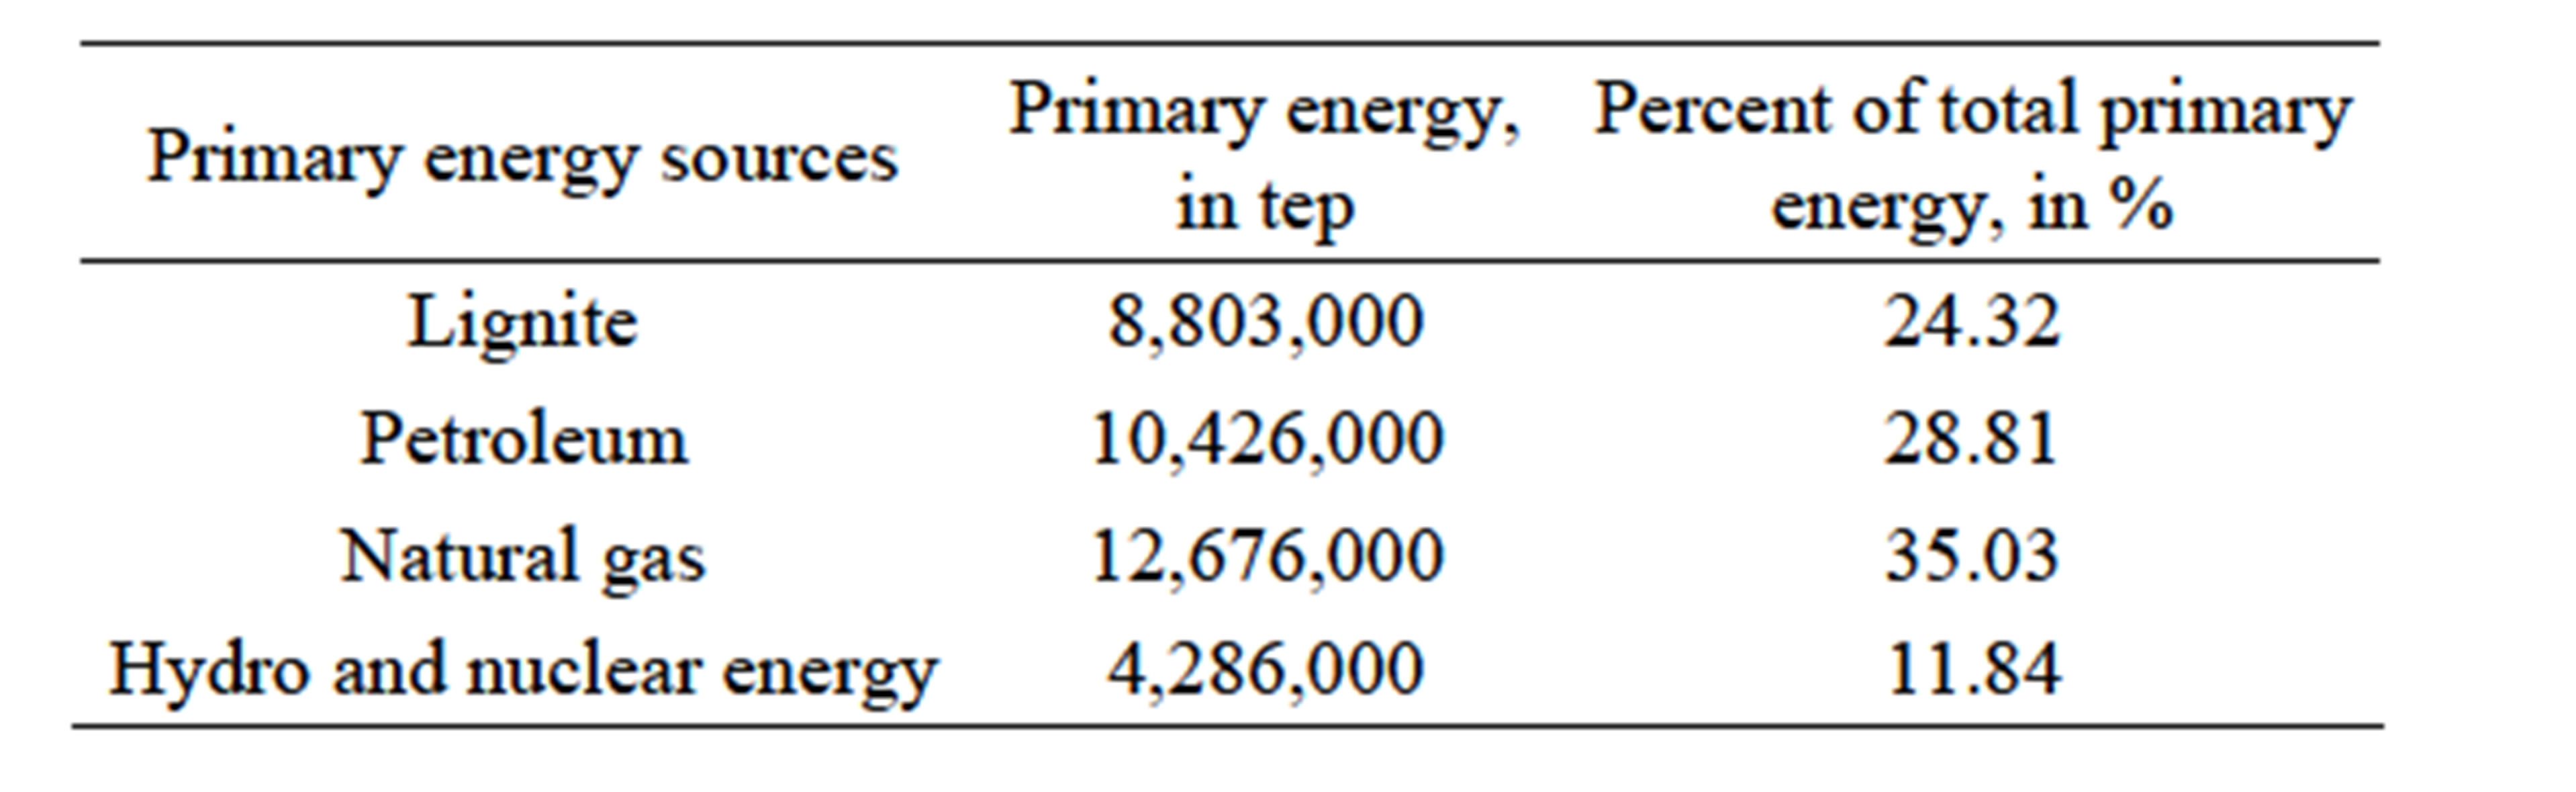
Table 1. Primary energy mixt for power engineering [2].
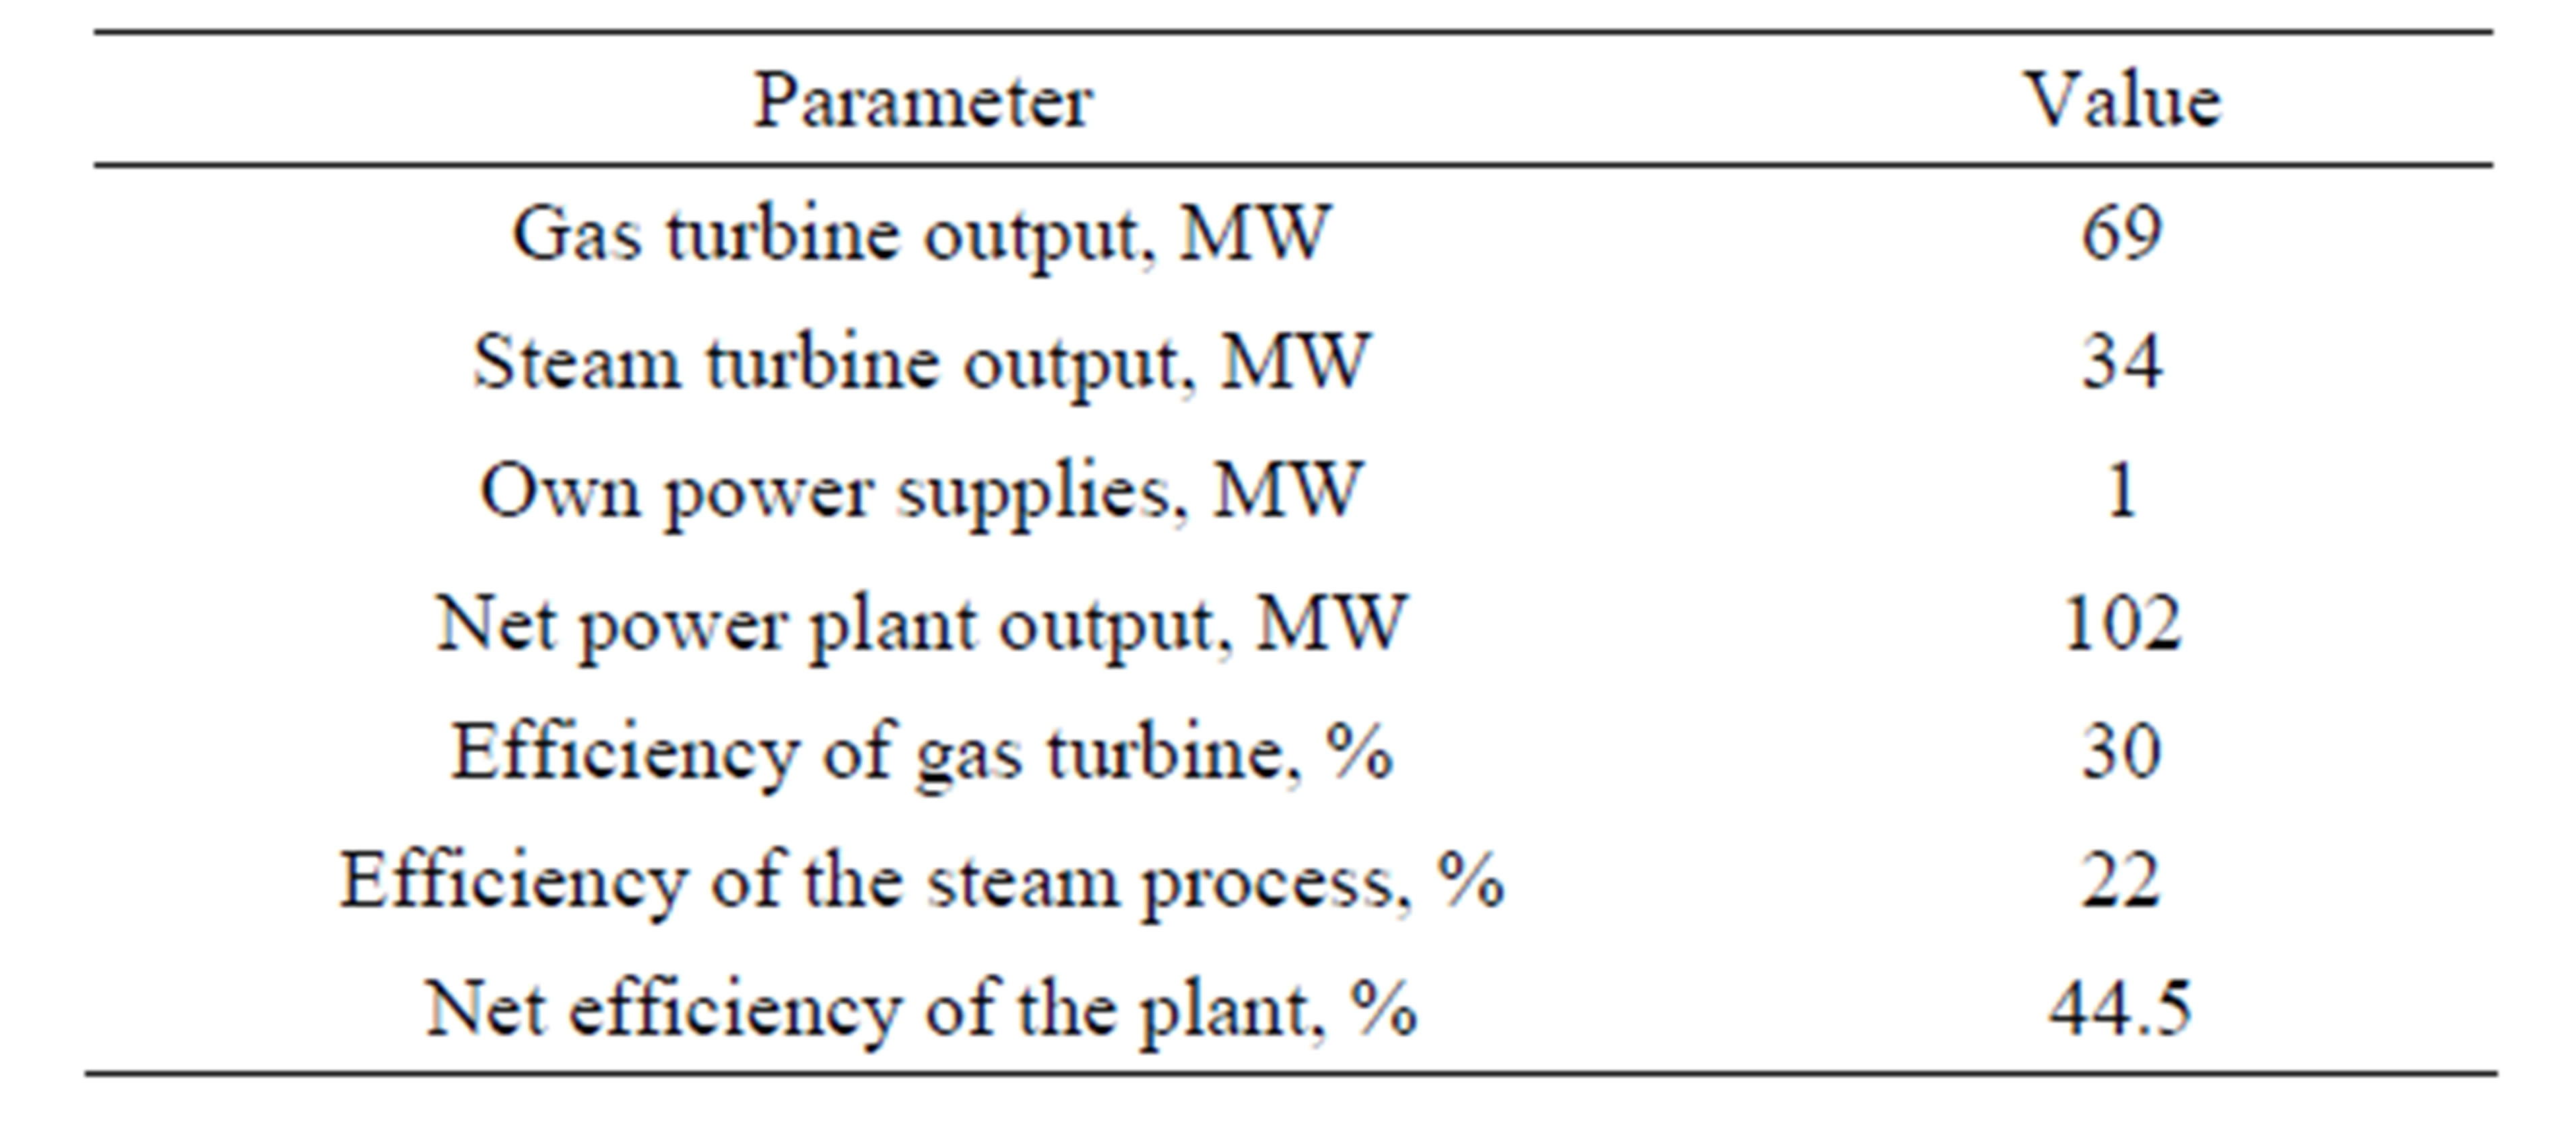
Table 2. Technical characteristics of the natural gas combined cycle power plant [7-9].
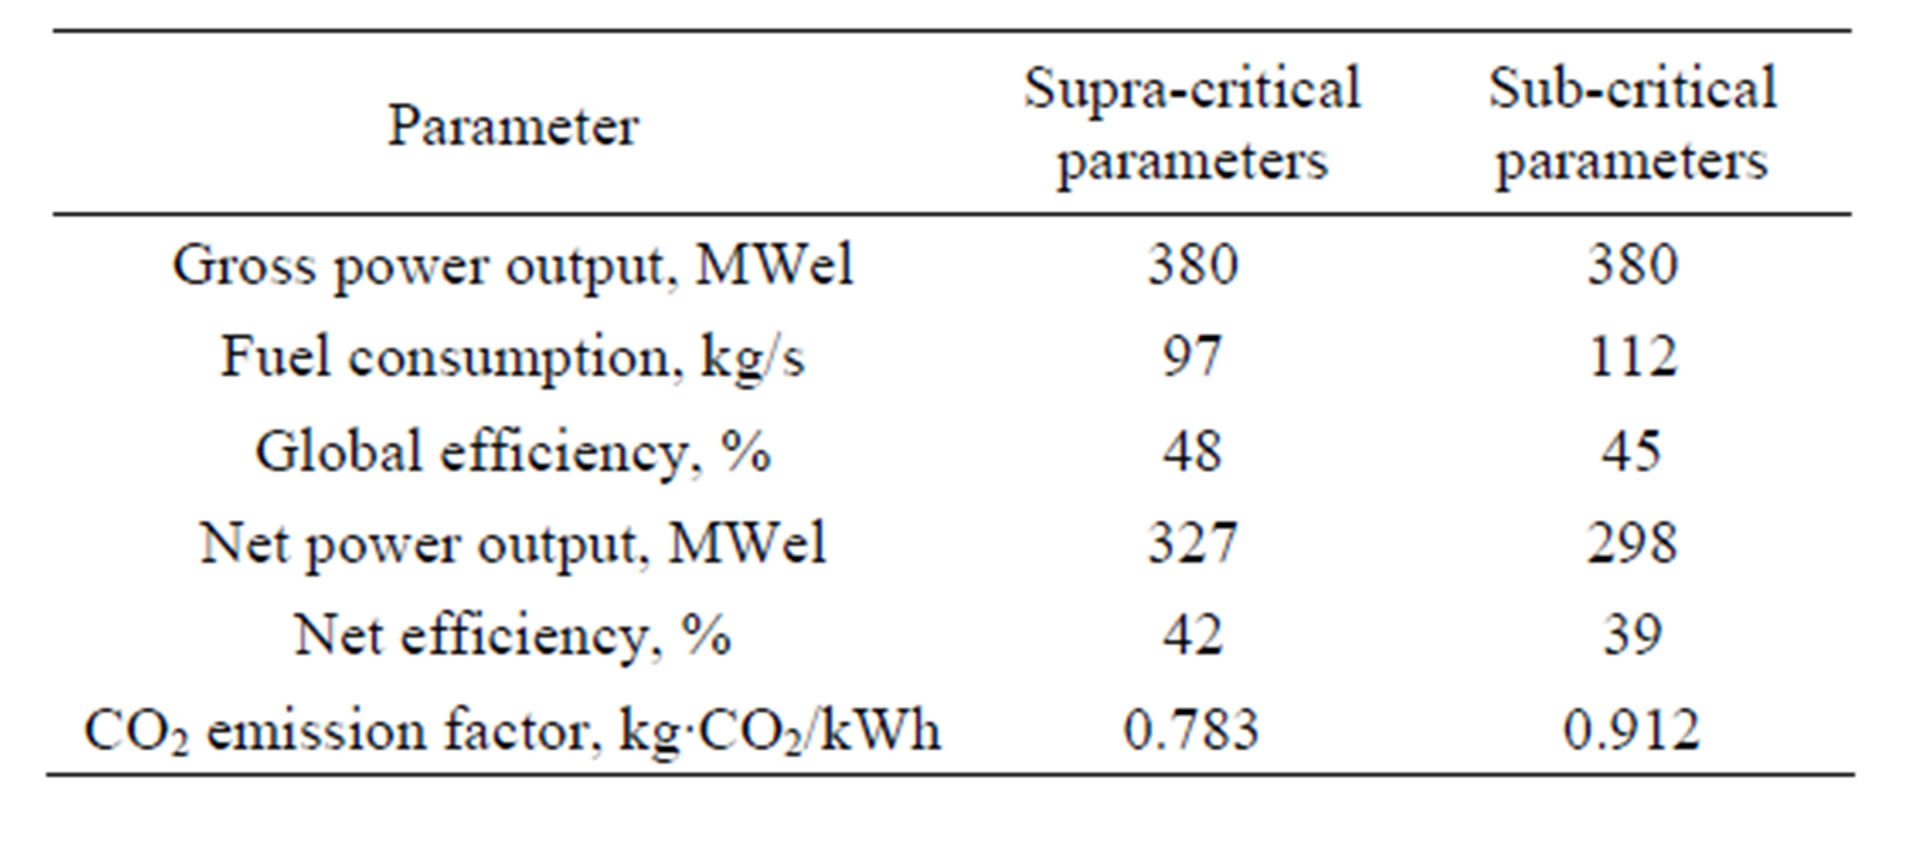
Table 3. Technical characteristics of the sub-critical and supracritical pulverized coal technology [7-9].
 (3)
(3)
where:
 —represents the annual electricity required by a person, in MWh/year/pers;
Ny—the number of persons of the consumer defined.
I made the assumption that the electricity loss in the distribution system is negligible, so .
.
2.3. Inventory Assessment
In this life cycle assessment stage, the emissions were collected for every process of the coal and the natural gas life cycle. Firstly, the specific emissions reported to mass of fuel were collected. Table 4 shows the pollutants collected for every process and fuel life cycle.
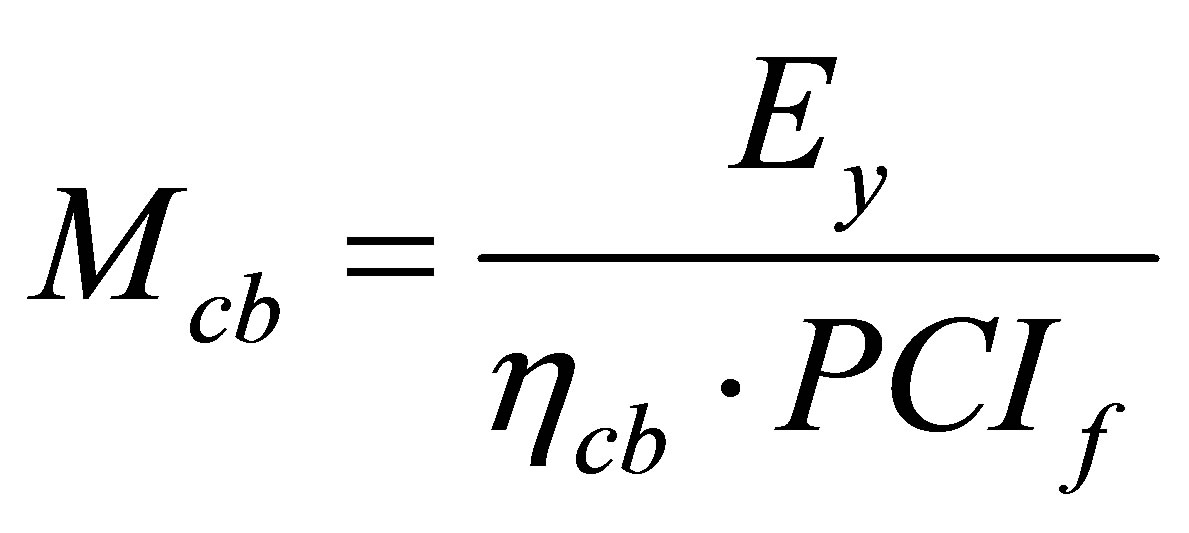
In order to report the emissions to the functional unit, the amount of fuel (coal and natural gas) for every stage of the life cycle was determined. So, the amount of the fuel necessary (Mcb) in the combustion stage is determined with the equation posted below:
 (4)
(4)
where:
ηcb—is the power engineering global efficiency, see the Tables 2 and 3;
PCIf—is the low heating value according to the fuel composition, in kJ/kg.
Equation (5) is was used for reporting the emissions to the functional unit acording to the amount of the fuel.
 (5)
(5)
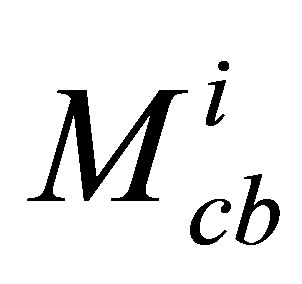 —the amount of fuel in the stage “i” of the coal and natural gas life cycle, in tons;
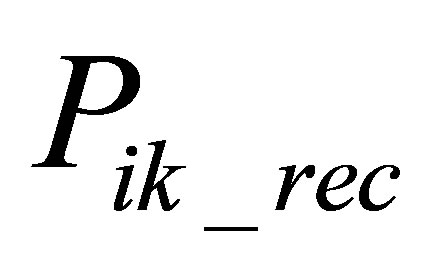 —the pollutant recalculated acording to the functional unit, in tons of pollutant;
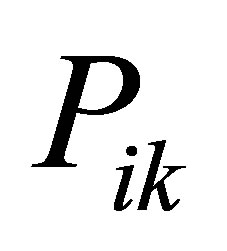 —the specific pollutant for each stage of the fuel life cycle presented in Tables 4 and 5.
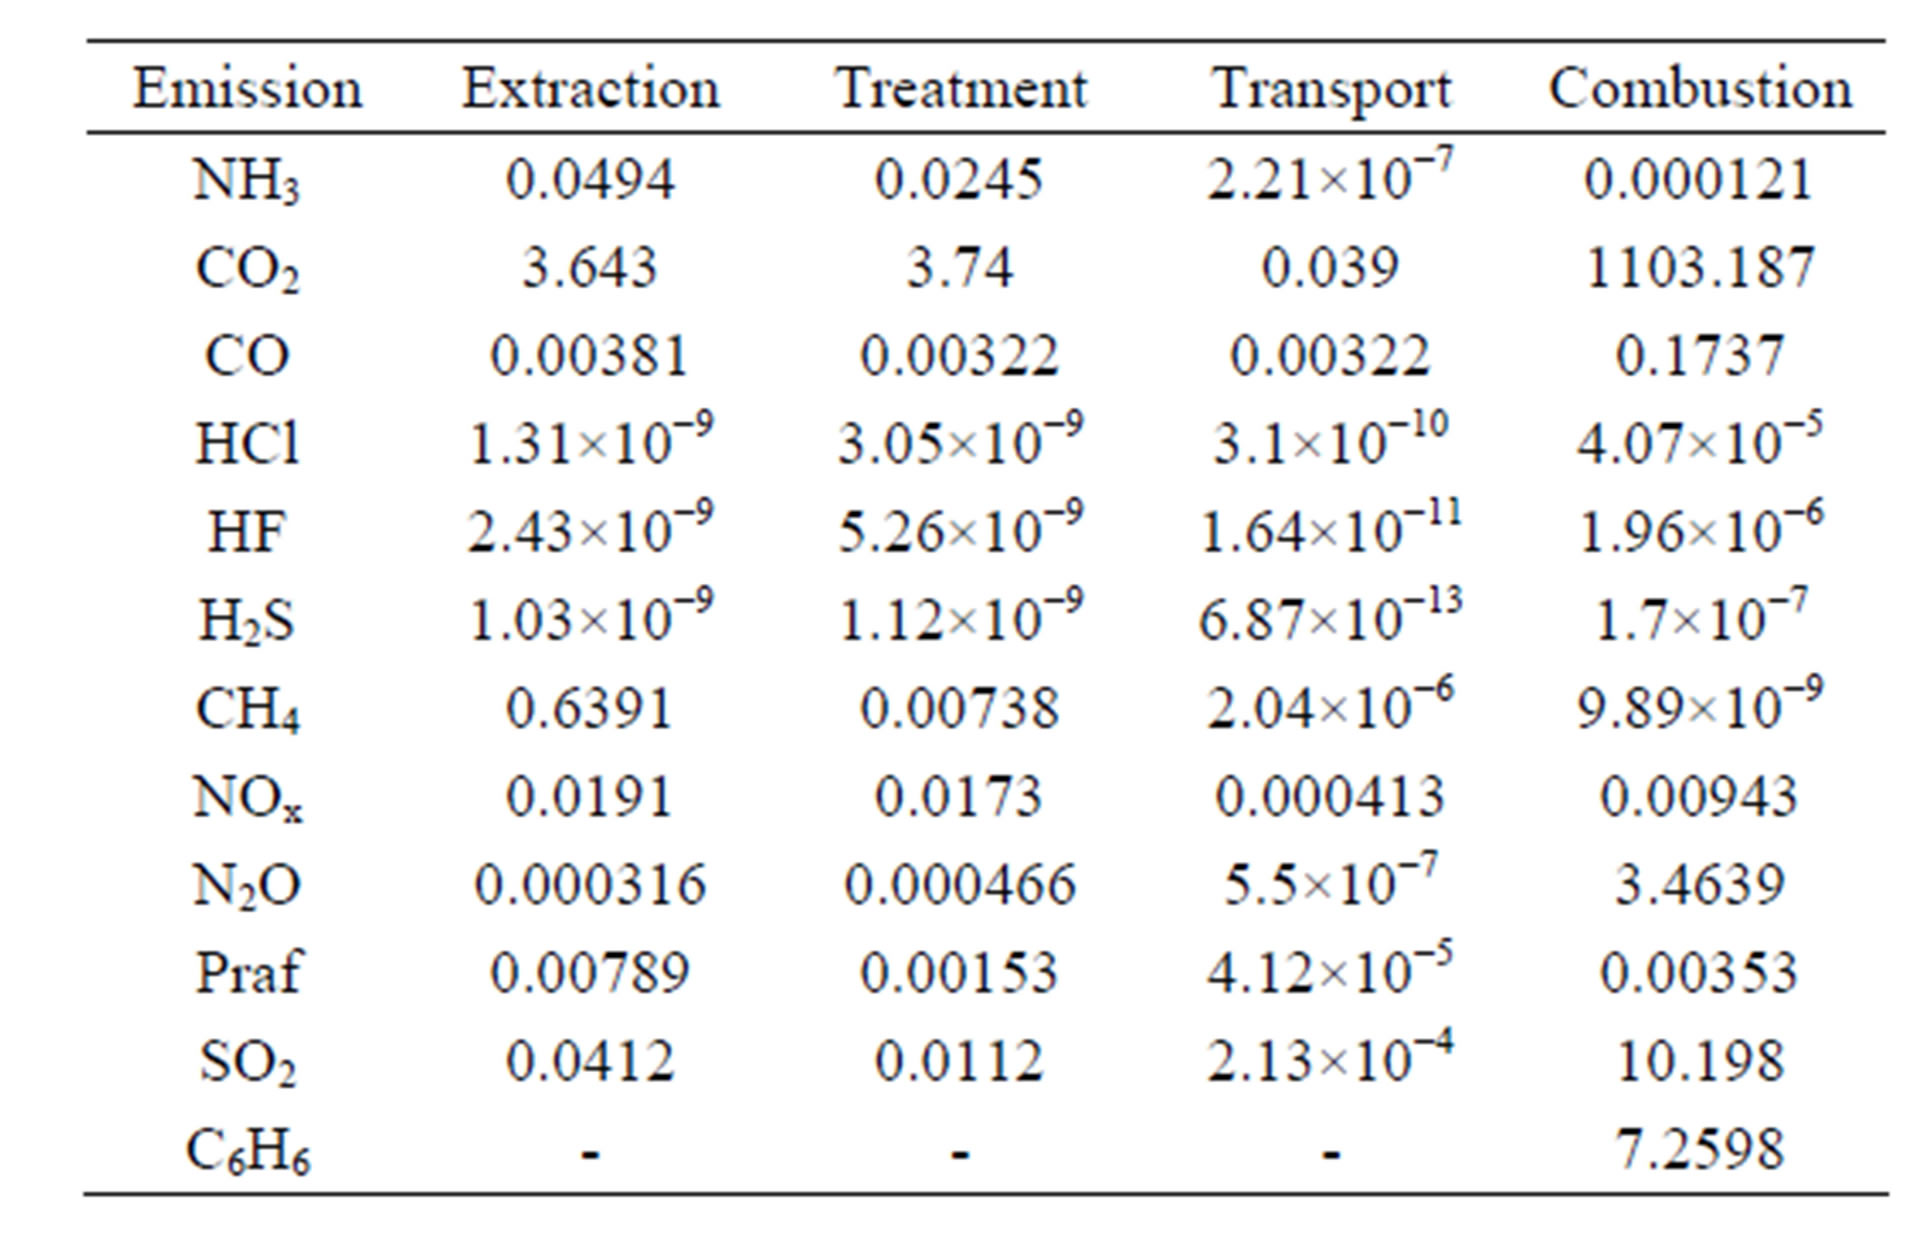
Table 4. The emissions generated by the each stage of the coal life cycle, in gr/kg [10].
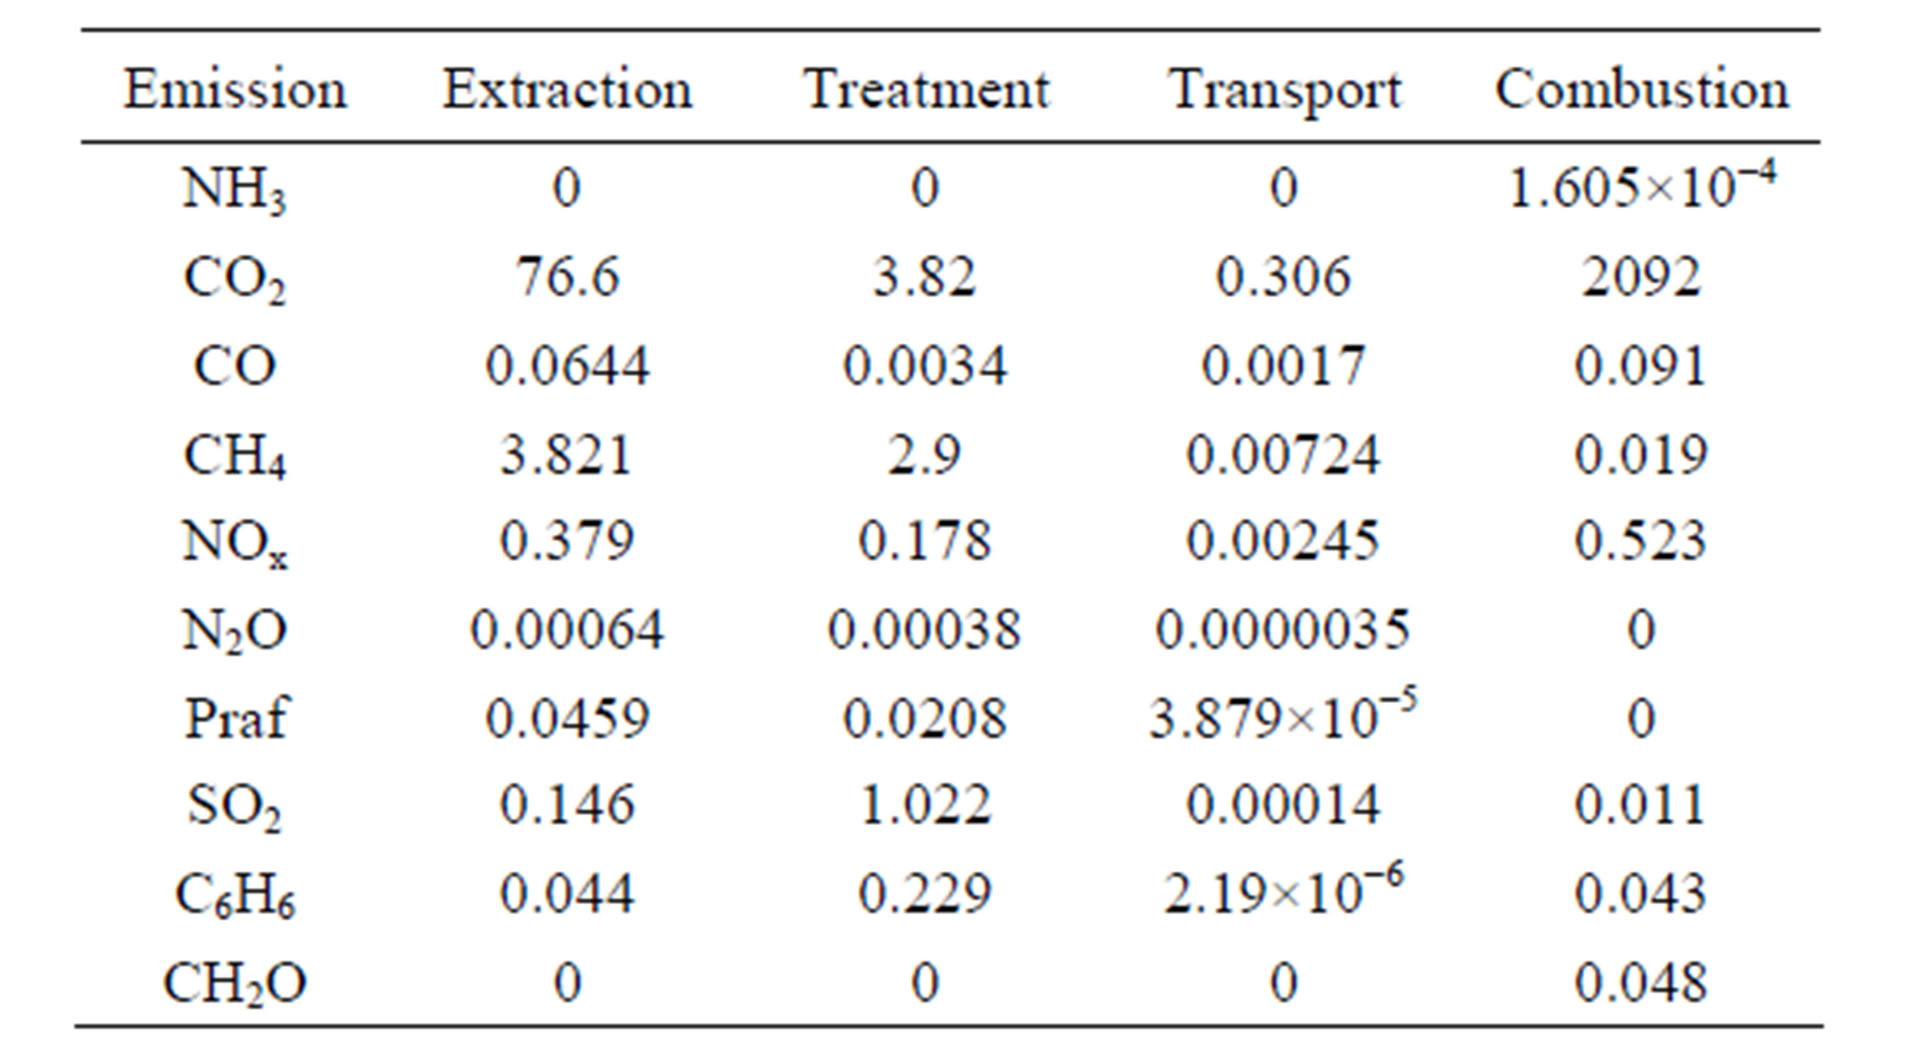
Table 5. The emissions generated by the each stage of the natural gas life cycle, in gr/kg [10].
2.4. Impact Assessment
The methodology CML was used in order to quantify all the emissions collected in the inventory assessment. The impact analysis is a methodology where the potential impact ofthe resource requirements and emissions is classified, characterizedand evaluated. The impact assessment includes three steps:
• Classification: relates the emissions to the relevant impactcategories;
• Characterization: quantifies the contribution of the emissions tothe relevant impact categories (e.g., convert NOx to SO2 equivalents);
• Evaluation: ranks the relevant impact categories.
Table 6 shows all the environmental indicators for the evaluation of the energy solutions.
3. Results and Discussion
In this section the results obtained in the impact evaluation stage for coal and natural gas life cycle were analyzed considering the emissions collected in Tables 4 and 5. The impact indicator was determined according with to the functional unit defined in the Section 2.1.
Figure 2 shows a comparison between the coal and natural abiotic depletion (ADP). The followings parameters were considered in this analysis [11]:
• For coal: ADPcoal = 0.00671 kg∙Sb/kg;
• For natural gas: ADPng = 0.0187 kg∙Sb/kg.
The values for the abiotic depletion potential mean that, nowadays, the coal reserves are bigger than the natural gas reserves.
For a better understanding, the fuels life cycles were noted:
• Case 1—pulverized coal with sub-critical parameters;
• Case 2—pulverized coal with supra-critical parameters with CO2 capture unit;
• Case 3—natural gas combined cycle.
Figures 2-8 show the global impact evaluation of the coal and natural gas life cycle for the environmental classes specified in the Table 6. In other words, three
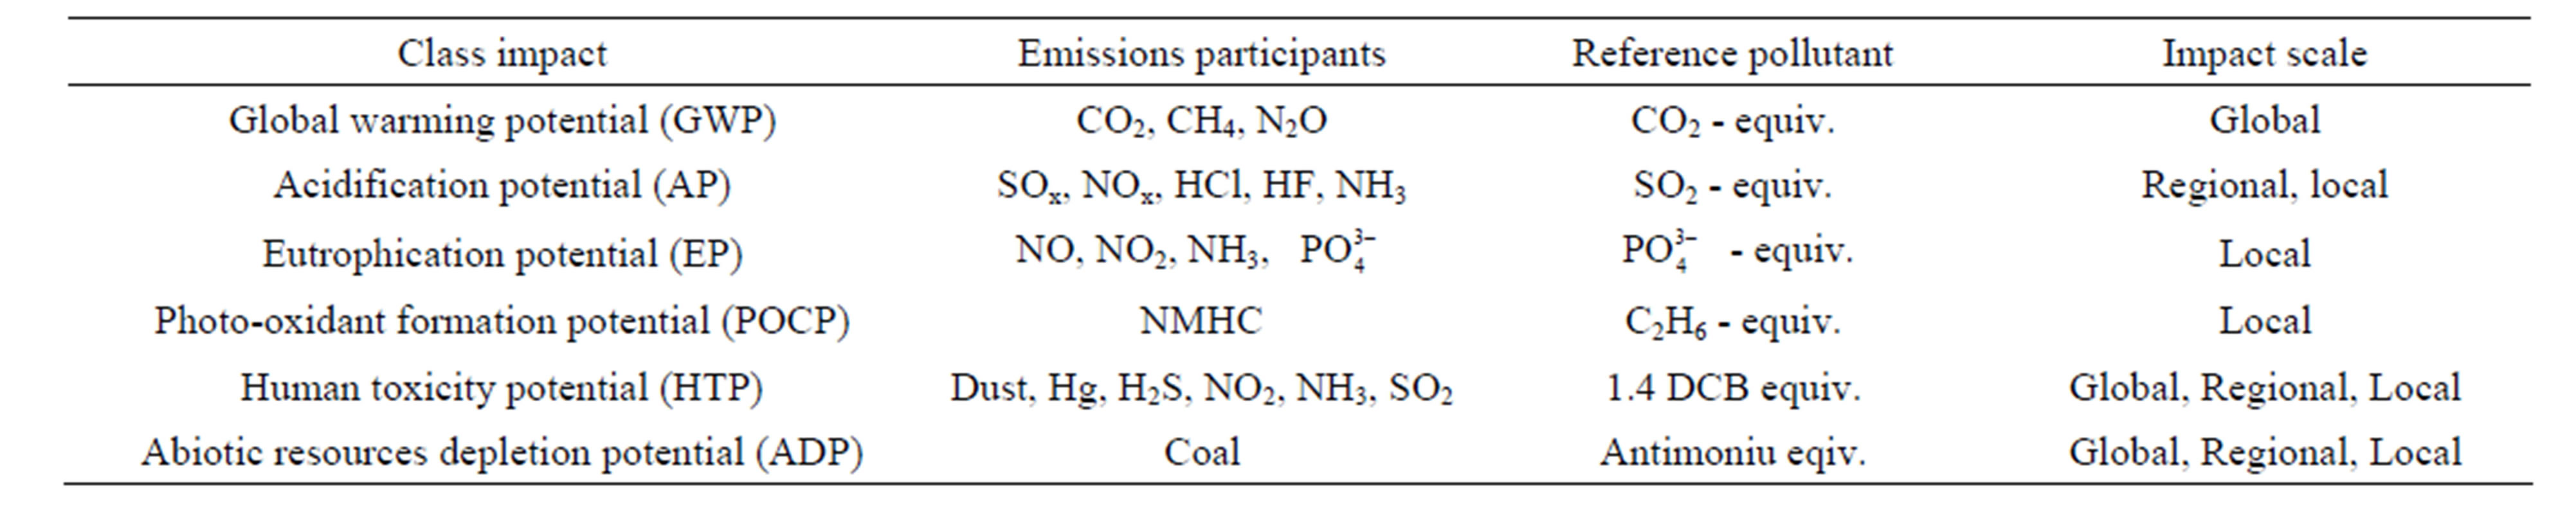
Table 6. The environmental impact indicators [11,12].
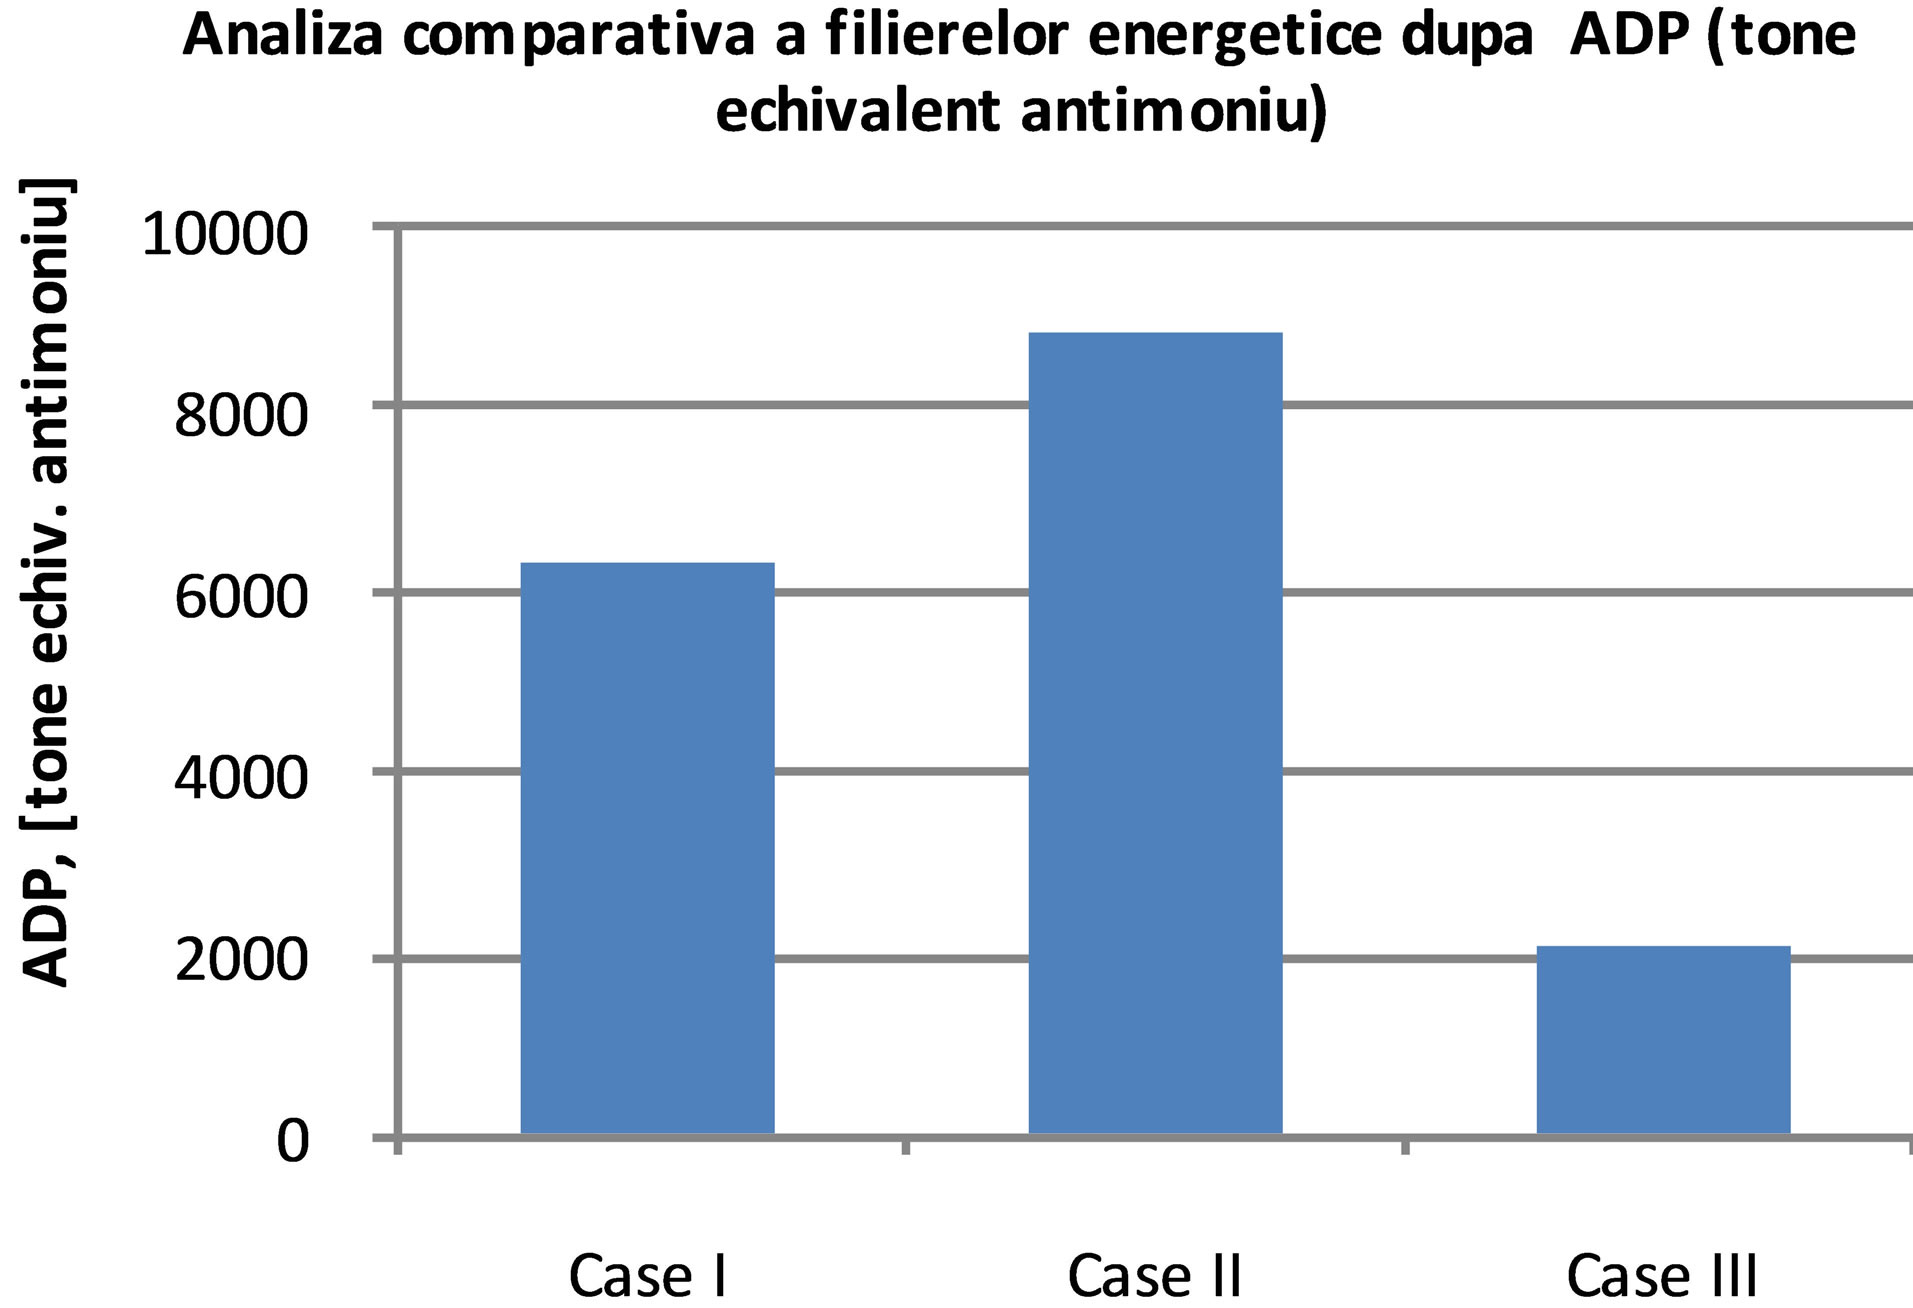
Figure 2. Comparative assessment of coal and natural gas life cycle according to ADP indicator.
cases were compared, two considering the coal combustion and one for the natural gas.
The objective of this paper consisted in determining the environmental effects of the coal life cycle with and without the CO2 capture unit compared with the natural gas technology. It is observed that in Case II (Figure 2) the amount of coal is superior to that in Case I, according to the CO2 capture unit provided for the second case. The global efficiency for the coal pulverized technology with supercritical parameters was of 30%, less than in Case I. The natural gas combined cycle has the lowest environmental impact considering its overall efficiency.
In Figure 3, the pulverized coal with subcritical parameters has the lowest environmental impact according to the NO2 and NH3 emissions generated in the combustion stage.
In Figures 4 and 5, the fuels life cycle were compared according to the GWP indicator. It was obvious that the pulverized coal with supra-critical parameters and with CO2 capture unit has generated the smallest CO2 emissions in the environment. The CO2 capture has an efficiency of 90% that permitted the considerable reduction of the CO2 emissions generated in the combustion stage.
Figure 6 shows the environmental effects of the fuels life cycle according to the POCP indicator. It is obvious that the coal life cycle has a bigger impact because a large amount of SO2 and NO2 is generated in the combustion stage. In Case II, for the same functional unit, more
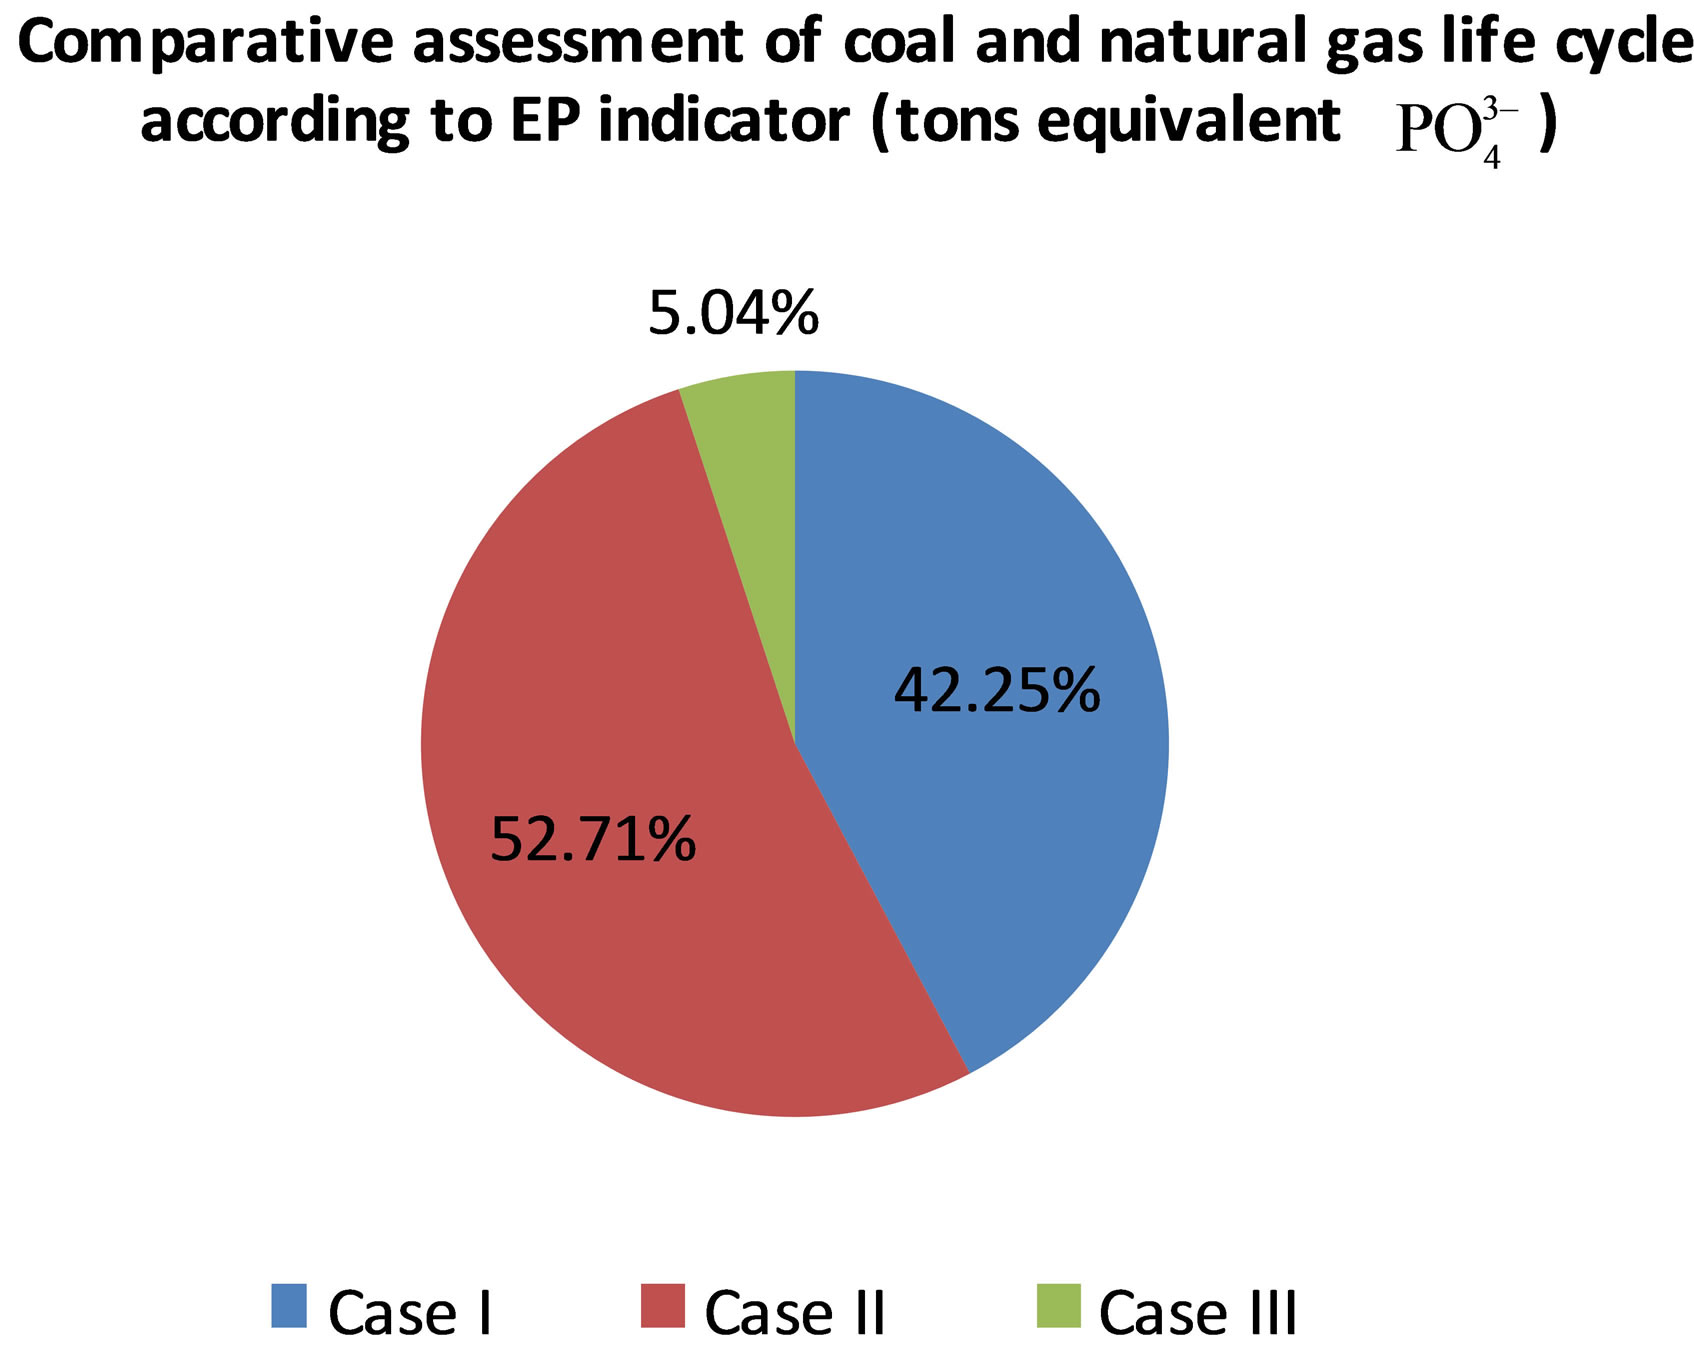
Figure 3. Comparative assessment of coal and natural gas life cycle according to EP indicator.
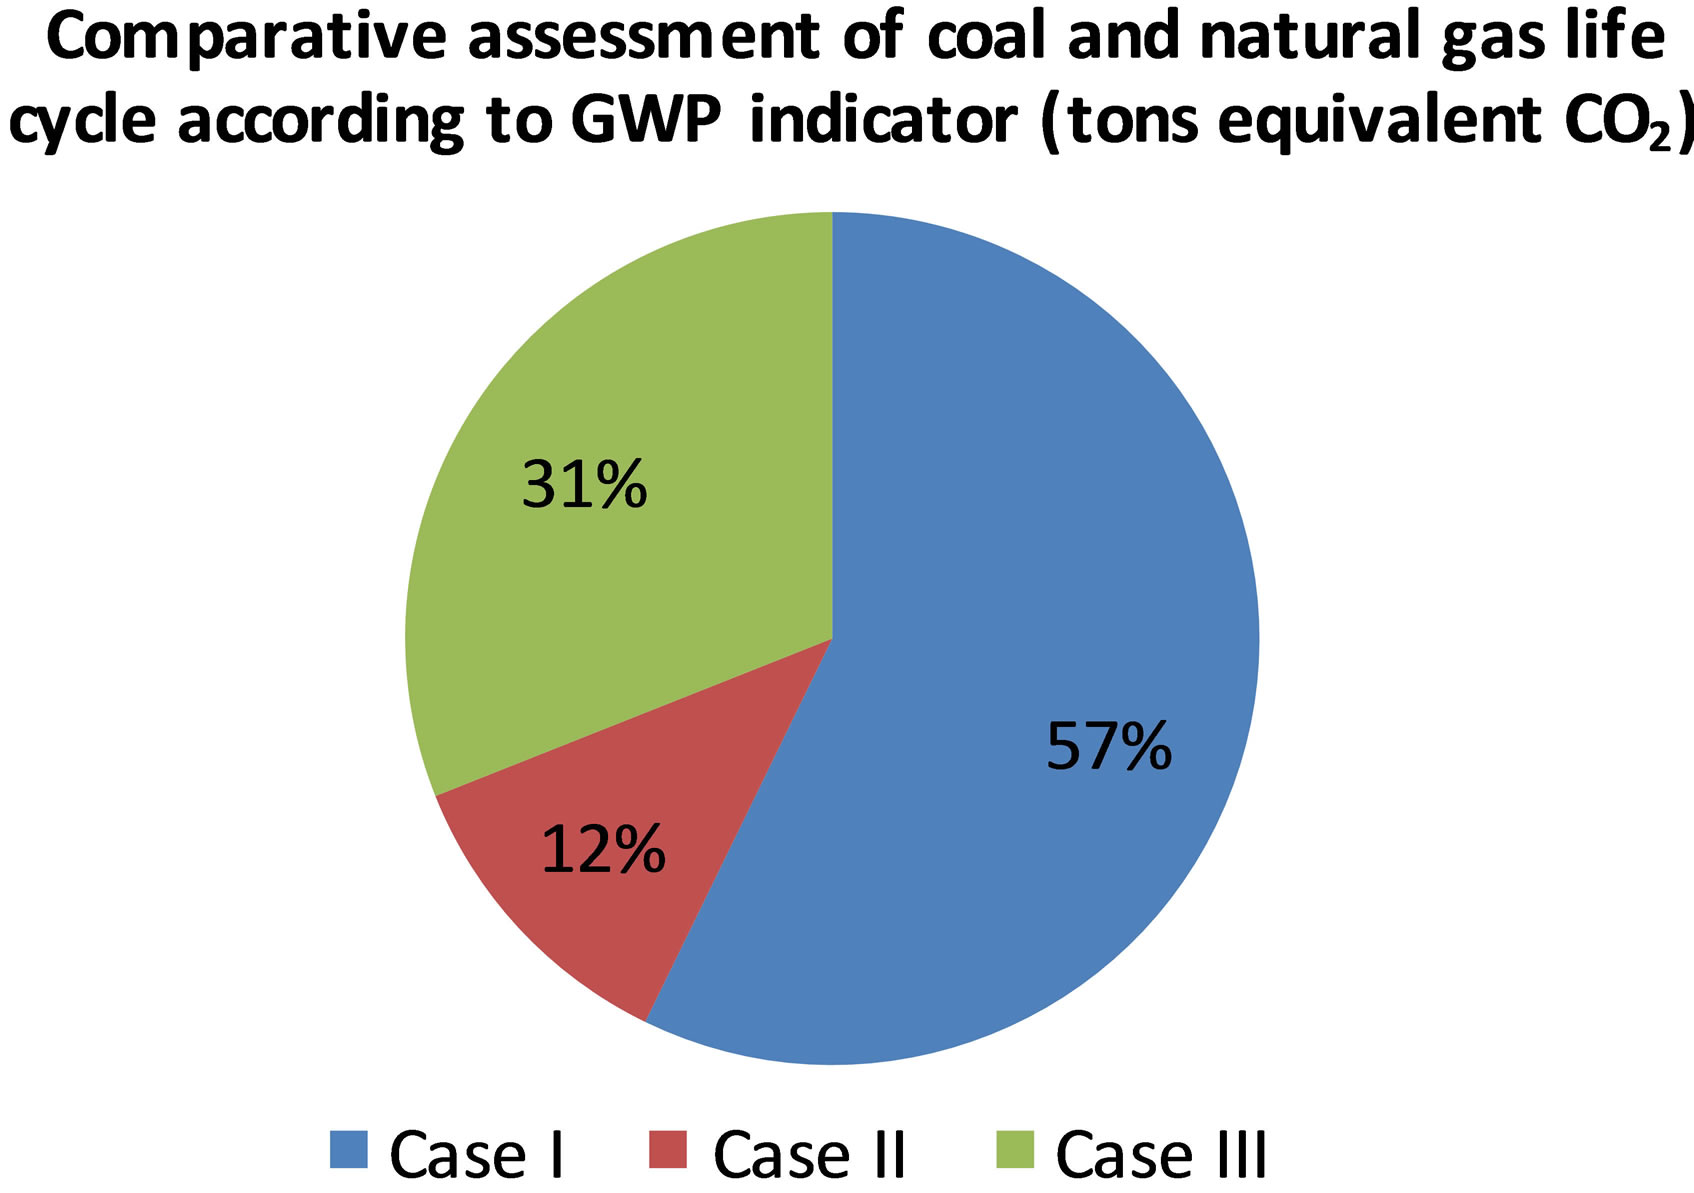
Figure 4. Comparative assessment of coal and natural gas life cycle according to GWP indicator.
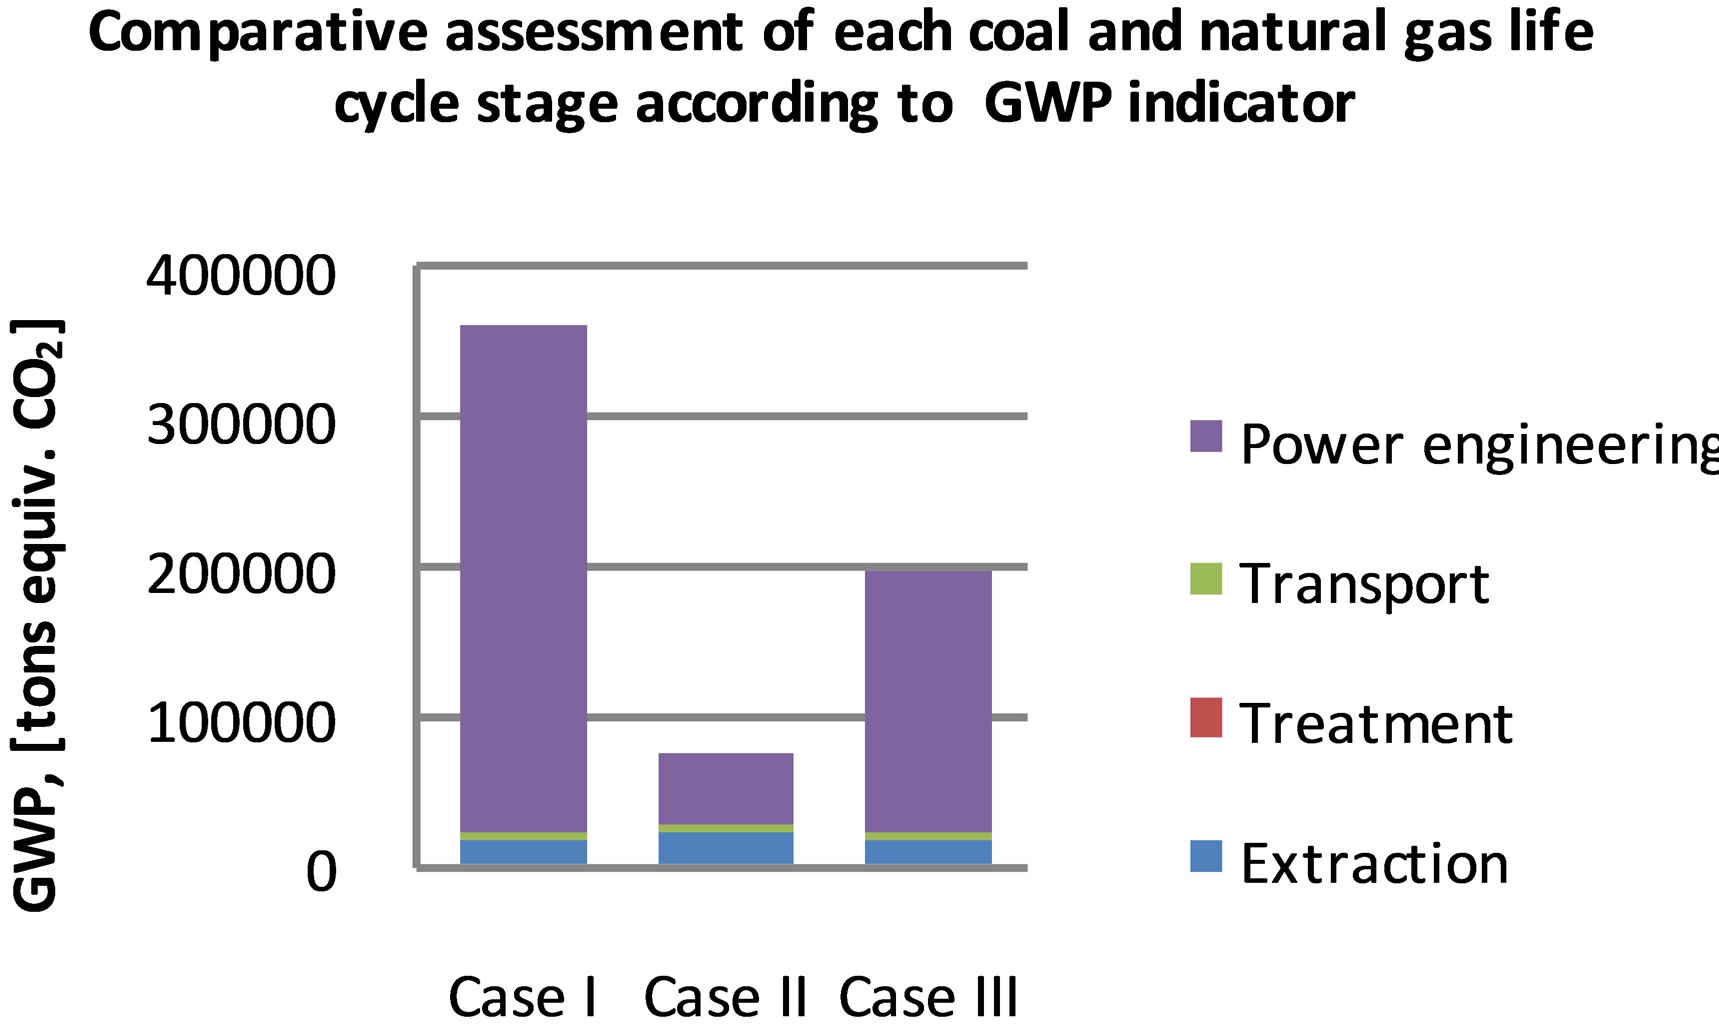
Figure 5. Comparative assessment of each coal and natural gas life cycle stage according to GWP indicator.
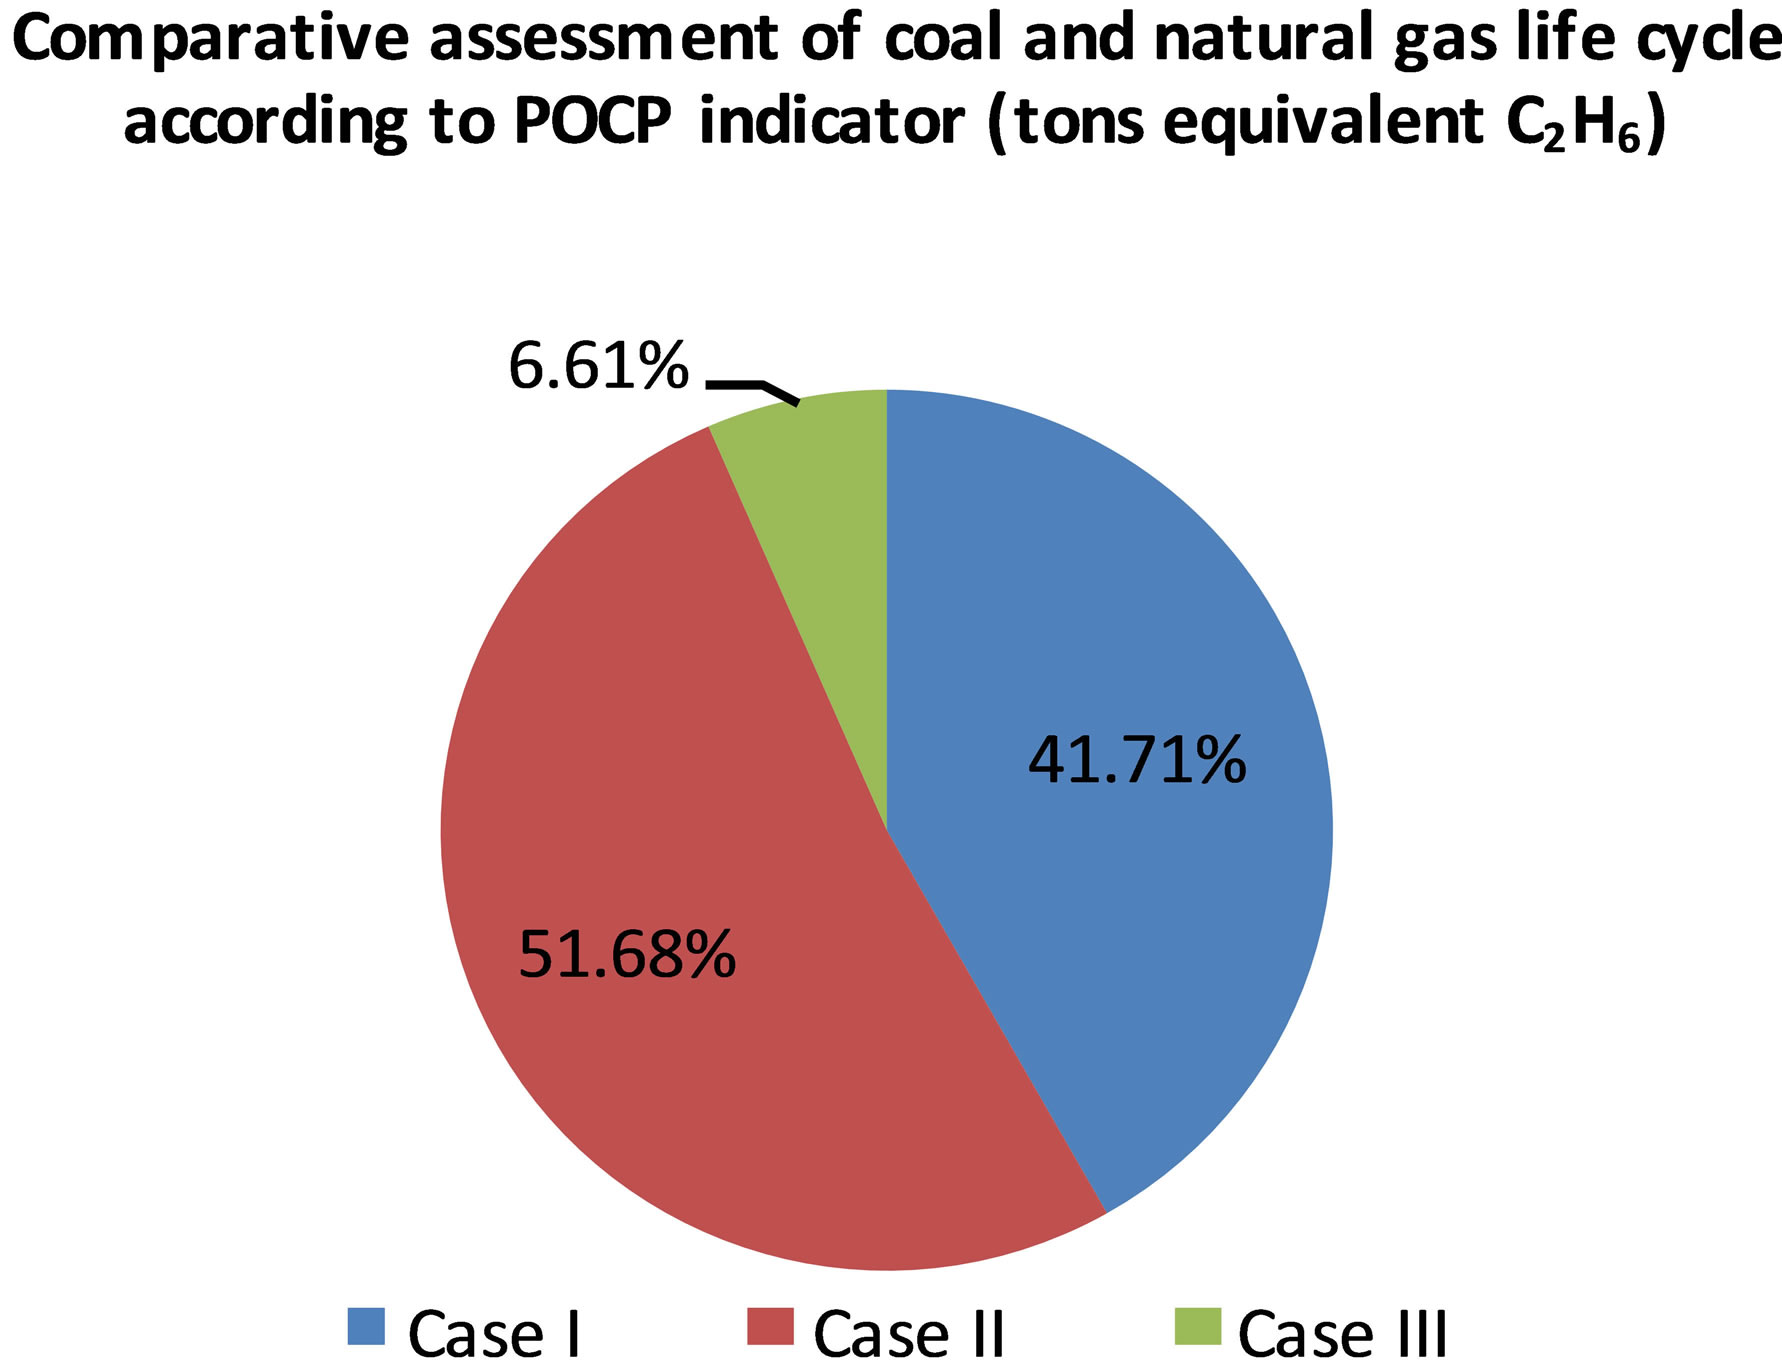
Figure 6. Comparative assessment of coal and natural gas life cycle according to POCP indicator.
coal is necessary and more SO2 and NO2 are generated in the environment.
In Figure 7, the fuels life cycle are compared according to the HTP indicator. The worst pollutant is C6H6 which is generated in the extraction and treatment stagein the case of the natural gas case and in the combustion stage in case of the coal.
In Figure 8, a comparative assessment is provided for the fuels life cycle according to the acidification indicator. More SO2 and NOx are generated in the coal combustion technology in comparison with the natural gas combustion. The natural gas combined cycle has in this case the lowest environmental impact.
4. Conclusions
In this article, the coal and natural gas life cycles were investigated from an environmental point of view in order to identify the environmental eco-systems that would be integrated. In addition, three types of power generation were analyzed: pulverized coal with subcritical parameters, pulverized coal with supra-critical parameters and with CO2 capture unit, and natural gas combined cycle. The objective was to determine if the coal technology provided with the CO2 capture unit has a smaller environmental impact than the natural gas combined cycle. This idea was analyzed only in the climate change environmental impact where the CO2 emissions were considerably reduced in comparison with the initial case (pulverized coal with subcritical parameters). But, in the abiotic depletion case, the pulverized coal with CO2 capture unit has the biggest impact taking into account the penalty on the global efficiency of the decarbonization unit.
Taking into account the whole environmental impact indicators, the natural gas combined cycle has the lowest contribution.


Figure 8. Comparative assessment of coal and natural gas life cycle according to AP indicator.
5. Acknowledgements
The study has been funded by the UEFISCDI within the National Project number 38/2012 with the title: “Technical-economic and environmental optimization of CCS technologies integration in power plants based on solid fossil fuel and renewable energy sources (biomass)”- CARBOTECH.
REFERENCES
- Statistical Review of World Energy BP, 2010. www.bp.com
- E. Tzimas, A. Mercier, C. C. Cormos and S. Peteves, “Trade-Off in Emissions of Acid Gas Pollutants and of Carbon Dioxide from Fossil Fuels Power Plants with Carbon Capture,” Energy Policy, Vol. 35, No. 8, 2007, pp. 3991-3998. http://dx.doi.org/10.1016/j.enpol.2007.01.027
- European Commission, “DG Energy and Transport (TREN), Strategic Energy Review,” 2009. http://ec.europa.eu/energy
- Intergovernmental Panel on Climate Change (IPCC), 4th Assessments Report, Climate Change, 2007. www.ipcc.ch
- European Commission, Strategy on Climate Change: The Way Ahead for 2020 and Beyond, 2007.
- Intergovernmental Panel on Climate Change (IPCC), CO2 “Capture and Storage,” Special Report, 2005. www.ipcc.ch
- C. Dinca and A. Badea, “The Parameters Optimization for a CFBC Pilot Plant Experimental Study of PostCombustion CO2 Capture by Reactive Absorption with MEA,” International Journal of Greenhouse Gas Control, Vol. 12, 2013, pp. 269-279. http://dx.doi.org/10.1016/j.ijggc.2012.11.006
- Dinca, C., A. Badea, et al., “A Multi-Criteria Approach to Evaluate the Natural Gas Energy Systems,” Energy Policy, Vol. 35, No. 11, 2007, pp. 5754-5765. http://dx.doi.org/10.1016/j.enpol.2007.06.024
- C. Dinca, C. C. Cormos and H. Necula, “Environmental Impact Assessment of GHG Emissions Generated by Coal Life Cycle and Solutions for Reducing CO2,” Journal of Environmental Protection, Vol. 4, No. 8A2, 2013, pp. 5-15. http://dx.doi.org/10.4236/jep.2013.48A2002
- C. Dinca, “Environmental Assessment of Energetically Process,” AGIR, 89 p.
- M. A. J. Huijbregts, “Application of Uncertainty and Variability in LCA, Part I—A General Framework for the Analysis of Uncertainty and Variability in Life Cycle Assessment,” The international Journal of Life Cycle Assessment, Vol. 3, No. 5, 1998, pp. 273-280.
- M. A. J. Huijbregts, G. Norris, R. Bretz, A. Ciroth, B. Maurice, B. Von Bahr, B. Weidema, A. S. H. De Beaufort, “Framework for Modeling Data Uncertainty in Life Cycle Inventories,” International Journal of Life Cycle Assessment, Vol. 6, No. 3, 2001, pp. 127-132. http://dx.doi.org/10.1007/BF02978728