Natural Resources
Vol. 3 No. 3 (2012) , Article ID: 23215 , 12 pages DOI:10.4236/nr.2012.33014
Changing Trends of Natural Resources Degradation in Kagera Basin: Case Study of Kagera Sub-Basin, Uganda
![]()
1Department of Biology, Mbarara University, Mbarara, Uganda; 2Institute of Resource Assessment (IRA), University of Dar Es Salaam, Dar es Salaam, Tanzania.
Email: *tolocas@must.ac.ug, *tolocas2000@yahoo.co.uk, amajule@ira.udsm.ac.tz, josephperfect@ira.udsm.ac.tz
Received April 2nd, 2012; revised May 25th, 2012; accepted June 4th, 2012
Keywords: Natural Resources; Degradation; Mapping; Kagera Basin; Uganda
ABSTRACT
In many respects, river basins are extremely convenient natural resources management units and hence calls for an integrated approach in case of transboundary nature. Environmental resources in Kagera basin are under great threat due to demographic factors leading to wide spread environmental degradation. Land degradation and biodiversity loss are central issues in the basin, but the extent and severity of the degradation pressures are not yet clearly illustrated and their implications largely unknown. To date, natural resource mapping in Kagera basin has been based on isolated case studies for specific purposes and not much has been done in mapping resources and classification of resources degradation by remote sensing applications considering the whole basin. In this study, basin-wide mapping approach was adopted and hot spot areas associated with natural resources use in the basin identified and trends over time established. However, this paper presents results from Kagera River sub-basin, Uganda. Mapping exercise was done by using landsat images and aerial photos of Kagera basin covering the years 1984-2002. Overall, bushland in Kagera sub-basin, Uganda increased by 78% and woodland cover showed mere 6% gain; but a 53% decrease in open woodland sub-type and 29% decrease in closed woodland. Significant shift occurred in cultivation with herbaceous crops (mainly banana) from year 1984-2002 moving from east to west of Kagera sub-basin, Uganda representing 167% increase. Area occupied by permanent swamp decreased 31%. Over the same period, land cover change detection matrix indicates main land cover changes include conversion to bushland (59.34%) followed by conversion to grassland (7.29%) and cultivated land (7.16%), with only 24.19% of the land cover remaining unchanged. It is concluded that the observed changes are, a result of human-induced factors and show unsustainable utilization of natural resources as most of the changes make the land susceptible to degradation.
1. Introduction
The Kagera River Basin (KRB) is spread over Burundi, Rwanda, Tanzania and Uganda with a total area of 59,800 km2. The River is the principal contributor of water to Lake Victoria and is considered the remotest headwater of the White Nile. Within the Kagera catchment lies 75% of the land area of Rwanda and 52% of Burundi [1]. The Kagera River (400 km long) is formed by two headstreams, which rise in the East Central African highlands (alt. ca. 2500 m) near the divide with the Congo basin. The Ruvubu rises just north of Lake Tanganyika in Burundi and the Nyabarongo rises in north-west Rwanda. These two main headstreams converge at Rusumo Falls, close to the Rwanda-Tanzania border, from where the Kagera flows north along the border and then abruptly east through the lowland floodplain in Tanzania and Uganda, before entering Lake Victoria (alt. 1145 m) to the south of Sango Bay in Uganda. The Kagera River is estimated to contribute 10% of the outflow from Lake Victoria to the Nile, and is important for sustaining the flow of the Nile [2].
The Kagera basin has a general elevation of 1200 - 1600 m but rises above 2500 m in the west, with peaks reaching 4500 m. Rainfall is less than 1000 mm over most of the eastern half of the basin but rises to over 1800 mm in the west, where most of the runoff is generated. Although the west is partly forested, much of the basin has become intensively cultivated resulting in erosion and river sediment load from the high rainfall areas [1]. The basin vegetation includes a complex of forest and woodland, savannah shrub and grasslands and wetlands, with the majority of the land used for agriculture by farmers and herders. The diverse ecosystems and convergence of lowland (mainly western Guinea-Congolian) and highland (eastern afro-montane) species, provide an array of habitats for multiple species of high global significance [2]. This includes remaining species of mega-fauna in protected areas (and habitats) such as the Akagera National Park, Lake Mburo and the Burigi Game Reserve, as well as the unique tropical biodiversity of the groundwater forests (Minziro, Munene and Rwasina Forest Reserves).
The basin contains natural forests (such as Gishwati, Nyungwe and remnants of previously widespread riverine forest) with endemic plant and animal species (including those used in medicine, for wild foods and agroforestry, such as Ficus toningii, Markhamia luttea and Eritrina abbissinic). Extensive swampy forests and grasslands, with dense tall grasses and papyrus, are important ecological components of the floodplain ecosystem of the Kagera River, providing important water flow regulation and buffering functions [2]. The Kagera basin includes important environmental resources which are now under threat due to encroachment by humans [1]. Land degradation and biodiversity loss are central issues in the basin and therefore to the Project. The extent and severity of the pressures the environmental resources are under illustrate clear inter-linkages among different terrestrial activities with trans-boundary implications for the environment and ultimately for Lake Victoria.
Besides, an estimated 14 million people, almost 40% of the 35 million within the Lake Victoria basin (LVB), live in the Kagera basin. The population density within the Kagera basin is very dense averaging 227 persons/km2, 30% higher than the 174 persons/km2 in the rest of the LVB. The population in the countries is growing at a rapid pace, 2.2% per year in Burundi and Rwanda, 3.1% per year in Tanzania and Uganda. In Burundi, 46% are under 15 years of age. In Uganda and Tanzania, some 80% of the population is rural and the majority engaged in small-scale agriculture. In Rwanda and Burundi over 90% of the populations are engaged in subsistence farming, with extremely small farms and fragmented plots (the mean area is 0.6 ha; only 2% of holdings exceed 3 ha). Moreover, due to rural-urban migration, urban growth is significant, averaging over 4% growth/year in the largest cities, Kigali (650,000 persons), Bukoba (180,000 persons) and Mbarara (69,360 persons). The majority of the rural populations in the basin are very poor (few tools, poor housing, small land area, little disposable income); they are unable to invest in improved resources management or education. The basin supports one of the densest and poorest rural populations in the world. It is thus the most heavily populated basin within the East African rift valley lakes sub-region. It is multiethnic, comprising communities from Kenya, Uganda, Tanzania, Burundi, and Rwanda. The population of the region is expected to double within the next two decades.
On the other hand, several studies have been done in the Kagera basin, but no single study has clearly linked demographic factors with natural resources degradation [3-6]. Moreover, most of studies in the Kagera basin have been based on country specific or project driven interests based either on a particular area or just limited to one and only one sub-catchment in a specific country. However, for sustainable management of transboundary natural resources in Kagera basin, the entire basin needs to be clearly studied by mapping different ecological units, identifying key or hot spot areas in terms of patterns of resource use and degradation and then critically assessing their status. Linking ecological status of natural resources and social factors for degradation will assist in coming up with opportunities and challenges for sustainable use of resources in the basin. Furthermore, generating information on trends and patterns of resource degradation in the basin over time series through mapping will enable researchers to link such patterns with other factors controlling resource degradation in the basin. Such information at the moment is lacking and this project seeks to fill this gap. The objective of this study therefore was to map ecological status of natural resources in the selected sites in the Kagera basin. The study was guided by the following two research questions: 1) what is the ecological status of natural resources in the selected sites in the Kagera basin? and 2) where are the hot spot areas associated with natural resource degradation in the Kagera basin?
2. Materials and Methods
2.1. Study Area
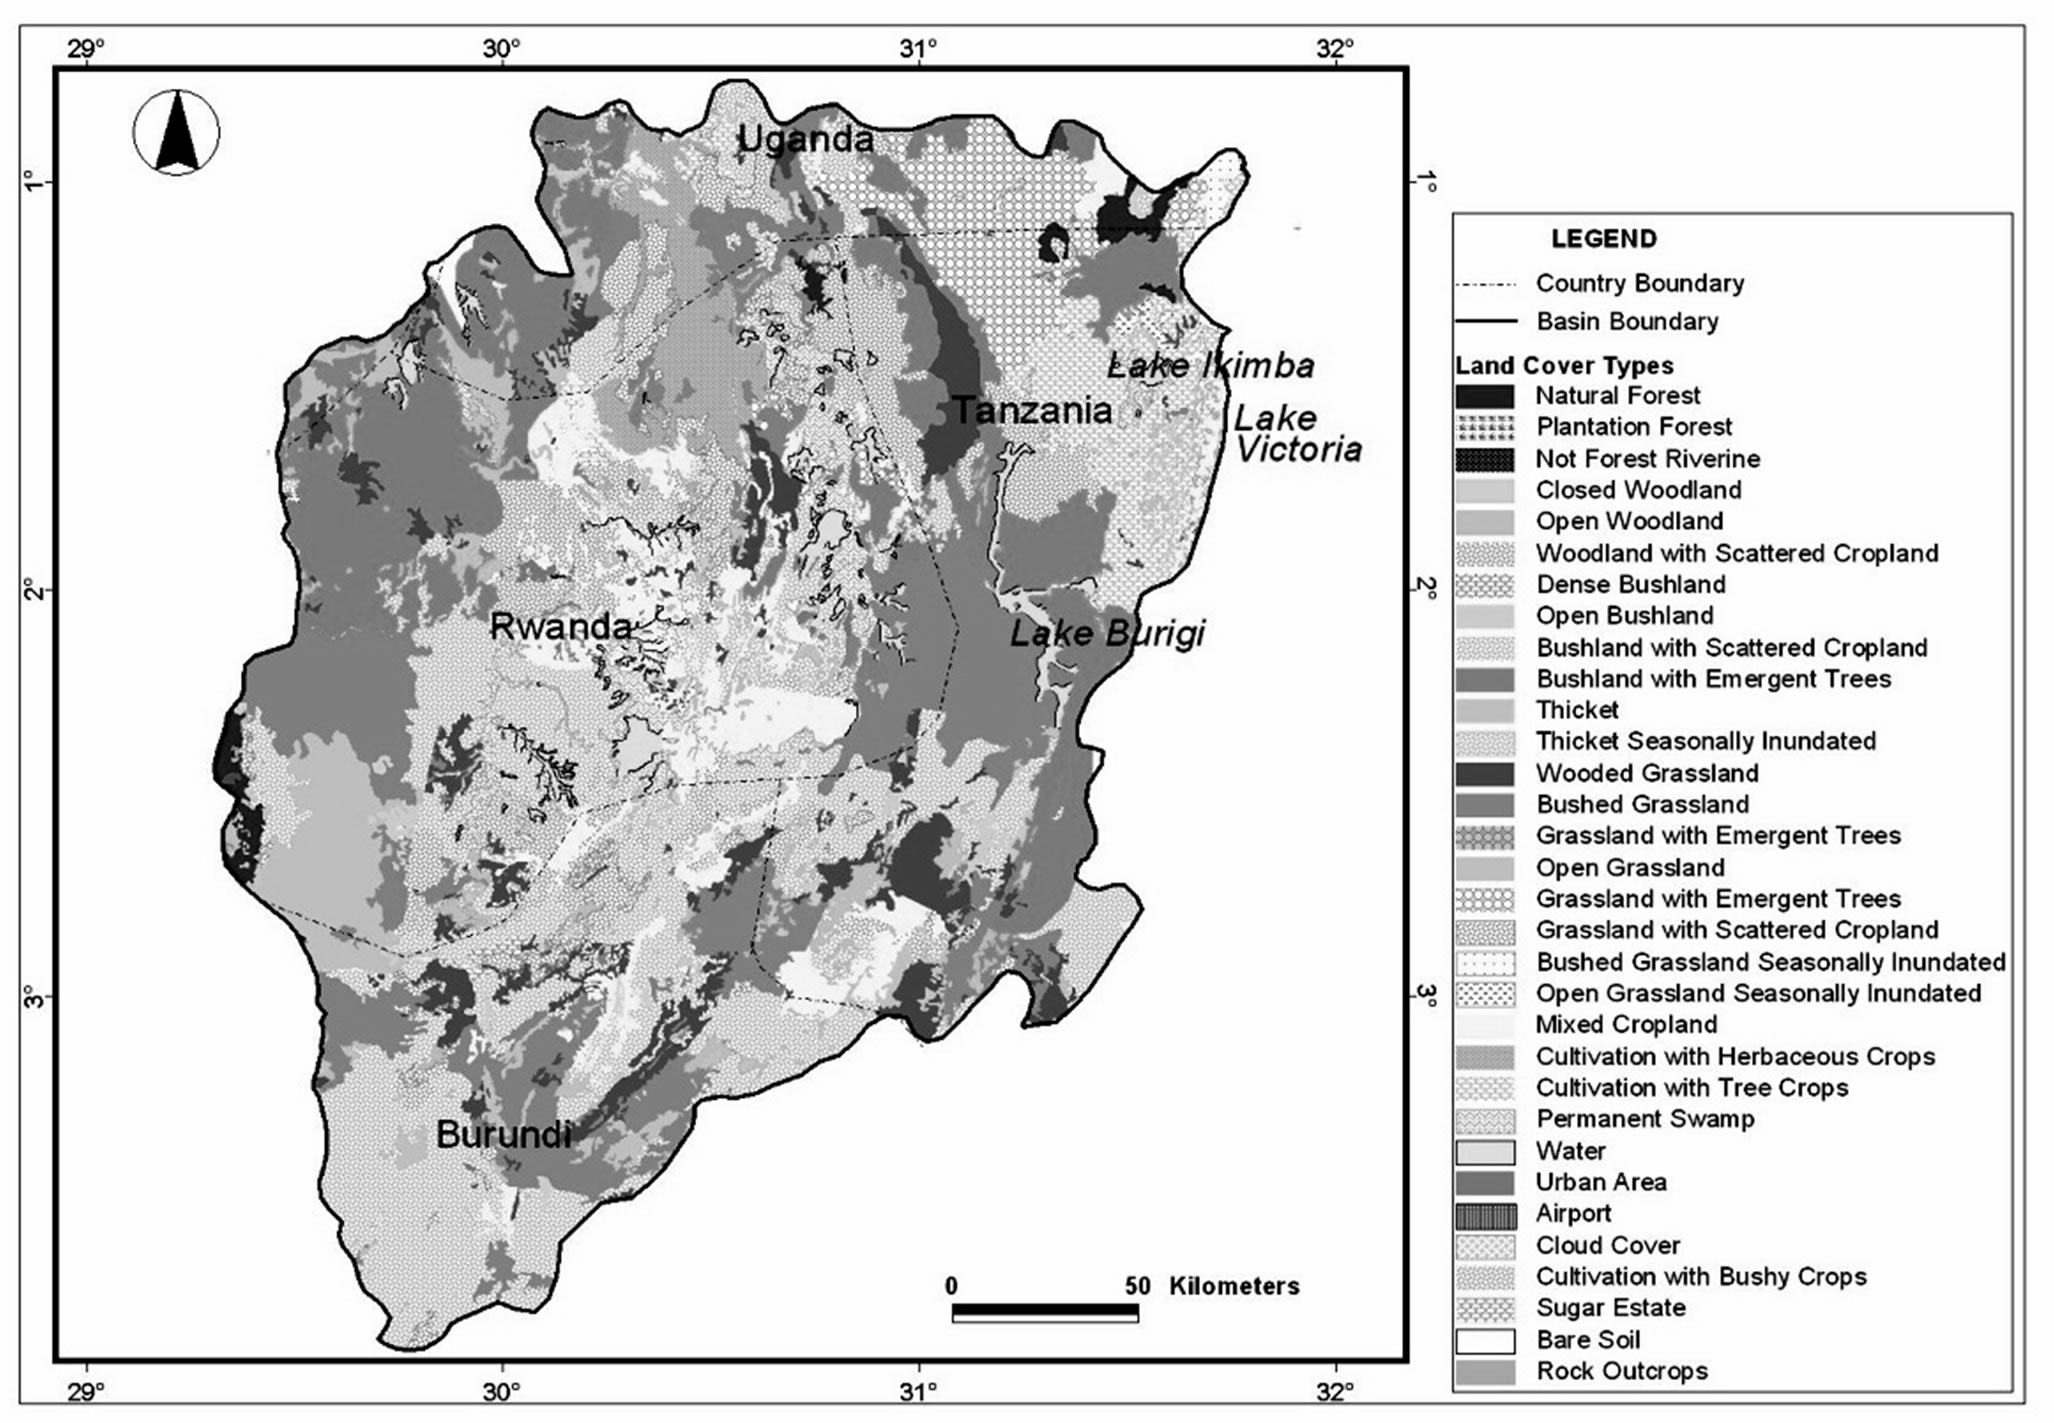
This study was conducted in the entire basin of Kagera (Figure 1). The Basin is located in the Great Lakes Region of Africa, and it covers an area between the immense Lakes of Victoria, Tanganyika and Kivu. The river basin lies between 0˚45' and 3˚35' south latitude and 29˚15' and 30˚51' longitude east [4]. The Kagera watershed occupies two major topographical zones namely the West Rift Scarp and the Lake Victoria Basin that derives largely from regional features of the geological structure [6]. The West Rift zone Scarp encompasses the terrain on the eastern side of the West Rift that was involved in the up-warping and associated volcanism during the development of the rift. It rises to elevations of 2600 metres in Burundi and 3000 metres in Rwanda both located on the Congo-Nile Divide that forms the western boundary of the Kagera Basin. The Kagera River flows in north and east, forming part of Tanzania’s borders with Rwanda and Uganda, before emptying into Lake Victoria and is commonly regarded as the remotest source of the White Nile. The most southern headwaters of Kagera River are located at Rutovu in southern Burundi.
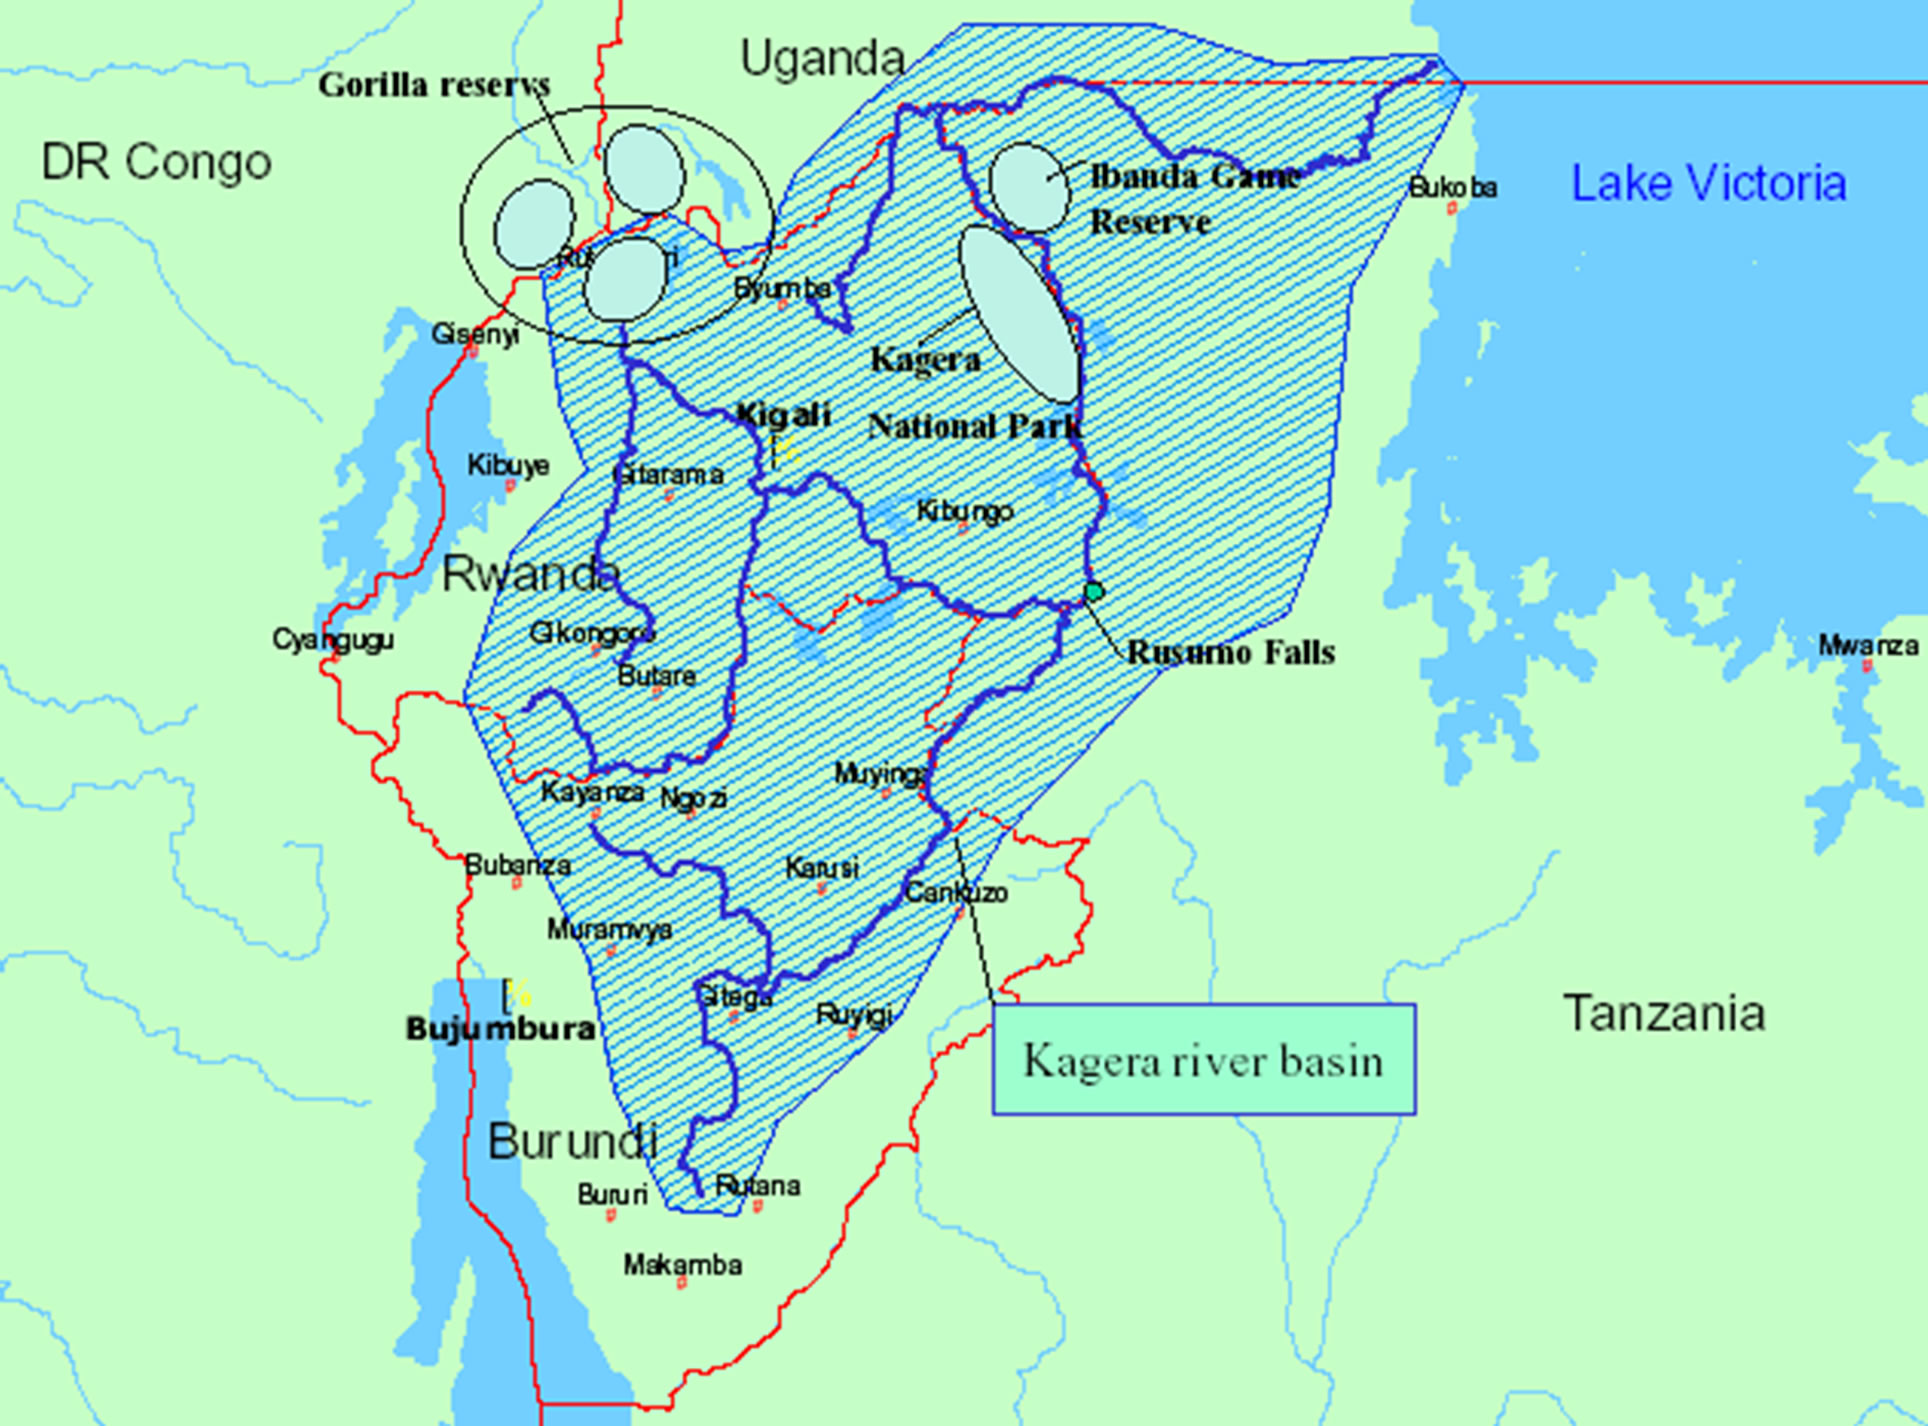
Figure 1. Geo-location of Kagera basin.
2.1.1. Field Work Activities
The field work activities aimed at mainly production of resource/ecological maps of Kagera basin and establishing patterns and trends of resources in the Basin using different remote sensing techniques including GIS. A number of technical activities and methodological approaches were used to generate the final map and some of these activities include.
2.1.2. Pre-Field Work Activities
This entailed the following: 1) studying the existing data in all participating countries by team members in respecttive study areas of the Kagera basin within each country; 2) planning of the field work; and 3) executing the field work itself, at Kagera sub-basin level by each research scientist.
2.1.3. Reconnaissance Survey
Here the approach used was, each research scientist did individual field visits in his respective sub-basin during field reconnaissance. The mission during this time was to get acquainted with the study area/sites and also later get to introduce the project to key stakeholders; get prior information about the study sites; inform local administration and leaders about the objectives of the intended study (for the case of Uganda, these were mainly Local Council Executives, Community leaders and other relevant authorities found on ground); Make logistical arrangements e.g. when to do Participatory GIS (PGIS) and collection of any relevant data available to be used for mapping of ecological units and resources in the subbasin.
2.1.4. Mapping of Resources
The mapping exercise was mainly a laboratory work which was done in close collaboration with experienced GIS expert based on Institute of Resource Assessment (IRA), University of Dar es salaam (UDSM). For uniformity purposes and issue of consistency in terms of tools of analysis, however, it was considered prudent that rather than undertaking mapping and analysis of ecological and natural resources trends in the basin by individual countries, mapping should be done for the entire Kagera basin, covering the four Kagera River riparian states of Burundi, Rwanda, Tanzania and Uganda. Individual research scientists later analyzed data and produced country specific Kagera sub-basin reports for each country. Technical aspects of the mapping exercise such as image manipulation and interpretation were carefully handled with the help of the experienced GIS expert from IRA, GIS laboratory. The mapping of the Kagera basin used the Landsat images and aerial photos which cover the Kagera Basin. Mapping was done mainly by landsat images. Aerial photos were used for feature identification in areas where landsat images were not showing the features very well due to their low resolutions.
2.1.5. Field Verification/Ground Truthing
After the entire Kagera basin was preliminarily mapped, we (the research scientists) went into the field (on country basis and at sub-basin level!) to do ground truthing. This involved visiting of identified ecological units and hot spot areas identified in terms of resource degradation, for example deforested, eroded, and extensively cultivated areas and other similar areas. The visits also provided clues to researchers on whether demographic factors have contributed significantly to changing patterns on resource use and degradation or a combination of factors in the Kagera basin. Afterwards, inputs from ground truthing were added to the final mapping of the Kagera basin. This was followed by each research scientist producing country specific, mapped trends of natural resources degradation in Kagera sub-basin final report, the results of which are presented here in this paper for the case of Uganda.
2.1.6. Data Analysis of Satellite Imagery
The simulation of the images were assigned with the false color of RGB composite as Layer 4—Red, Layer 5—Green, and Layer 3—Blue; and also for other scene Layers, Blue was used. The scale which was used ranges from 1:260,000 to 1:100,000. The simulation was done on the printing of the image for the inter-forestation which was done manually or visually. The images were then printed for interpretation. The identification of the classification was done in reference to the criteria for land cover discrimination, where forest and woodland are identified by reddish colour with different intensities while the bushland is identified by pinkish to brown with different intensities to thicket. Grassland is identified by the blue-green to pink with variable blue-green varying from wooded grassland to open grassland etc. Open land is identified by pale blue, green to white from bare soil to ice-cap/snow waiter features identified by black to bluish and bright red which swamp/marsh with different intensities. The identification of roads is done by linear and pale strip or dark depending bitumined or unbitumined or soil surface road.
Similarly, in this study, land cover change matrix and changed areas were also determined by change detection, which is one of the most important applications of remote sensing techniques. Change detection has capability of repetitive acquisition of imageries with consistent image quality, at short intervals, on a global scale, and during complete seasonal cycles. This study used two Landsat scenes from different sensors (Landsat TM, and Landsat ETM) images acquired in 1984 and 2002 respectively to detect change of Kagera Basin Land Cover. The land cover change detection was done using ArcGIS10 software. The two classified land cover layers i.e. land cover 1984 and 2002 were used. Two analysis tools Extract and Overlay were used to determine the land cover change matrix and changed areas respectively. The clip function was used to determine change of individual land cover class from year 1984 to 2002. The clip function extracts land cover classes from year 2002 features that overlay the selected land cover class from land cover layer 1984. The overlay tool (union) was used to combine attributes from the two land cover layers and determine which areas changed from one cover to another and the areas not changed. The union tool computes a geometric intersection of the land cover features from 1984 and 2002 layers. All features were then written to the Output Feature Class with the attributes from the Input Features, which it overlaps. Finally the select by attribute function was used to select the land cover classes from both layers to determine the change.
3. Results and Discussion
This section of the paper, presents mapping results of Kagera river basin, which was aimed at identifying hotspots of natural resources use and degradation and establish trends in natural resources status. Two landuse/cover types for the Kagera basin has been produced and used to establish changes between 1984 and 2002 periods. A total of 8 major landuse/cover types have been identified in Kagera basin, which are 1) Urban areas; 2) Forest; 3) Water bodies or features; 4) Woodlands of different types; 5) Cultivated land with different crops; 6) Bushland of different types; 7) Grass land of different types and 8) Open land.
The overall trends in the mapped natural resources of the whole Kagera basin are shown in Table 1. There is 36% increase (from 25,859 ha to 35,100 ha) of area occupied by closed woodland which is a gain of 9241 ha. The areas occupied by open woodland have decreased by –52% (from 317,800 ha to 152,000 ha) which is a loss of 165,800 ha. Area occupied by woodland with scattered cropland has shown a remarkable gain of +497733% (from 92 ha to 458,006 ha) representing an increase of 457,914 ha. Dense bushland has decreased by –38% (from 17,566 ha to 10,849 ha) which is a loss of 6717 ha. Area occupied by bushlands with emergent trees has increased by +102% (from 424,550 ha to 857,334 ha) which is a gain of 432,784 ha. Bushland with scattered croplands has increased by +37% (from 894,978 ha to 1,227,775 ha) which is a gain of 332,797 ha. Area occupied by wooded grassland has decreased by –38% (from 626,215 ha to 389,540 ha) which is a loss of 236,675 ha; and open grassland decreased by –77%. Area occupied by grassland with scattered cropland has decreased by –24% (from 275,376 ha to 209,686 ha) which is a loss of 65,690 ha. Overall, area under forest shows slight gain (+5%) from 60,383 ha to 63,530 ha a gain of 3147 ha.

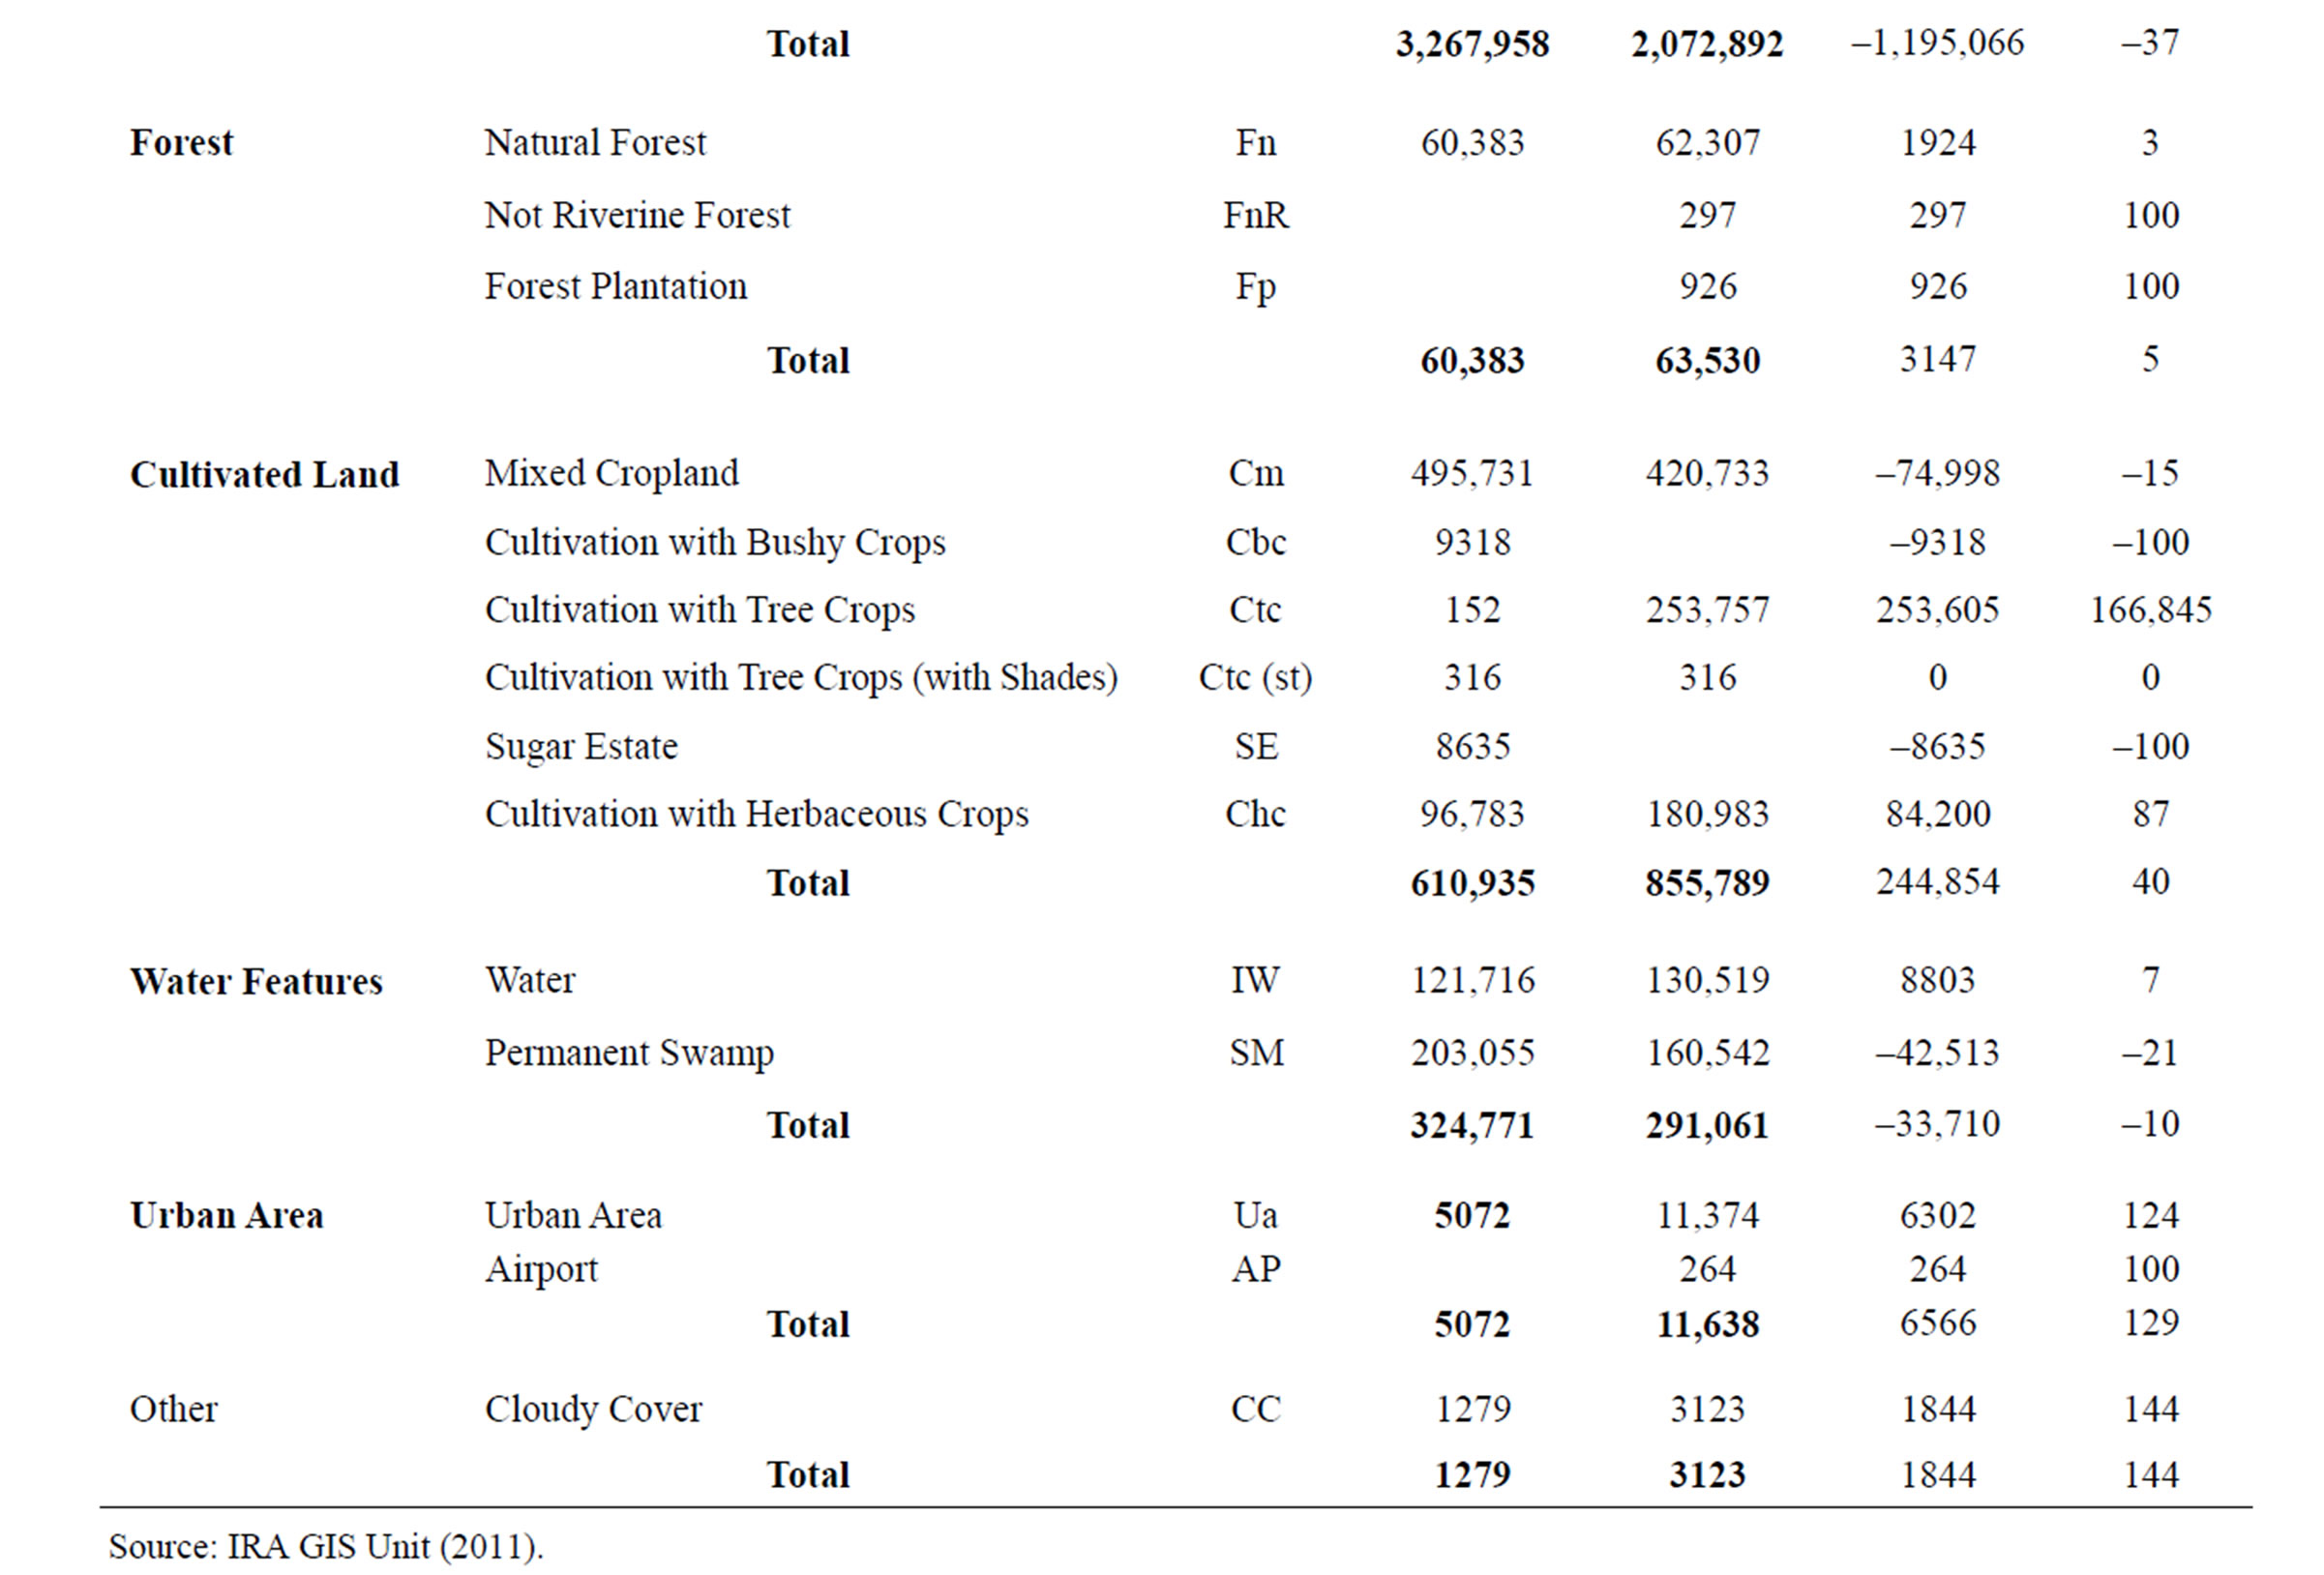
Table 1. Overall Kagera basin land cover change from the year 1984-2002.
Overall, there is +40% gain in the total cultivated land (from 610,935 ha to 855,789 ha) which is a gain of 244,854 ha. Within the cultivated land, there is a remarkable +166845% increase of cultivation with tree crops (from 152 ha to 253,757 ha), which is a gain of 253,605 ha. However, cultivation with bushy crops and Sugar Estate all disappeared (–100%) from the basin representing complete loss of the two in the cover types.
Cultivation with herbaceous crops increased by +87% (from 96,783 ha to 180,983 ha) which is an increase of 84,200 ha. Area occupied by water features in the basin has decreased by –10% (from 324,771 ha to 291,061 ha), which is a loss of 33,710 ha. Within the water features, the permanent swamp has undergone –21% decrease (from 203,055 ha to 160,542 ha) which is a loss of 42,513 ha. Last but not least, there is an increase of +129% in urban areas from 5072 ha to 11,638, which is an increase of 6566 ha.
3.1. Kagera Sub-Basin, Uganda
The trends in the status of natural resources in Kagera sub-basin, Uganda are shown in Table 2. The woodlands

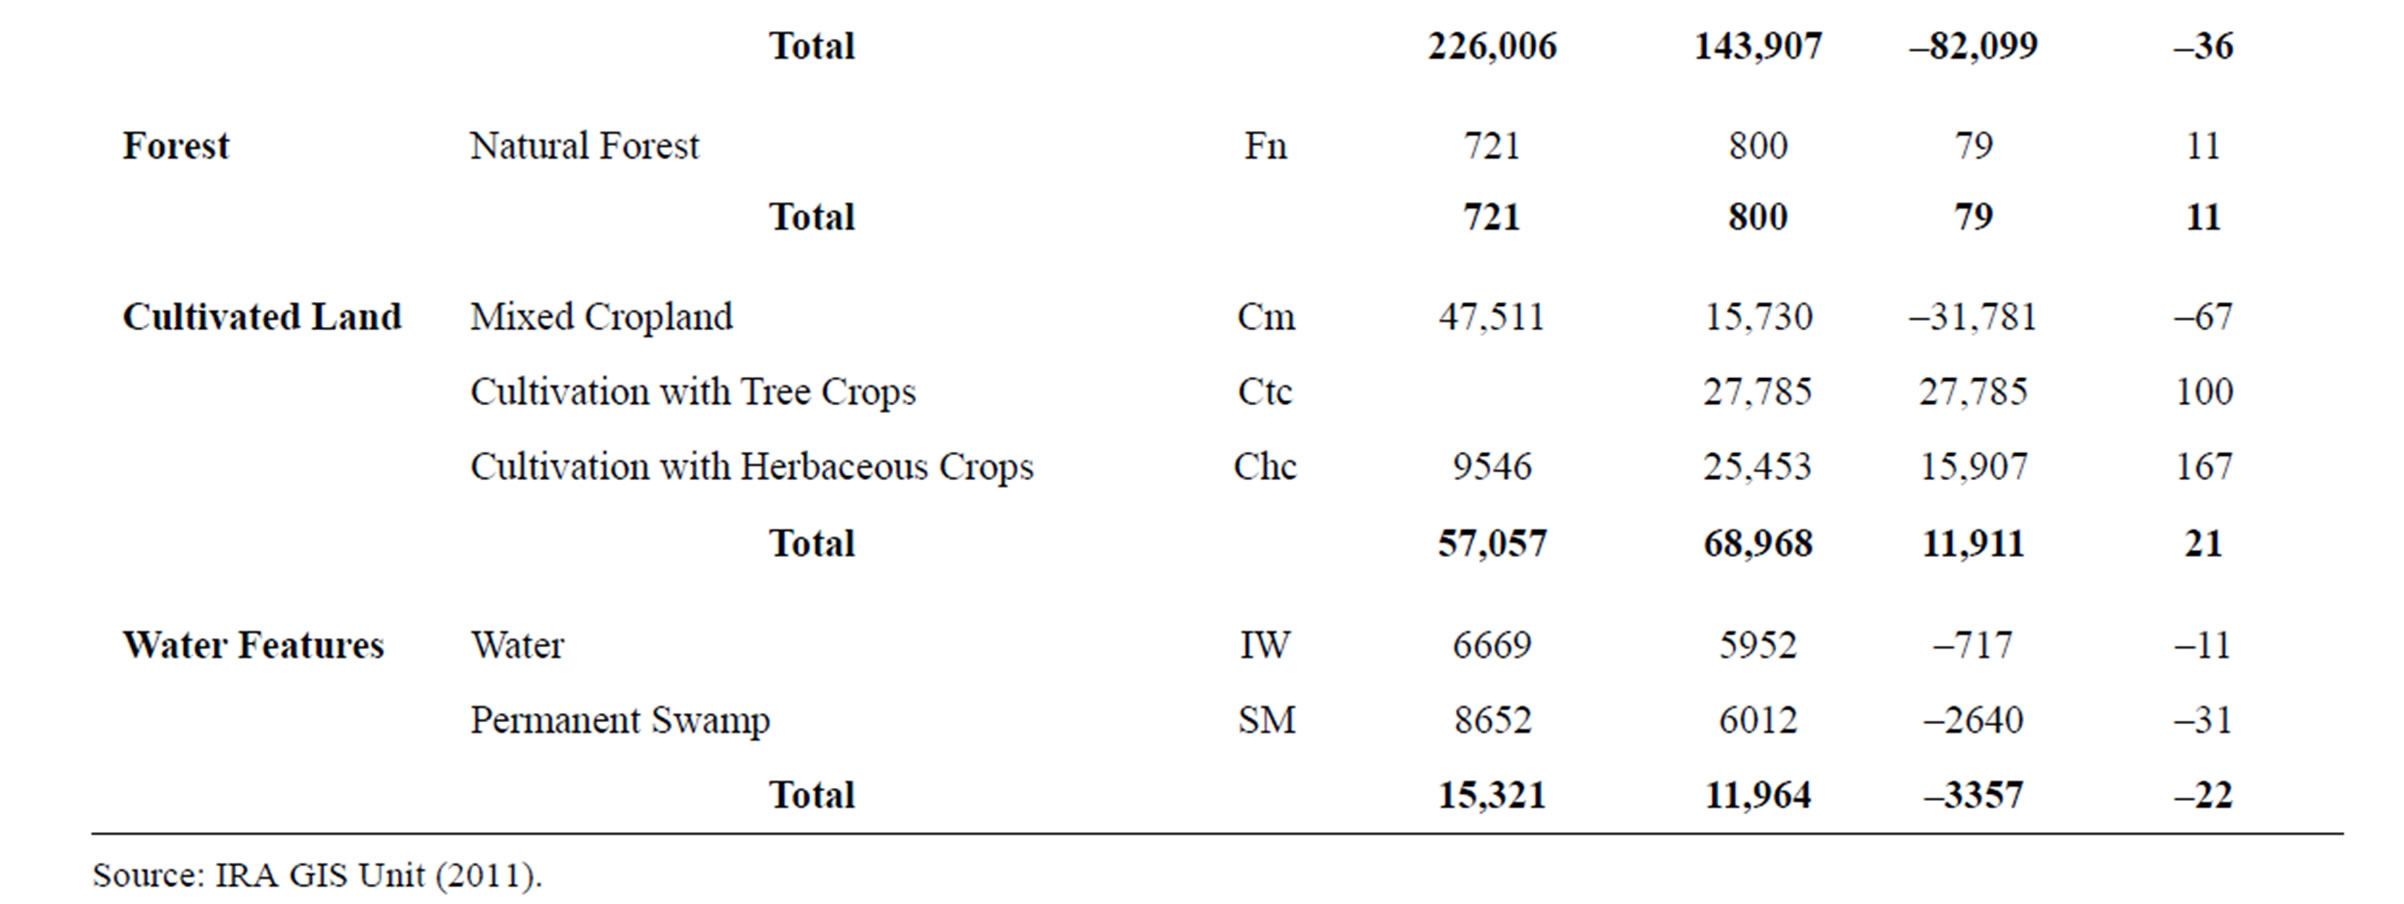
Table 2. The land cover changes in Kagera sub-basin, Uganda from the year 1984-2002.
in Kagera sub-basin, Uganda have shown decimal increase of +6% (from 8868 ha to 9356 ha) which is a gain of 488ha. Regarding the woodland sub-type, there is a –29% decrease in closed woodland (from 1873 ha to 1334ha) which is a loss of 539 ha. Area under open woodland decreased by –53% (from 6995 ha to 3283 ha) which is a loss of 3712 ha. The woodland with scattered cropland has increased from 0 ha to 4739 ha which is 100% gain. On the other hand, the dense bushlands have disappeared by 100% in the same period. There is a striking +922% increase of area occupied by bushland with emergent trees (from 12,694 ha to 129,692 ha, which is a gain of 116998 ha. There is a little gain (11%) of natural forests from 721 ha to 800 ha, representing a net gain of 79 ha covered under natural forest in the same period.
There is a remarkable increase of +21% in cultivated area (from 57,057 ha to 68,968 ha, this represent a gain of 11,911 ha. Within the cultivated area, cultivation with tree crops have gained by +100%. Cultivation with herbaceous crops have gained by +167% (from 9546 ha to 25,453 ha, which is the gain of 15,907 ha, a similar trend reported in earlier study on bananas in Uganda [7]. The area occupied by water features, have decreased by –22% (from 15,321 ha to 11,964 ha), which is a loss of 3357 ha; and permanent swamp decreased in the area by –31% (from 8652 ha to 6012 ha) representing a loss of 2640 ha. This is mainly due to swamp reclamation for agricultural purposes; with dire consequences of frequent flood, increased lake and river sedimentations and low water purification potential of the swamps.
Major noticeable change around Sango Bay from year 1984 to year 2002, includes patches of Closed Woodland around it has been replaced by Grassland with Emergent Trees and Bushland with Scattered Cropland. This probably could be attributed to encroachment on the closed woodland by the local communities in search for productive farm land (Compare 1984 to 2002 GIS map for the basin). Generally, from 1984 to 2002, Bushland with Emergent Trees increased in the Kagera sub-basin, Uganda. Significant increase of Bushland with Emergent Trees is observed in the western part of the Kagera sub-basin (western side of Isingiro district and parts of Ntungamo district) where it has mainly replaced Bushland with Scattered Cropland. However, it has also been replaced from its original position in Isingiro and Rakai districts by Grassland with Emergent Trees in the same years from 1984 to year 2002.
From the 1984 to 2002, Wooded Grasslands were replaced by mainly Cultivation with Herbaceous Crops (mainly banana). This is true especially in the study areas around Kikagati and Kabuyanda sub-counties (Isingiro county South) and Bukanga County all in Isingiro district. This may have dire consequence as Isingiro is mainly characterised by steep and bare hills and the ecological system here is normally prone to chronic drought and soil erosion. Significant shift occurred in Cultivation with Herbaceous Crops (mainly banana) in 1984 in the east of the Kagera sub-basin close to Lake Victoria near Sango Bay in Rakai district to far western side of the sub-basin to the areas of Isingiro district and parts of Ntungamo district as observed in 2002 Kagera basin land use/cover type; and this finding is in agreement with earlier study [7]. Apparently, this seems to have displaced Bushland with Scattered Croplands (mainly cereals); and wooded Grassland in those areas in the same periods cited above.
Also in 1984, Wooded Grassland; Dense Bushland; and Permanent Swamp were dominant in the eastern side of the basin near Sango Bay (Natural Forest), located close to Lake Victoria Rakai district. However, images observed in 2002, indicate that these land covers/types are being replaced mainly by Bushed Grassland Seasonally Inundated and to some extent Bushland with Scattered Cropland in the sub-basin Kagera basin.
3.2. Kagera Sub-Basin, Uganda Change Detection Matrix from the Year 1984-2002
Land cover change detection matrix for Kagera sub-basin Uganda indicates that the main land cover changes entail conversion to bushland (59.34%) followed by conversion to grassland (7.29%) and cultivated land (7.16%), with only 24.19% of the land cover remaining unchanged. Most noticeable change types include; conversion from grassland to bushland, representing 55.32% conversion. Others include conversion from bushland to grassland (4.02%), bushland to cultivated land (4.92%), cultivated land to bushland (2.90%), cultivated land to grassland (2.17%) as illustrated in Table 3. For the entire Kagera basin, the main land cover change entails conversion to bushland (1,627,441 ha; 25.32%), followed by conversion to grassland (785,322 ha; 12%), followed by conversion to cultivated land (643,006 ha; 10%), with (2,367,690 ha; 36%) of the land cover remaining unchanged (Table 4).
4. Conclusion
The land cover changes in Kagera sub-basin, Uganda show diminishing areas occupied by closed woodland, open woodlands and dense bushlands. Besides, cultivated areas have increased significantly especially cultivation with tree crops and cultivation with herbaceous crops. There is also significant increase in area occupied by woodland with scattered croplands. The areas occupied by water features, have also decreased just like the areas occupied by permanent swamp show significant loss over the same period. Similarly, detection matrix for Kagera sub-basin Uganda indicates conversion to bushland, to grassland and to cultivated land are the major forms of
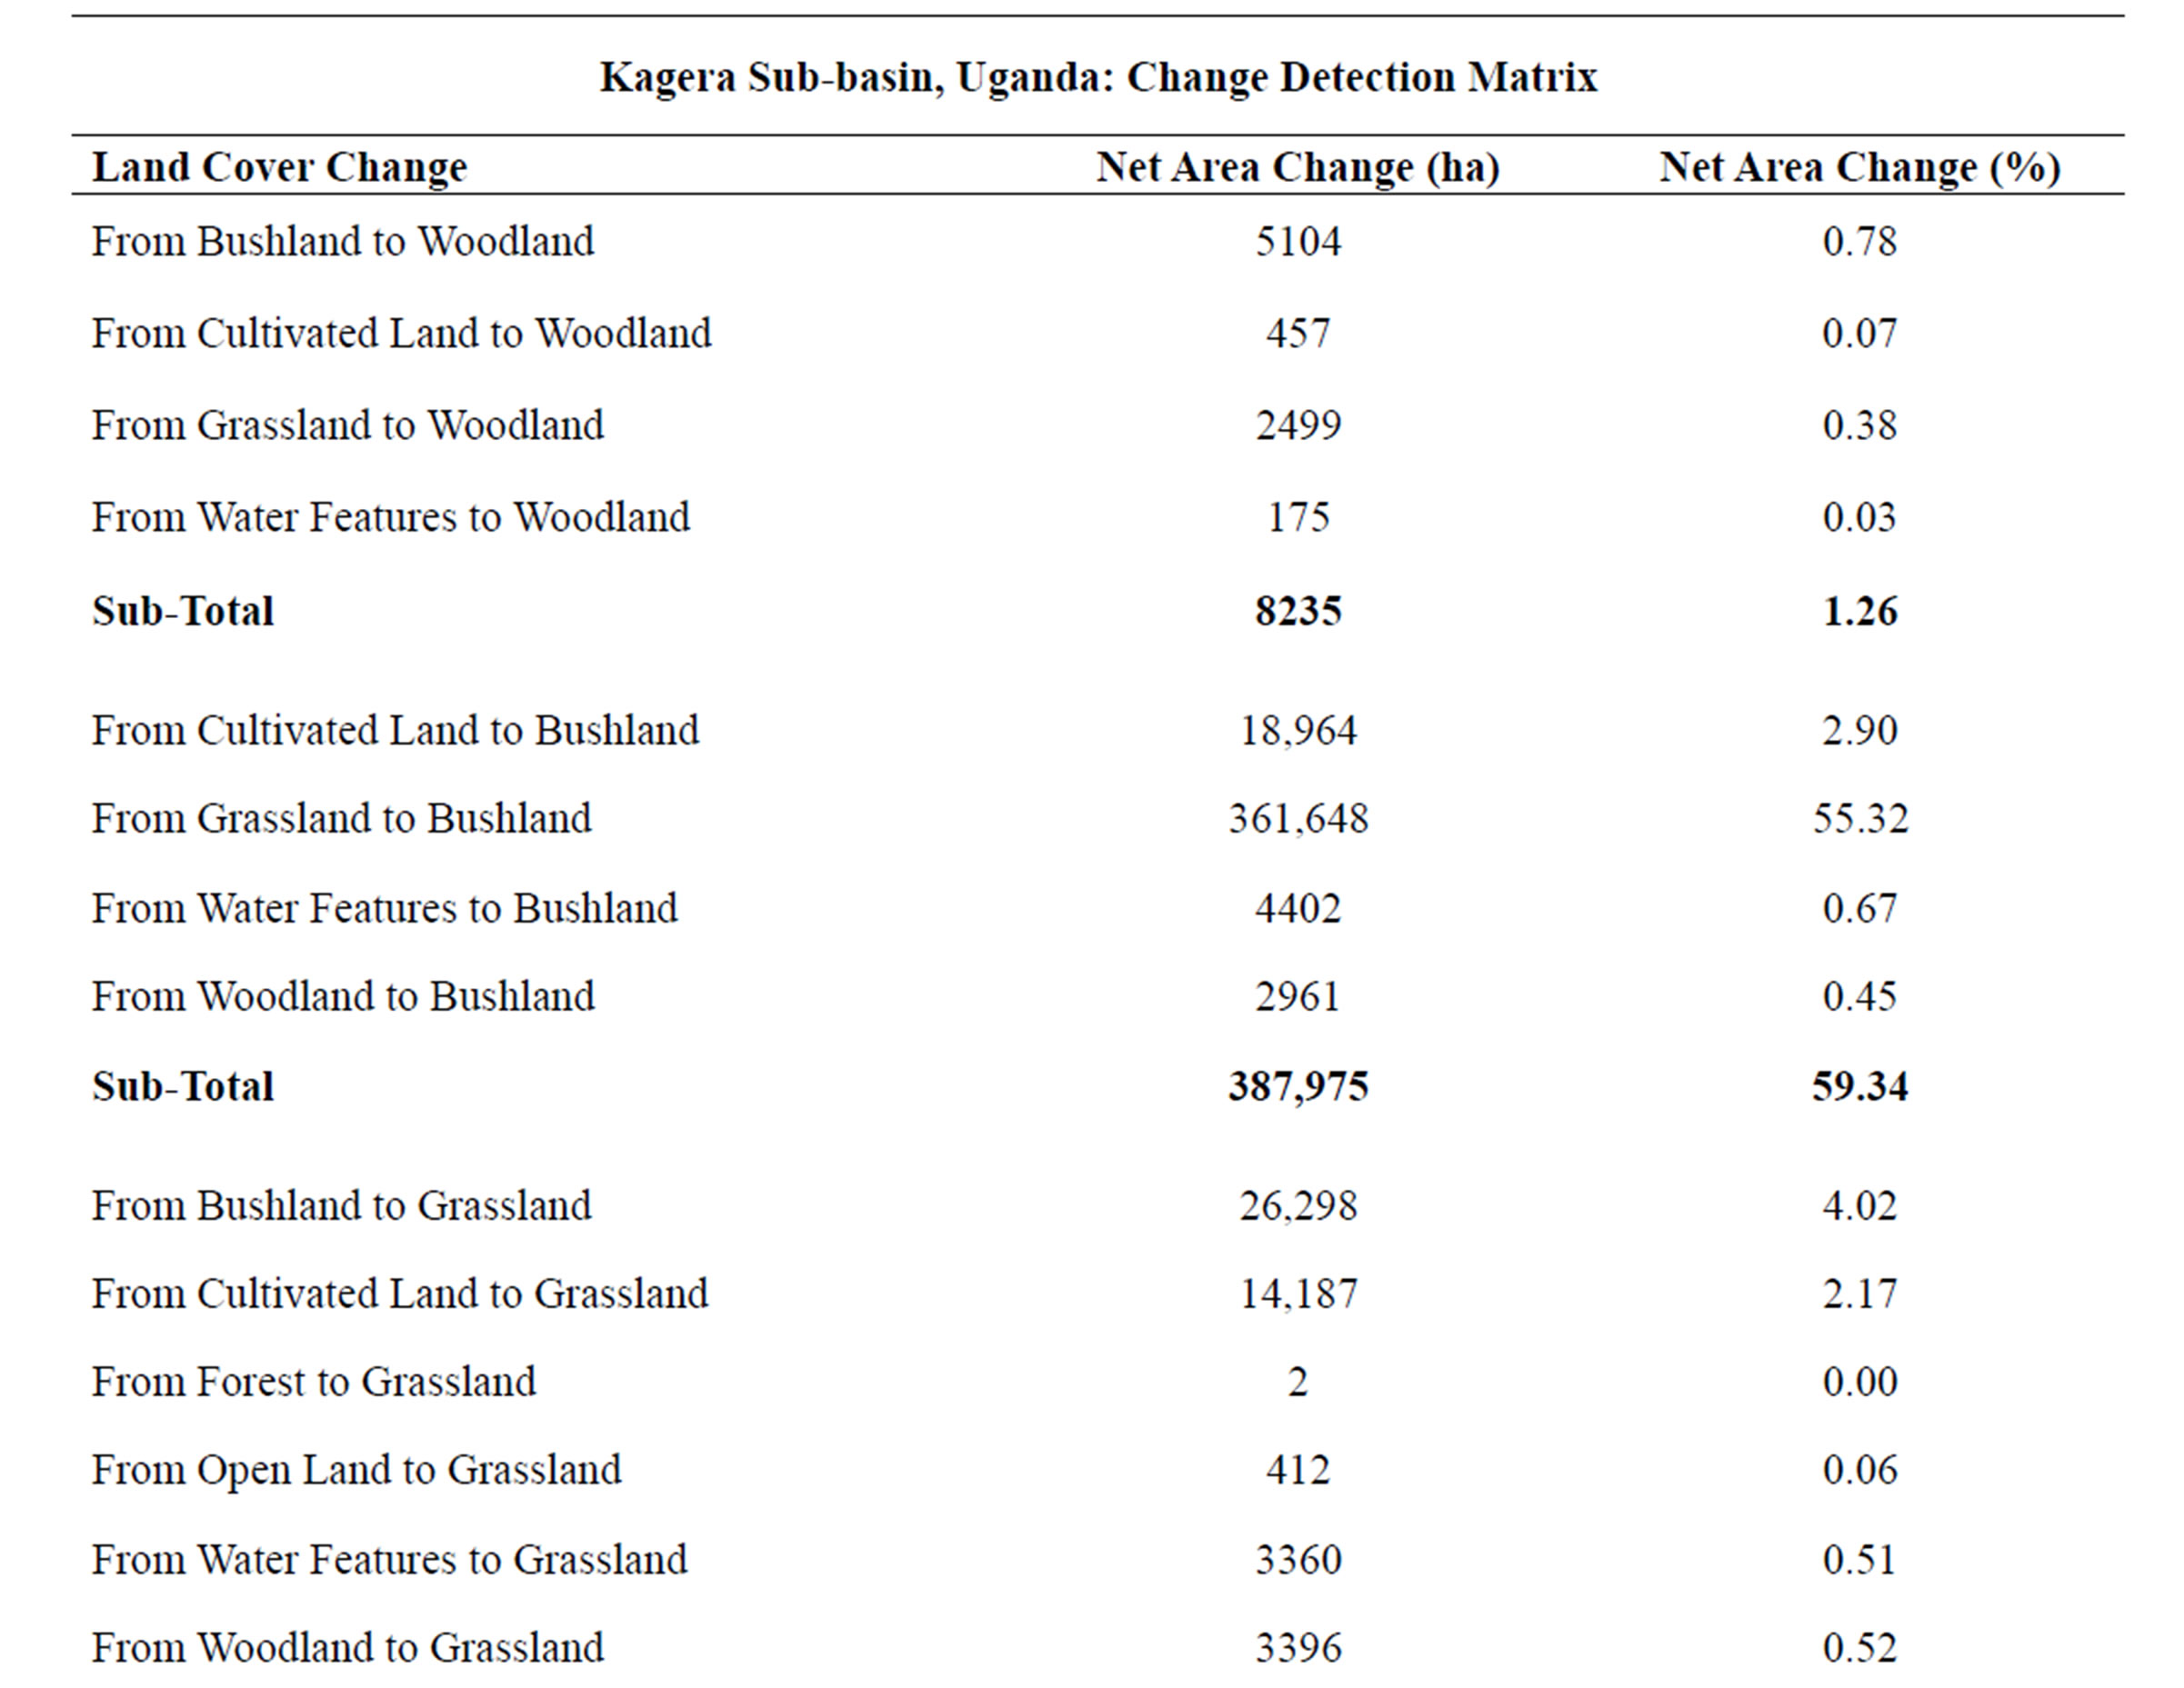
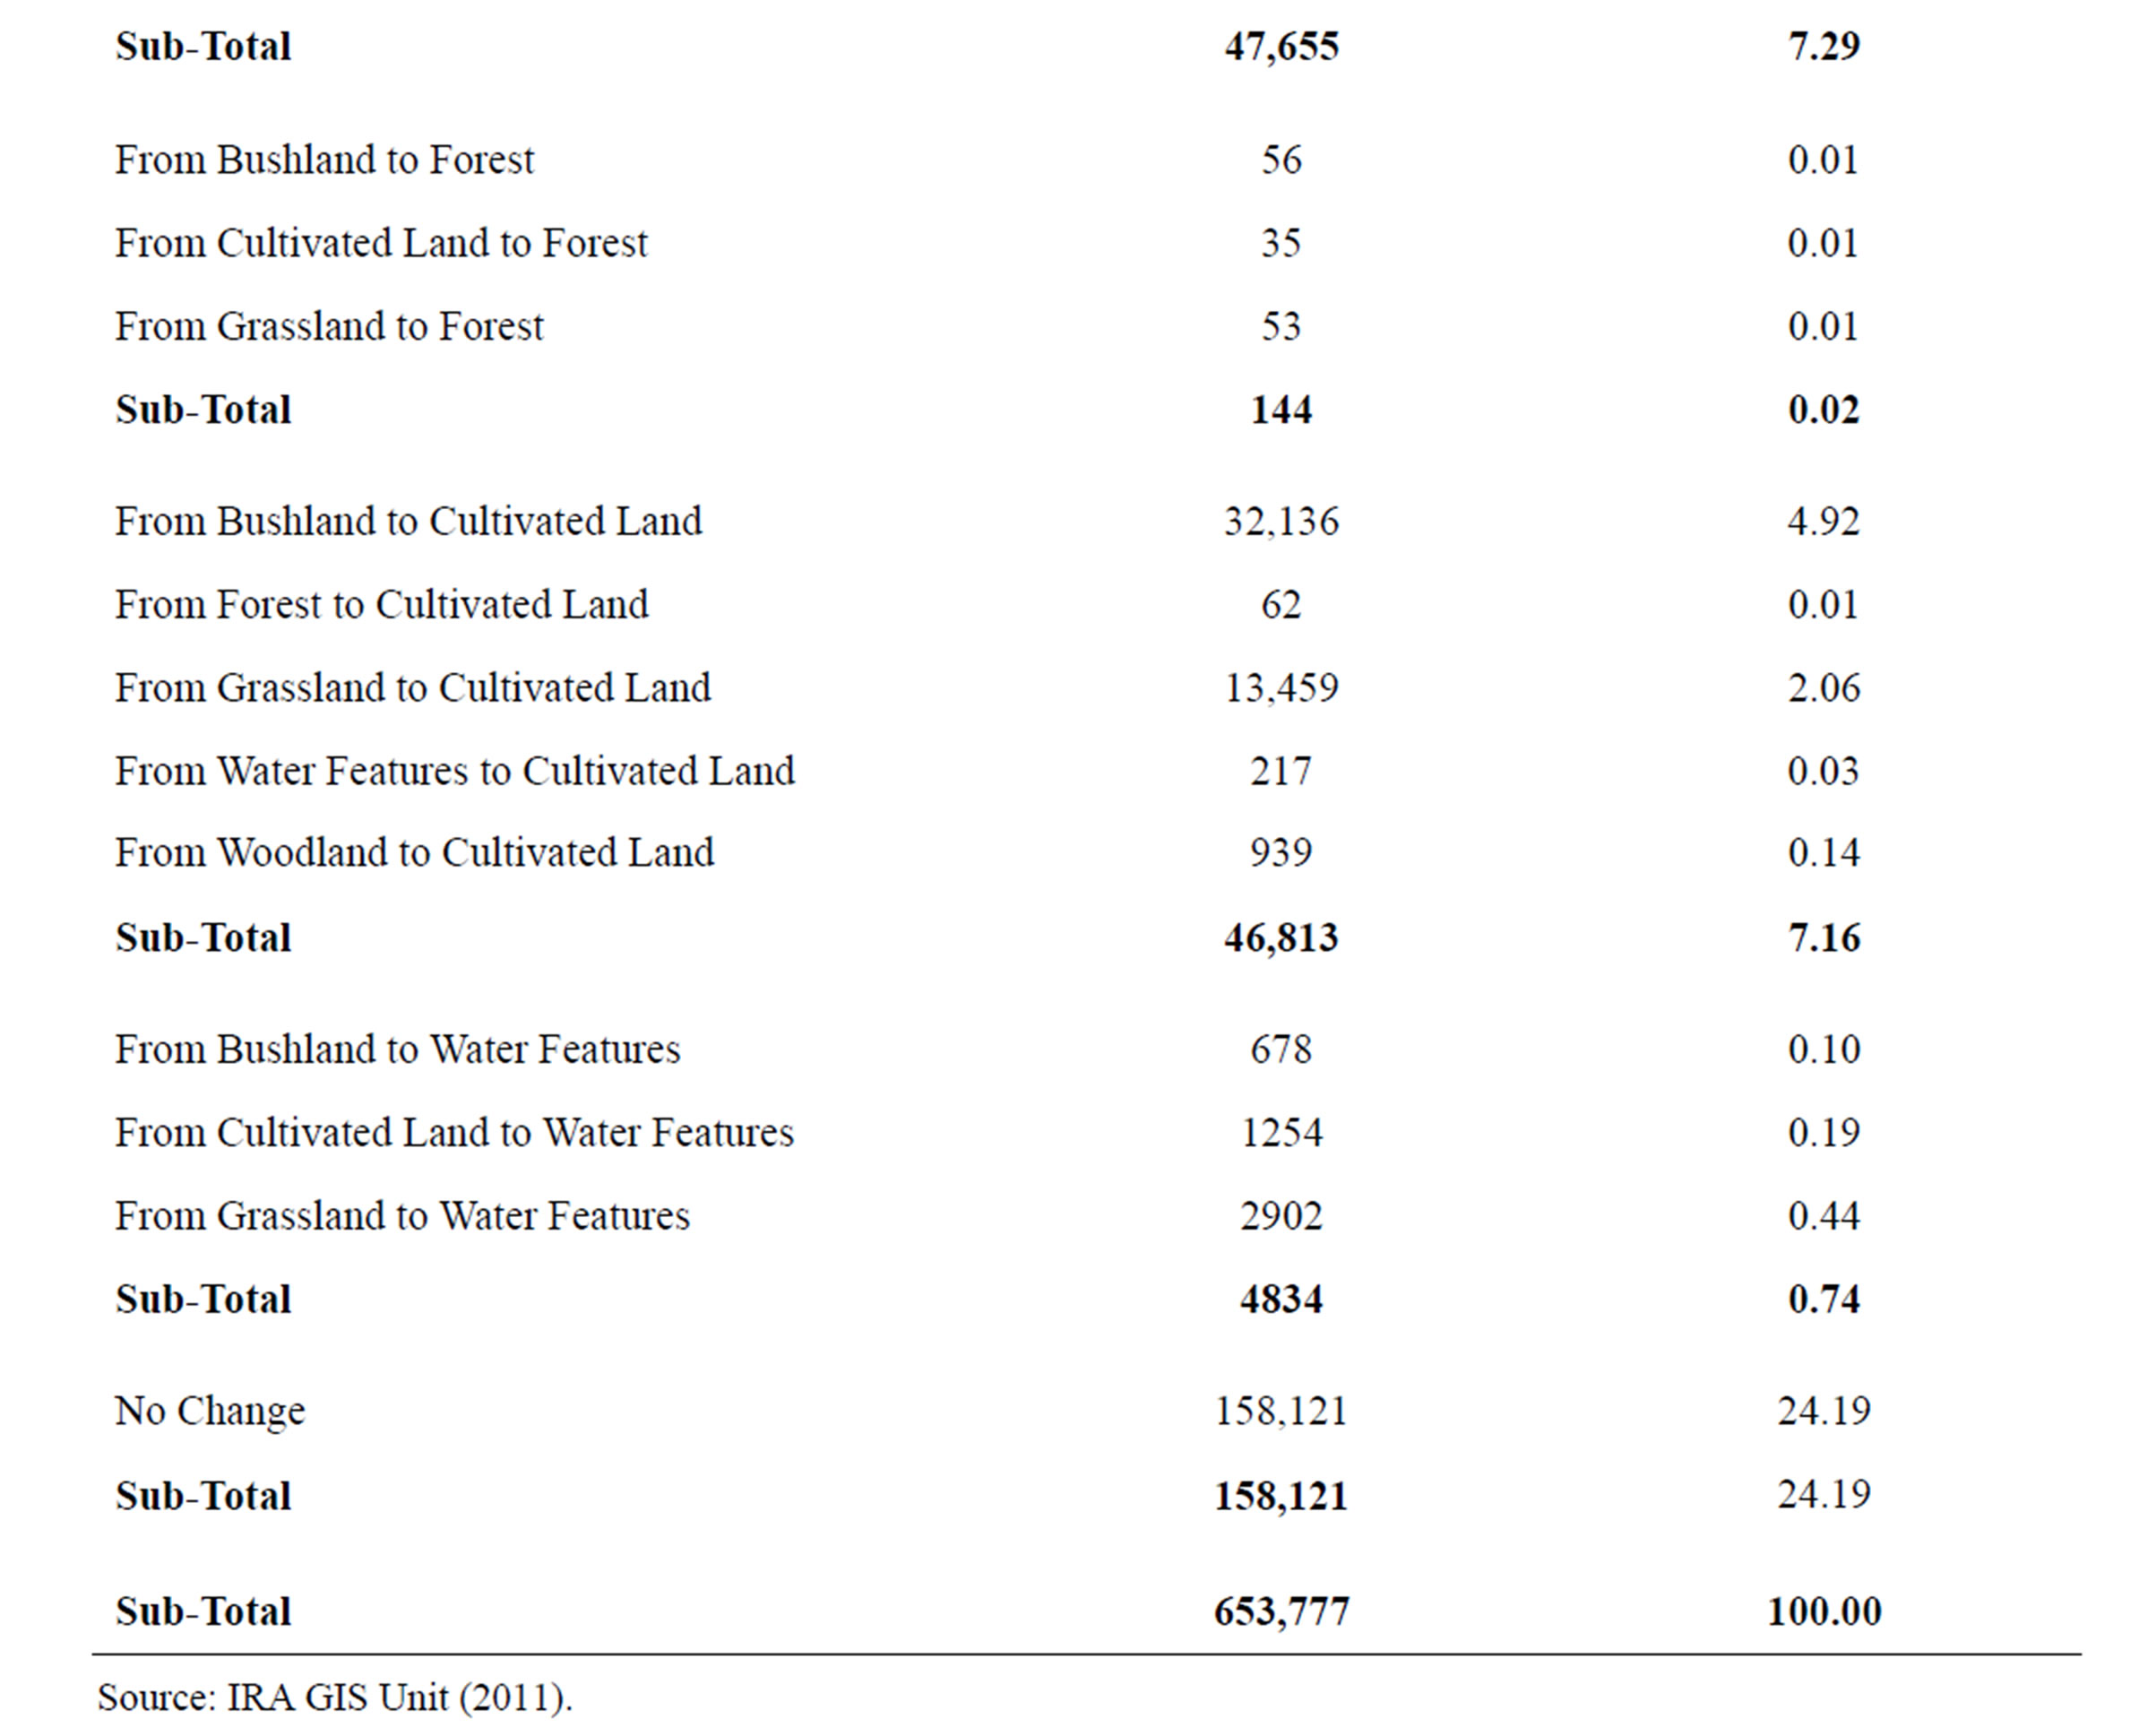
Table 3. Kagera sub-basin, Uganda land cover change detection matrix from the year 1984-2002.
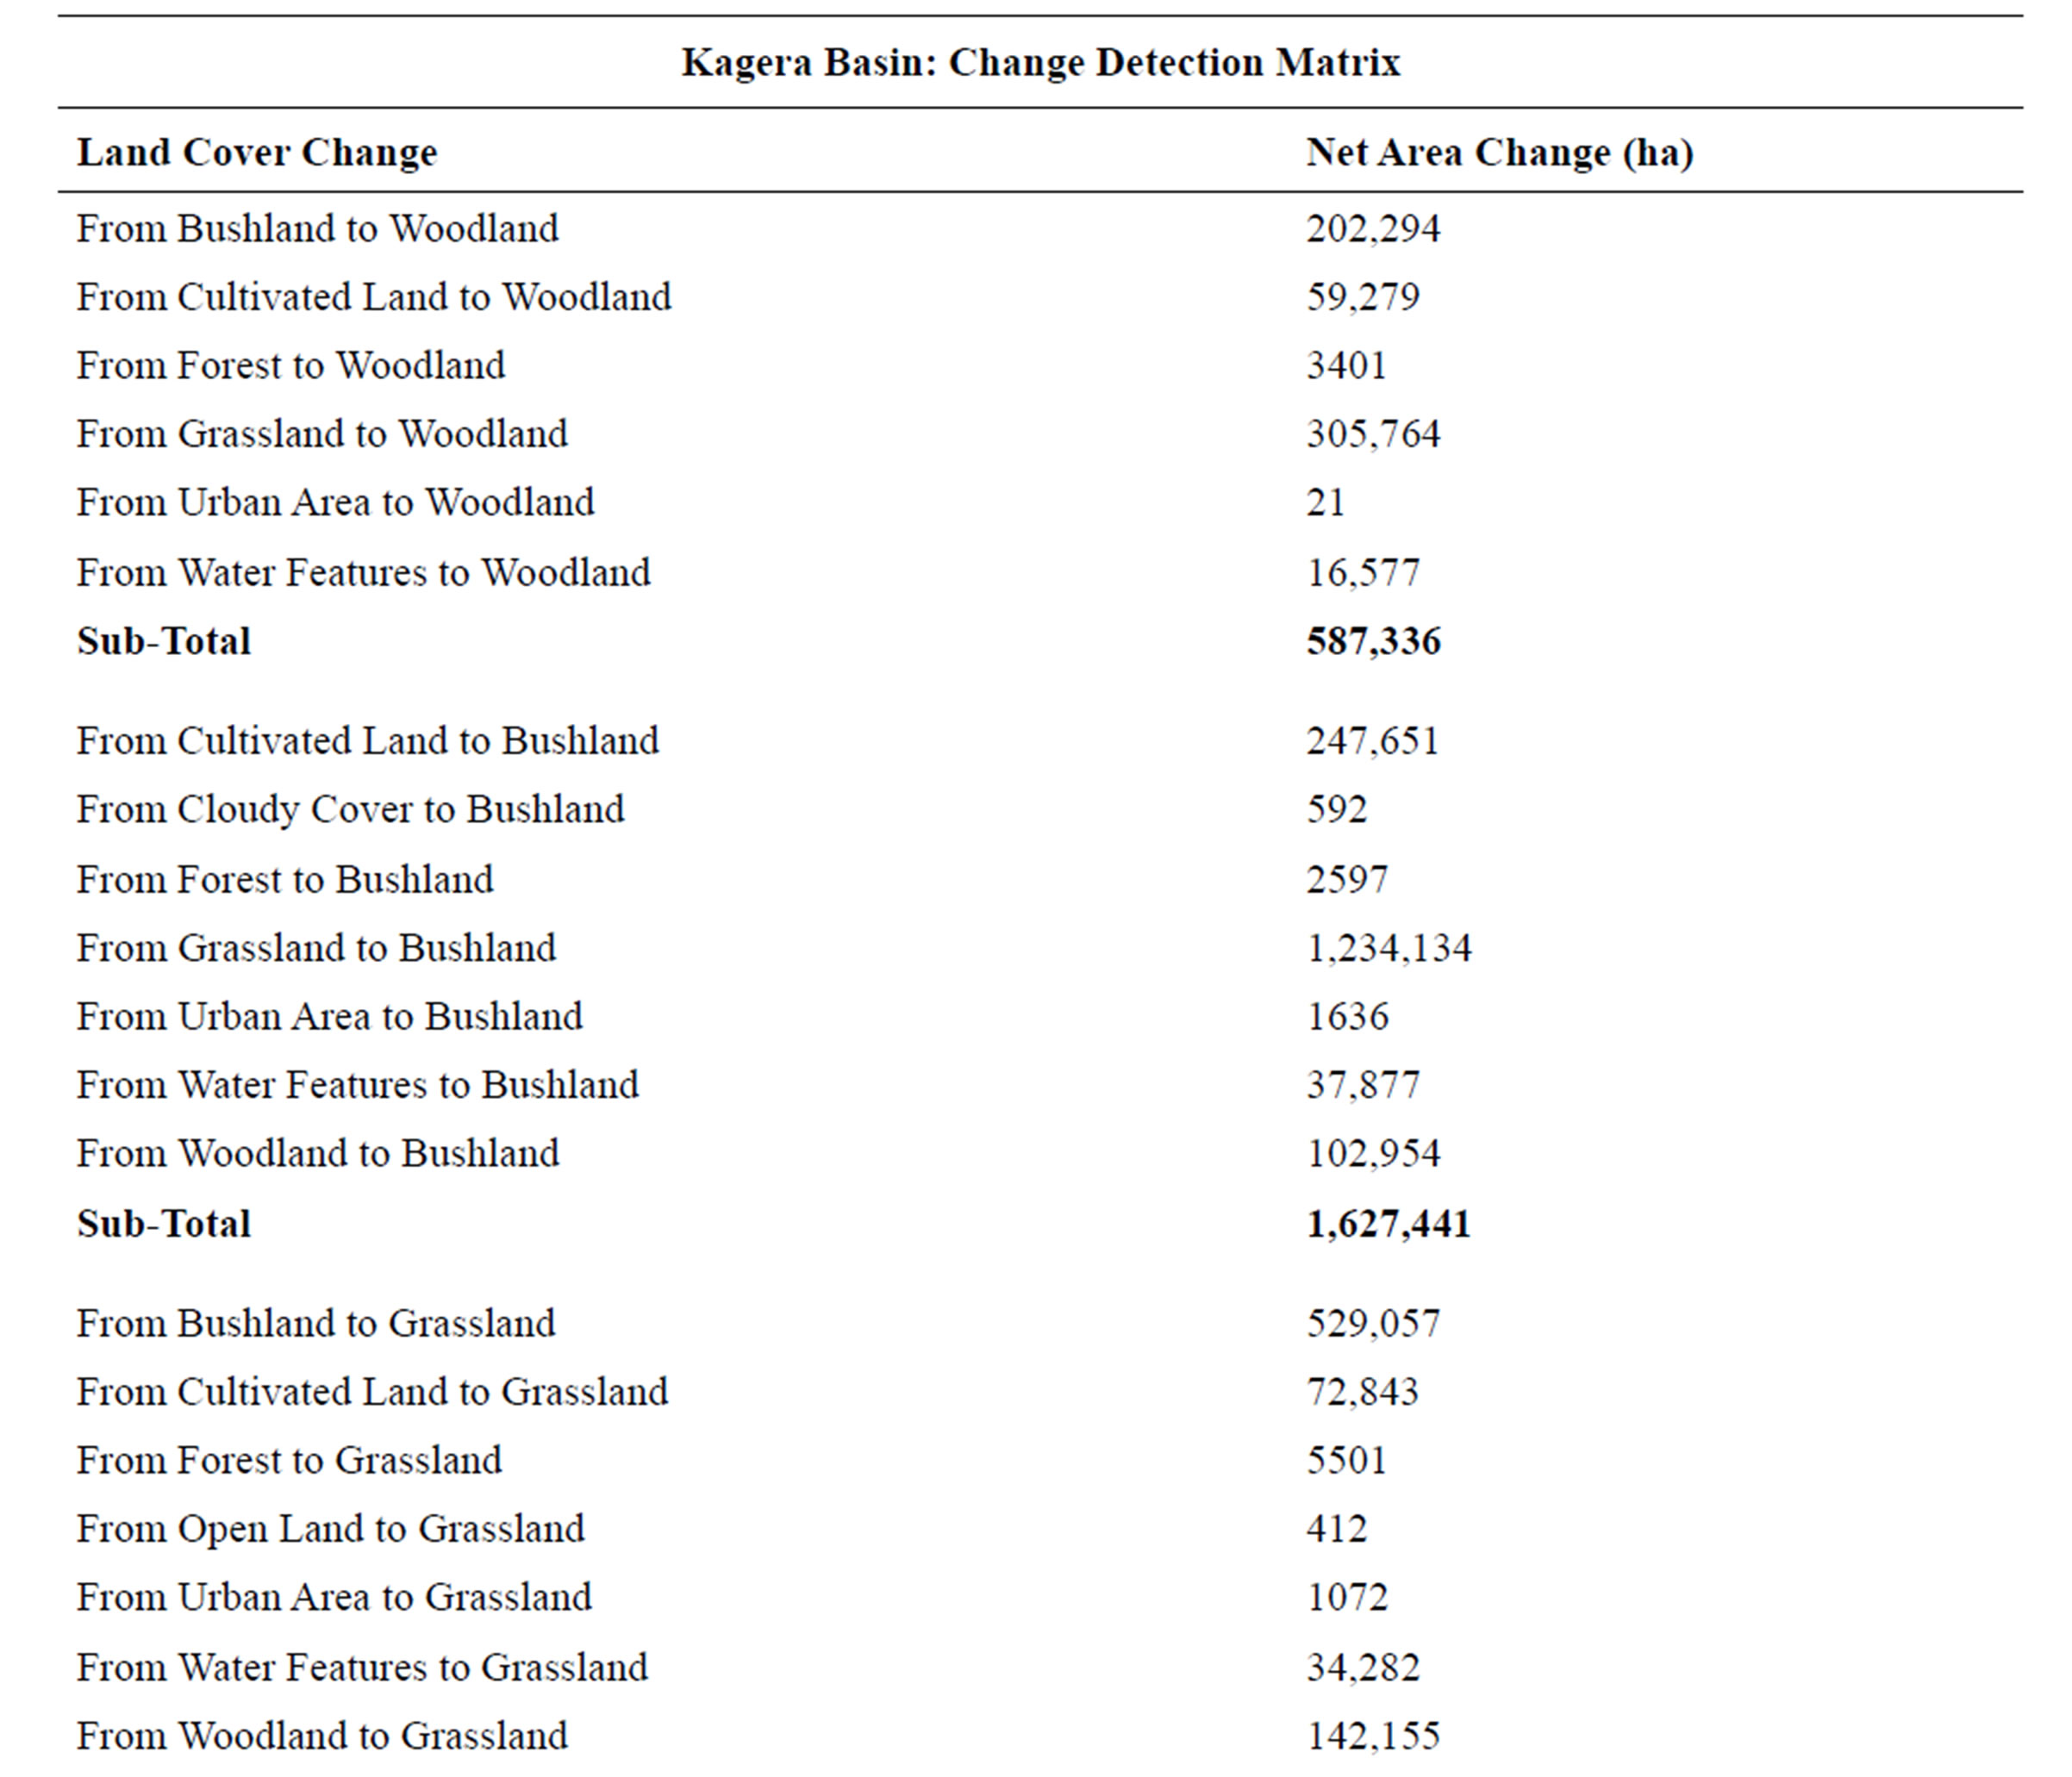


Table 4. Overall Kagera basin, land cover change detection matrix from the year 1984-2002.
conversions; and presumably as a result of human-induced factors and it is therefore concluded that the trends in land cover changes in Kagera river basin show unsustainable utilization of natural resources as most of the changes make the land susceptible to degradation. However, the results of these mapping exercises are expected to be linked to the demographic factors in our 2nd year of VicRes research, and will lead to identifying challenges and opportunities that are presented by different demographic factors in the Kagera basin in our 3rd year of VicRes research.
5. Acknowledgements
We are very grateful to the Swedish International Development Agency (Sida), the Inter-University Council for East Africa (IUCEA), through the Lake Victoria Research Initiative (VicRes) for funding and coordinating this research activity. We also thank the administrations of our respective universities for granting us time to do this research.
REFERENCES
- J. Holmberg and T. Lilja, “Kagera River Basin Integrated Water Resources Management Project,” WSP International Sweden AB, 2003.
- O. Deleuze and B. Cooney, “Transboundary Agro-Ecosystem Management Programme for Kagera River Basin (Kagera TAMP),” United Nations Environment Programme and Global Environment Facility (GEF), 2007.
- F. Baijukya, F. Kaihura and J. Thomas, “Land Degradation and Opportunities for Sustainable Management of Kagera River Basin, Tanzania,” Transboundary Agro-Ecosystem Management Programme (TAMP), Tanzania, 2005.
- I. Bugingo, “Poverty Alleviation Programs in Rwanda and Their Impact on Environment,” 2006. http://www.rwandagateway.org/article.phd?idarticle=1527
- L. Nzeyimana, “Rusumo Dam-Social Challenge in Kagera River Basin: Participation of the Affected People,” M.Sc. Dissertation, Linköping University, Linköping, 2003.
- G. Ndayiragije, “Etude Géomorphologique du Basin de la Kagera,” Unesco/Université du Burundi, Bujumbura, 1992.
- S. Edmeades, M. Smale, M. Renkow and D. Phaneuf, “Variety Demand within the Framework of an Agricultural Household Model with Attributes: The Case of Bananas in Uganda,” EPTD Discussion Paper No. 125, Environmental and Production Technology Division, International Food Policy Research Institute, Washington DC, 2004.
Appendix

Appendix 1. Kagera Basin, Land Cover Types, 1984
Appendix 2. Kagera Basin, Land Covers Type, 2002

Appendix 3. Uganda Sub-Kagera Basin-Land Use/Cover Types, Year 1984

Appendix 4. Uganda Sub-Kagera Basin-Land Use/Cover Types, Year 2002
NOTES
*Corresponding author.