Open Journal of Endocrine and Metabolic Diseases
Vol.3 No.1(2013), Article ID:28020,7 pages DOI:10.4236/ojemd.2013.31003
The Prevalence of Metabolic Syndrome in an Apparently Healthy, Normotensive and Non-Diabetic Population in Saudi Arabia by Two Definitions: Implications for Local Practice
Department of Clinical Biochemistry, Faculty of Medicine, King Abdulaziz University, Jeddah, Saudi Arabia
Email: sbahijri@gmail.com
Received October 29, 2012; revised November 3, 2012; accepted December 31, 2012
Keywords: Definitions; Metabolic Syndrome; Prevalence; Healthy Subjects; Lifestyle
ABSTRACT
Objectives: We aimed to 1) investigate the prevalence of MS in apparently healthy, non-hypertensive non-diabetic individuals living in Jeddah using the IDF and the NCEP-ATP III criteria to test for agreement in classification, and to determine the characteristics of subjects identified by either definition, and 2) examine the significance of family medical history and life style habits. Methods: 557 apparently healthy individuals aged 18 - 50 y were randomly approached in Jeddah health centres. 412 agreed to participate, while 55 were excluded because they were found to be frankly hypertensive and/or diabetic. Finally, 357 apparently healthy subjects with no hypertension or diabetes were fully studied. Anthropometric and demographic information were collected. Insulin, glucose, and lipid profile were obtained in fasting blood samples. Individuals were identified using the two definitions of metabolic syndrome, and their characteristics were compared statistically to the rest of the population. Results: Of the 233 subjects fulfilling the inclusion criteria, 44 and 39 (18.9% and 16.7%) were identified as having MS by the IDF or ATPIII definitions, respectively. The most common characteristic was central obesity using the IDF definition, and low HDL-cholesterol using the NCEP-ATP III definition. As expected from our exclusion criteria, the least common feature was high blood pressure in both cases. There was no significant difference between subgroups with and without MS with regard to smoking, exercise, and family history of disease. Regression analysis indicated the strongest predictors of MS were: blood glucose, LDL-C/HDL-C ratio and plasma insulin using the NCEP-ATPIII definition, and blood glucose, Waist /Hip ratio and plasma atherogenic index (PAI) using the IDF definition. Conclusions: In the absence of local cut-off thresholds for waist circumference, subjects might escape diagnosis using the IDF definition. The use of waist/Hip ratio, LDL-C: HDL-C, PAI and circulating insulin help with the diagnosis.
1. Introduction
The metabolic syndrome (MS) is a term used to describe a cluster of common pathologies, that include: obesity, insulin resistance, dyslipidemia, and hypertension, which predispose an individual to an increased risk of developing type 2 diabetes and cardiovascular disease (CVD) [1,2]. Expert groups have developed several sets of clinical criteria for the diagnosis of the syndrome. All groups agree on the core components of the syndrome mentioned above, but they apply the criteria differently to identify such a cluster. The latest International Diabetes Federation (IDF) consensus definition [3] emphasizes waist circumference as the central criterion, whilst the earlier National Cholesterol Education Program-Adult Treatment Panel III (NCEP-ATP III) definition [4] gives equal importance to different risk factors. The prevalence of MS is increasing globally as a result of changes in lifestyle, available nutrition, and the exposure to stress. Early detection, and hence intervention prevents, or delays the progression of MS to the more serious conditions [5,6]. Due to the fact that the prevalence of all forms of diabetes is increasing in the Kingdom of Saudi Arabia [7], it is imperative to investigate the prevalence of MS, and initiate local programmes for management. A few studies were carried out in different parts of the Kingdom [8-13] using different definitions for diagnosis, but none focused on apparently healthy individuals, and no properly conducted survey was carried out in our region. Therefore, we aimed to investigate the prevalence of MS in apparently healthy individuals living in Jeddah using the IDF and the NCEP-ATP III definitions to compare the degree by which the two definitions agree in classifying subjects, and to determine the characteristics of subjects identified by only one of either definitions. It was also our intention to investigate the importance of family medical history and life style habits.
2. Subjects and Methods
A cross-sectional study design was implemented. Healthy subjects aged 18 - 50 years were recruited randomly from apparently individuals visiting health centers as companions of sick relatives between July 2005-January 2007. Ethical approval was granted by the bioethics and research committee of the King Abdulaziz University.
Six health centers (representing the six health sectors of Jeddah) were chosen using a computer program, and according to earlier prevalence studies of MS in Saudi Arabia, and population density of chosen sectors, a sample size was calculated for each centre to give a total number of 230 subjects. Exclusion criteria included: known diabetes mellitus (or fasting plasma glucose ≥ 126 mg/dl; i.e. 7.0 mmol/L; upon testing), other endocrine disorders, hypertension, and known dyslipidaemia and coronary heart diseases. Hypertension was defined as a systolic blood pressure > 140 mmHg, or diastolic blood pressure > 90 mmHg, or current use of antihypertensive medications. Dyslipidaemia was defined as total cholesterol level ≥ 5.2 mmol/L, a LDL-C ≥ 3.36 mmol/L, and/or a HDL-C < 1.04 mmol/L, and/or triglycerides level ≥ 150 mg/dl (1.7 mmol/L).
Informed consent was obtained from all the study participants. Recruits were checked for hypertension and diabetes mellitus type 2. Blood pressure was measured using a standard mercury sphygmomanometer with the cuff on the right upper arm for all recruits. Two blood pressure readings were taken after the participant had rested for 10 minutes, and the mean of the two readings was calculated. When the difference between the two measures was larger than 5 mmHg for systolic or diastolic blood pressure, a third measurement was taken and the mean of the two closest values was registered. Individuals not taking any antihypertensive medications, and with a systolic blood pressure < 140 mmHg, and diastolic blood pressure < 90 mmHg were interviewed by trained interviewers using structured questionnaire. Data on social, demographic, past personal and family medical conditions and behavioural characteristics (regarding smoking; participants who smoked during the previous 6 months were classified as smokers) were self-reported. Anthropometric indices were taken also with the subject in light clothing and barefoot. Body weight was measured to the nearest 0.1 kg using a digital scale, and height to the nearest centimeter in the standing position using a wall stadiometer. Body mass index (BMI) was calculated as weight in kilograms divided by the height in meters, squared. Waist and hip circumference were measured to the nearest centimeter, with the subject standing, using a flexible and non-distensible tape and avoiding exertion of pressure on the tissues. The waist circumference (WC) was measured midway between the lower limit of the rib cage and the iliac crest. The hip circumference was considered as the maximal circumference over the femoral trochanters. Waist-to-hip circumference ratio was calculated (WHR).
Subjects were given an appointment for blood collection following a 12 hour fast. Collected samples were immediately placed on ice prior to processing. Glucose was determined first in separated serum, and subjects showing hyperglycemia of ≥ 126 mg/dl (7.0 mmol/L) were excluded. Remaining samples were divided into aliquots and frozen at –70˚C for later measurements of lipids profile, insulin and free fatty acids (FFA).
Glucose, total cholesterol, HDL-cholesterol, LDLcholesterol and triglycerides (TG) were estimated using automated enzymatic methods (Dade Behring Inc., UK). Insulin was estimated using the “electro chemiluminescence immunoassay” “ECLIA” on Modular Analytics E 170 (Elecys module) immunoassay analyzer, supplied by Roche Diagnostics GMbH. All measurements were carried out at the university hospital biochemistry laboratory. FFAs were estimated manually in serum using an enzymatic method (Wako chemicals GMbH).
Two definitions were used to identify apparently nonhypertensive, non-diabetic individuals with MS, the IDF [3] and the NCEP-ATP III [4] definitions.
3. Statistical Analysis
Analyses were performed using SPSS statistical package version 16. Descriptive statistics such as mean ± S.D. for normally distributed data or median, and inter quartile range (IQR) for non-normally distributed variables were calculated for all parameters in each of the four resulting subgroups. Categorical variables were presented as frequency and percentage.
An unpaired Student t-test and a Mann Whitney-U test was employed for comparison of normally distributed and non-normally distributed parameters respectively, while a χ² test was used to compare categorical parameters. The kappa coefficient was used to analyze statistical agreement between the two definitions.
Multiple logistic regression were used to adjust for confounding factors. Crude and adjusted Odds Ratio (OR) with its 95% Confidence Interval (CI) for the Predictor of Metabolic syndrome according to NCEP-ATPIII definition and IDF definition were presented. Age, sex, smoking, family history of DM, family history of heart diseases, BMI, WHR, cholesterol, TG, insulin, fasting blood glucose, FFA and LDL/HDL ratio were included in the model as independent variables. Significance was assigned at p < 0.05.
4. Results
Out of 557 individuals approached, 412 agreed to participate indicating a response rate of 74%. Only 357 subjects were found to be normotensive. Thus, undiagnosed hypertension was detected in >13% of the recruited subjects. Moreover, after testing FBG, 34.7% of this randomly recruited apparently healthy population had blood glucose value ≥ 7 mmol/L, and were excluded from further analysis according to our criteria. Therefore, only 233 subjects satisfied the criteria and provided the required samples (94 males and 139 females, representing 40.3% and 59.7% of the total study population). The demographic, anthropometric and biochemical characteristics of the studied population is presented in Table 1.
Using the ATP III definition 39 subjects (8 M + 31 F) were diagnosed with MS representing 16.7% of the total study population (95% CI 12.5 - 22.1). The percentage of females with MS (22.3% of females) was significantly (p = 0.006) higher than that of males (8.5% of all males).
Using the IDF definition 44 (13 M and 31 F) subjects were diagnosed with MS, representing 18.9% of the total population (95% CI = 14.4 - 24.4). The percentage of females with MS (22.3% of females) was higher than that of males (13.8% of all males), but not significantly (p = 0.105).
Only 26 subjects were diagnosed by both definitions to have MS, but 202 subjects (86.7% of the studied population) were similarly classified by the two definitions (Kappa = 0.55). Subjects identified by IDF, but not ATP III definition, were all obese (BMI ≥ 30). Subjects identified by the ATP III, but not IDF definition, were either slightly overweight or of normal weight (BMI = 25 - 27.4), but suffered from hypertriglyceridemia.
Table 1. Demographic, anthropometric and biochemical characteristics of the studied population.

The prevalence of MS and its different components by ATPIII & IDF in the population studied is presented in Figure 1.
The most common feature of metabolic syndrome varied according to the definition used. With the IDF definitions the most common feature was central obesity, but using the NCEP-ATP III definition, low HDL-cholesterol was the commonest, followed by high fasting glucose in both cases. On the other hand, the least common feature was high blood pressure, whichever definition was used. It was also noted that the frequency of dyslipidaemia was similar regardless of the definition used.
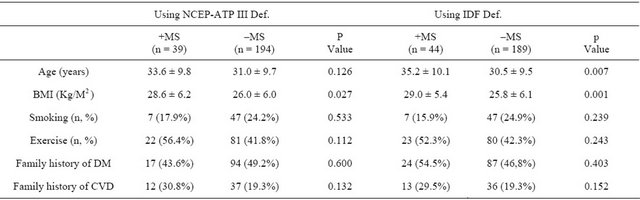
The demographic characteristics of normal and MS groups using both ATP III & IDF definitions are presented in Table 2.
There was no significant difference between subgroups with and without MS with regard to smoking, exercise, family history of diabetes or CVD when either of the definitions were applied, in contrast to BMI, which was noted to be significantly higher in the MS subgroup under both definitions. Age appeared to be significantly higher in MS subgroup only when the IDF definition was used [5] .
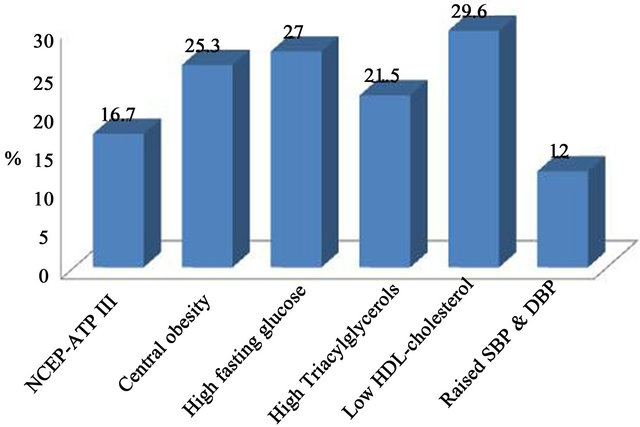
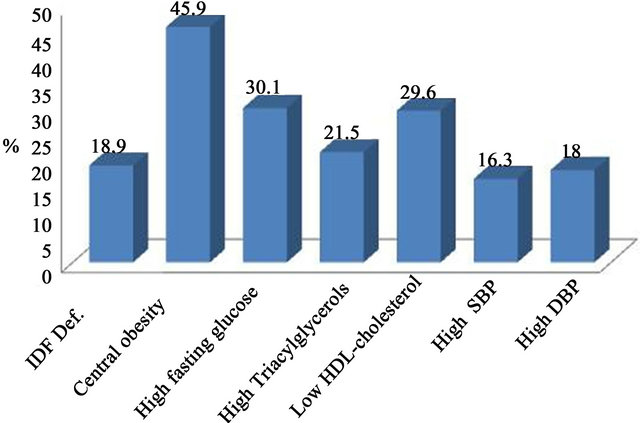
Figure 1. Prevalence of metabolic syndrome and its individual components according to the definitions by NCEPATPIII & IDF.
Table 2. Demographic characteristics of normal and MS groups using both NCEP-ATP III & IDF definitions.
Biochemical profile of normal and MS groups using both the NCEP-ATP III and the IDF definitions are presented in Table 3.
In addition to the three parameters used to diagnose MS in the studied subjects (i.e. fasting glucose, triglycerides and HDL-cholesterol), there was a significant difference between the subgroups with and without MS in insulin level, LDL-C/HDL-C ratio, and plasma atherogenic index (PAI).
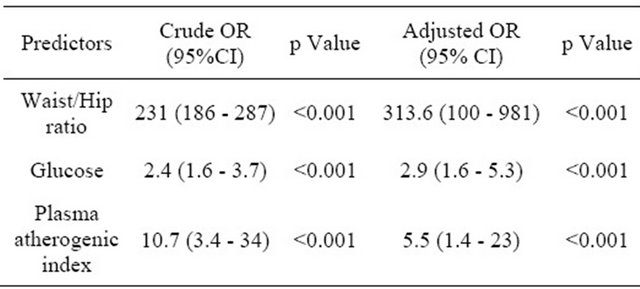
Using regression analysis, the strongest predictors of MS were the level of fasting glucose and LDL-C/HDL-C ratio, as well as insulin when NCEP-ATPIII definition was used, and level of glucose, as well as Waist /Hip ratio and PAI) when the IDF definition was used. Crude and adjusted OR are presented in Tables 4 and 5, respectively.
5. Disscussion
The high percentage of hypertensive subjects, and the even higher percentage of subjects with fasting hyperglycemia (FBG above 7.00 mmol/L) in the self-reported healthy population raises questions and concerns about the adequacy of current health awareness programmes in our community. The prevalence of MS in our apparently healthy nonhypertensive, nondiabetic population is similar to some [8,9], but lower than other [10-13] earlier studies on Saudi subjects. This might be because of differences in exclusion criteria, type of subjects, region, diet and lifestyle. Our population excluded hypertensive and diabetic subjects, as well as those with other metabolic abnormalities, whilst other earlier studies did not. In spite of this, the prevalence of MS was relatively high for healthy individuals receiving no medical counselling (16.7% and 18.9% for ATPIII and IDF definition, respectively). Individuals with metabolic syndrome should be identified early so that their cardiovascular risk factors can be reduced, hence, the importance of our study.
Due to the different cut-offs used by the two definitions some individuals might have been missed or wrongly classified when either definition were used alone.
The use of the IDF definition has been reported to result in higher prevalence, [14-16] probably reflecting the IDF criteria for defining hypertension, hyperglycemia and central obesity. [17] In our study, the prevalence of high waist circumference considered by the IDF criteria (45.9%) was much higher than that estimated by the NCEP-ATP III Def. (25.3%), probably due to the lower cut-off used by the IDF. However, the overall impact of the mandatory use of this feature was small in relation to the overall prevalence of the syndrome (from 16.7% by NCEP-ATP III Def. to 18.9 by IDF). This was noted in other studies [18,19] reporting that waist circumference as a definition prerequisite did not affect prevalence of metabolic syndrome. Different results have been observed in other ethnic groups, such as that reported in Korean [20] and Turkish [21] populations, where central obesity seems to have a greater impact on the overall prevalence of the syndrome, challenging the appropriateness of IDF criteria in such situations. In our study, IDF definition failed to identify non-obese subjects with a metabolically abnormal profile, increasing their future risk for type II diabetes and CVD.
When using the NCEP-ATP III definition, the prevalence of MS is gender dependent as reported earlier in Saudi Arabia [11] and other parts of the world [14-16]. Moreover, even though age appeared to play a role when the IDF definition was used as reported in earlier studies [19-22] , it did not continue to be so following regression analysis. This could be due to the younger age of our subjects (18 - 50 years), compared to other studies without an age limit, and reporting an increase with age above 50 years [19-23] .
Similarly, before, but not after, regression analysis, overweight and obesity, as measured by higher mean BMI, appeared to be an important feature, whichever definition was used. This emphasises the importance of visceral versus general obesity.
Table 3. Biochemical profile of normal and MS groups using both NCEP-ATP III definition & IDF definitions.
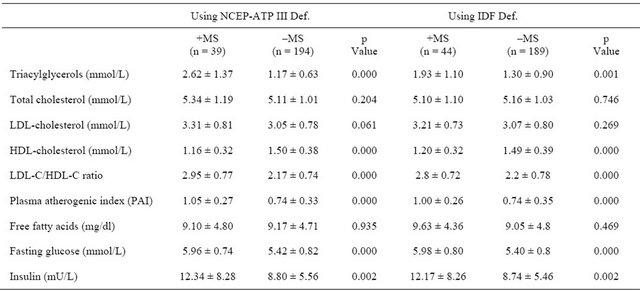
Table 4. Crude and adjusted OR for the prediction of metabolic syndrome according to NCEP-ATPIII definition.
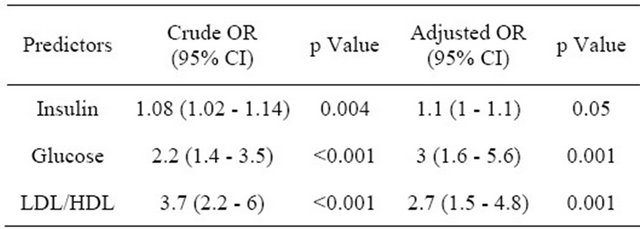
Table 5. Crude and adjusted OR for the prediction of metabolic syndrome according to IDF definition.
The importance of waist : hip ratio becomes apparent following regression analysis, and might be a good alternative to waist circumference, which is dependent on ethnicity [3], particularly as there are no national specific criteria for abdominal obesity. Moreover, our population is multiethnic, and there are intermarriages between different ethnic groups making it hard to identify ethnic origin accurately.
Insulin resistance is the most accepted unifying hypothesis to describe the pathophysiology of the metabolic syndrome [24]. This is reflected on higher than normal insulin level needed to control blood glucose. In our study, estimation of insulin appears to be a useful indicator, even after adjustment with regression analysis.
Similarly, PAI, as well as the LDL-C: HDL-C ratio may also be useful markers, especially as it has been reported that there are distinct patterns of lipid profiles associated with ethnicity regardless of the glucose levels [25]. The use of ratios rather than absolute values might help to overcome the problem of not having national cutoff values for dyslipidaemia. Furthermore, it is difficult to follow other ethnic guidelines due to mixed ethnicity in our population as mentioned earlier.
Studies suggest that an overabundance of circulating fatty acids could play a major role in the metabolic syndrome by increasing insulin resistance and inhibiting insulin signaling pathways [26-28] . However, there was no significant difference between fatty acid levels in the subgroups with and without MS, even though significantly higher levels were associated with higher insulin resistance in an earlier study [29]. A possible explanation is that insulin resistance is one major component rather than the entire picture of the metabolic syndrome. Genetic, environmental and dietary factors might also play a role.
6. Conclusion
Metabolic syndrome was common in our population of apparently healthy nonhypertensive, nondiabetic individuals. The exact figures are dependent on the definition used. In the absence of local data on the definition of central obesity, it might be inappropriate to use the IDF definition, which excluded non-obese subjects with dyslipidemia. The use of waist: Hip ratio, LDL-C: HDLC, PAI and insulin level might help with the diagnosis. Further larger studies are needed before making firm recommendations regarding detection, prevention or management. Weight reduction and exercise are likely to be key aspects for intervention, and follow up of the population studied will help clarify the most appropriate indicators of MS, and the best cut-off values.
7. Acknowledgments
This study was supported by grant number (429/094) as part of a bigger research project conducted by “Saudi Diabetes Study Research Group” at King Abdulaziz University-Jeddah-Kingdom of Saudi Arabia.
REFERENCES
- B. Isomaa, “A Major Health Hazards: The Metabolic Syndrome,” Life Science, Vol. 73, 2003, pp. 2395-2411.
- C. L. Scott, “Diagnosis, Prevention and Intervention for the Metabolic Syndrome,” The American Journal of Cardiology, Vol. 92, Suppl. 1, 2003, pp. 35i-42i.
- “The Idf Consensus Worldwide Definition of the Metabolic Syndrome,” 2006. http://www.idf.org/webdata/docs/MetSyndrome_FINAL.pdf
- Expert Panel on Detection, Evaluation, and Treatment of High Blood Cholesterol in Adults, “Executive Summary of the Third Report of the National Cholesterol Education Program (NCEP) Expert Panel on Detection, Evaluation, and Treatment of High Blood Cholesterol in Adults (Adult Treatment Panel III),” The Journal of the American Medical Association, Vol. 285, No. 19, 2001, pp. 2486-2497. doi:10.1001/jama.285.19.2486
- J. Tuomilehto, J. Lindström and J. G. Eriksson, “Prevention of Type 2 Diabetes Mellitus by Changes in Lifestyle among Subjects with Impaired Glucose Tolerance,” The New England Journal of Medicine, Vol. 344, No. 18, 2001, pp. 1343-1350.
- J. Lindstrom, A. Louheranta, M. Mannelin, M. Rastas, V. Salminen and J. Eriksoon, “The Finnish Diabetes Prevention Study (DPS): Lifestyle Intervention and 3-Year Results on Diet and Physical Activity,” Diabetes Care, Vol. 26, No. 12, 2003, pp. 3230-3236.
- M. Al-Nozha, M. Al-Maatouq, Y. Al-Mazrou, S. Al-Harthi, M. Arafah and M. Khalil, “Diabetes Mellitus in Saudi Arabia,” Saudi Medical Journal, Vol. 25, No. 11, 2004, pp. 1603-1610.
- D. A. Al-Qahtani and M. L. Imtiaz, “Prevalence of Metabolic Syndrome in Saudi Adult Soldiers,” Saudi Medical Journal, Vol. 26, No. 9, 2005, pp. 1360-1366.
- D. Al-Qahtani, M. Imtiaz, O. Saad and N. Hussein, “A Comparison of the Prevalence of Metabolic Syndrome in Saudi Adult Females Using Two Definitions,” Metabolic Syndrom and Related Disorders, Vol. 4, No. 3, 2006, pp. 204-214. doi:10.1089/met.2006.4.204
- D. H. Akbar, “Metabolic Syndrome Is Common in Saudi Type 2 Diabetic Patients,” Diabetes International, Vol. 12, No. 2, 2002, pp. 47-49.
- M. Al-Nozha, A. Al-Khadra, M. R. Arafah, M. A. Al-Maatouq, M. Z. Khalil, N. B. Khan, Y. Y. Al-Mazrou, et al., “Metabolic Syndrome in Saudi Arabia,” Saudi Medical Journal, Vol. 26, No. 12, 2005, pp. 1918-1925.
- I. E. Barrimah, A. Mohaimeed, F. Midhat and H. A. Al-Shobiliet, “Prevalence of Metabolic Syndrome among Qassim University Personnel in Saudi Arabia,” International Journal of Health Sciences, Vol. 3, No. 2, 2009, pp. 133-142.
- N. M. Al-Daghri, O. S. Al-Attas, M. S. Alokail, K. M. Alkharfy, S. L. B. Sabico and G. P. Chrousos, “Decreasing Prevalence of the Full Metabolic Syndrome but a Persistently High Prevalence of Dyslipidemia among Adult Arabs,” Plos One, Vol. 5, No. 8, 2010, p. e12159. doi:10.1371/journal.pone.0012159
- E. S. Ford, “Prevalence of the Metabolic Syndrome Defined by the International Diabetes Federation among Adults in the US,” Diabetes Care, Vol. 28, No. 11, 2005, pp. 2745-2749.
- Decode Study Group, “Prevalence of the Metabolic Syndrome in Populations of Asian Origin. Comparison of the Idf Definition with the Ncep Definition,” Diabetes Research and Clinical Practice, Vol. 76, No. 1, 2005, pp. 57-67.
- Decode Study Group, “Comparison of Different Definitions of the Metabolic Syndrome in Relation to Cardiovascular Mortality in European Men and Women,” Diabetologia, Vol. 49, No. 12, 2006, pp. 2837-2846.
- G. Assmann, R. Guerra, G. Fox, P. Cullen, H. Schulte, D. W. Willett and S. M. Grundy, “Harmonizing the Definition of Metabolic Syndrome: Comparison of the Criteria of the Adult Treatment Panel III and the International Diabetes Federation in US American and European Populations,” American Journal of Cardiology, Vol. 99, No. 4, 2007, pp. 541-548.
- B. Cheung, K. Ong, Y. Man, L. Wong, C. Lau and K. Lam, “Prevalence of the Metabolic Syndrome in the United States National Health and Nutrition Examination Survey 1999-2002 According to Different Defining Criteria,” The Journal of Clinical Hypertension, Vol. 8, No. 8, 2006, pp. 562-570.
- A. C. Santos and H. Barros, “Impact of Metabolic Syndrome Definitions on Prevalence Estimates: A Study in a Portuguese Community,” Diabetes and Vascular Disease Research, Vol. 4, No. 4, 2007, pp. 320-327.
- Y. Yoon, E. Lee, C. Park, S. Lee and S. Oh, “The New Definition of Metabolic Syndrome by the International Diabetes Federation Is Less Likely to Identify Metabolically Abnormal but Non-Obese Individuals than the Definition by the Revised National Cholesterol Education Program: The Korea Nhanes Study,” International Journal of Obesity, Vol. 31, No. 3, 2007, pp. 528-534.
- A. Gemalmaz, S. Aydin, O. Bafiak, G. Discigil and A. Karul, “Prevalence of the Metabolic Syndrome in a Rural Turkish Population: Comparison and Concordance of Two Diagnostic Criteria,” Turkish Journal of Medical Sciences, Vol. 38, No. 2, 2008, pp. 159-165.
- Y. W. Park, S. Zhu, L. Palaniappan, S. Heshka, M. R. Carnetho and S. B. Heymsfield, “Prevalence and Associated Risk Factor Findings in the US Population from the Third National Health and Nutrition Examination Survey, 1988- 1994,” Archives of Internal Medicine, Vol. 163, No. 4, 2003, pp. 427-436.
- D. E. Laaksonen, L. Niskanen, H. M. Lakka, T. A. Lakka and M. Uusitupa, “Epidemiology and Treatment of the Metabolic Syndrome,” Annals of Medicine, Vol. 36, No. 5, 2004, pp. 332-346.
- R. H. Eckel, S. M. Grundy and P. Z. Zimmet, “The Metabolic Syndrome,” Lancet, Vol. 365, No. 9468, 2005, pp. 1415-1428.
- L. Zhang, Q. Qiao, J. Tuomilehto, E. D. Janus, T. H. Lam, A. Ramachandran, V. Mohan, et al., “Distinct Ethnic Differences in Lipid Profiles across Glucose Categories,” The Journal of Clinical Endocrinology & Metabolism, Vol. 95, No. 4, 2010, pp. 1793-1801.
- K. F. Petersen, S. Dufour, D. Befroy, R. Garcia and G. I. Shulman, “Impaired Mitochondrial Activity in the Insulin-Resistant Offspring of Patients with Type 2 Diabetes,” The New England Journal of Medicine, Vol. 350, No. 7, 2004, pp. 664-671.
- A. Laws, H. M. Hoen, J. V. Selby, M. F. Saad, S. M. Haffner and B. V. Howard, “Differences in Insulin Suppression of Free Fatty Acid Levels by Gender and Glucose Tolerance Status: Relation to Plasma Triglyceride and Apolipoprotein B Concentrations: Insulin Resistance Atherosclerosis Study (Iras) Investigators,” Arteriosclerosis, Thrombosis, and Vascular Biology, Vol. 17, No. 1, 1997, pp. 64-71.
- X. L. Wang, L. Zhang, K. Youker, M. Zhang, J. Wang, S. A. LeMaire, J. S. Coselli, et al., “Free Fatty Acids Inhibit Insulin Signaling-Stimulated Endothelial Nitric Oxide Synthase Activation through Upregulating PTEN or Inhibiting Akt Kinase,” Diabetes, Vol. 55, No. 8, 2006, pp. 2301-2310.
- S. M. Bahijri, E. M. Alissa, D. H. Akbar and T. M. Ghabrah, “Estimation of Insulin Resistance in Non-Diabetic Normotensive Saudi Adults by Quicki, Homa-Ir and Modified Quicki: A Comparative Study,” Annals of Saudi Medicine, Vol. 30, No. 4, 2010, pp. 257-264. doi:10.4103/0256-4947.65252