Open Journal of Epidemiology
Vol.3 No.2(2013), Article ID:31839,9 pages DOI:10.4236/ojepi.2013.32008
Effects of air pollution on the risk of acute myocardial infarction in Charleroi, Belgium*
![]()
1Research Center in Epidemiology, Biostatistics and Clinical Trials, School of Public Health, Université Libre de Bruxelles (ULB), Brussels, Belgium
2Research Center in Environmental Health, School of Public Health, Université Libre de Bruxelles (ULB), Brussels, Belgium
Email: #yves.coppieters@ulb.ac.be
Copyright © 2013 Yves Coppieters et al. This is an open access article distributed under the Creative Commons Attribution License, which permits unrestricted use, distribution, and reproduction in any medium, provided the original work is properly cited.
Received 8 March 2013; revised 10 April 2013; accepted 18 April 2013
Keywords: Ischaemic Cardiopathies; Air Pollution; Environmental Risk; Belgium
ABSTRACT
Atmospheric pollution would increase morbidity and mortality rates for various respiratory illnesses in urban areas, and could also be an explanatory factor of higher rates of myocardial infarction in Charleroi compared with the other Belgian cities. The present study investigates the health effects of acute exposure to air pollution on cardiovascular morbidity/mortality in Charleroi. The study is based on comparing hospital data taken from the registry of ischaemic cardiopathies in Charleroi (1999 to 2008) to data on the air quality in this region. To measure the association between atmospheric pollution and the number of cases of myocardial infarction, Poisson regression was carried out. The excess risk of myocardial infarction was analysed according to the month of admission. For men, a decrease in the attack rate of myocardial infarction is visible during the first three years of the study, later to remain stable. For women, attack rates are stable throughout the study. Most of the pollutants vary according to season. Except for ozone, concentrations are generally higher in winter. We observe an association between the concentrations of PM10 and NO2 and morbidity/mortality by acute myocardial infarction. The increased risk for an increase of 10 µg/m3 of pollutant is 1.8% for PM10 and 4.0% for NO2. Multivariate models must still be developed and applied to our data.
1. INTRODUCTION
Analysis of the relation between atmospheric pollutants and health problems is complex both as regards methodological approaches and the difficulties in approaching data often collected with very different purposes. Major pollutants in the atmosphere are fine particles, CO2, hydrocarbons, NOx, CO and SO2 [1]. One difficulty is; therefore, the consideration of the multiple and varied exposures which are dependent on the time spent inside and outside, active or passive smoking, professional exposure, nutrition, sensitivity and individual sociodemographic characteristics among others. Furthermore, meteorological conditions can have a considerable effect on atmospheric pollution (example: Meuse Valley in 1931 [2]) and have significant consequences on health. However, since a few years ago, researchers who adopt rigorous methodological approaches have analysed the effects of pollutants on mortality and respiratory and cardiovascular morbidity. Thus some European and North American studies confirm that an increase in exposure to an average of PM10 particles of 10 µg/m³ over one year translates into an increase of 16% to 20% of the global mortality rate and an increase of more than 40% in the mortality rate by infarction (aggravated by the other major cardiovascular risk factors) [3-5]. Exposure to shortterm peaks of ozone (O3) also increases the risk of cardiovascular pathologies in adults from 35 to 64 years of age [6].
Currently, air quality is regulated by European directives that aim in particular at setting ambient air quality targets and assessing air quality on a European scale [7]. In Wallonia, air quality is watched by a network of 22 telemetry stations. According to the site, the pollutants measured are SO2, NOx, O3, CO and suspended particles (PM10 and PM2.5) [7].
1.1. Atmospheric Pollution/Health Studies in the Walloon Region
A network of cities was set up on a European level to experiment and apply an epidemiological surveillance tool regarding air pollution (APHEIS). This network pursued and refined its work in several successive projects to assess the contribution of atmospheric pollution to the prevalence of respiratory disease. In Belgium, the APHEIS/EN APHEIS/EN HIS-1 version of the tool was tested within the framework of the National Environmental Health Action Plan (NEHAP) for Belgium at the request of the Ministerial Conference on the Environment and Health in 3 urban areas in Belgium (Liège, Brussels-capital and Antwerp). The study analyses environmental (concentration of PM10 and of ozone) and health data for 2004. The work concluded the feasibility of this type of study for urban areas in Belgium [8]. The last project (APHEKOM) concerned a wider range of health effects such as effects on cardio-respiratory disorders [9].
1.2. The Charleroi Ischaemic Cardiopathies Registry
This health information tool has worked in a standardized way for 27 years. All suspected cases of infarction are detected by a system involving all the hospitals of the entity capable of hospitalizing patients living in Charleroi that have undergone an acute coronary event [10-12]. This research aims at using this registry as a source of data validated according to a standardized protocol MONICA (Monitoring of Trends and Determinants in Cardiovascular Diseases) of coronary accidents and to quantify the short-term link between atmospheric pollution and the risk of myocardial infarction over a period of 10 years.
2. METHODOLOGY
2.1. Air Pollution Data
Concentrations of pollutants (PM2.5, PM10, O3, SO2, NO2, CO) were supplied by the Walloon Air and the Climate Agency (AWAC). The data of 5 telemetric measuring stations were analysed to calculate average concentrations. The normality of variables was visually assessed by means of a normal probability plot. As most daily averages of pollutants are not normally distributed, the nonparametric statistics (medians, percentiles and interquartile range) are presented. However, for comparison with European standards, the averages were also calculated. The comparisons of medians were performed using a Kruskal-Wallis test.
2.2. Myocardial Infarction Data
The methodology is based on the precise criteria defined within the framework of the MONICA protocol for the detection of cases (fatal and non-fatal). Classification of the events (myocardial infarction) is carried out using an algorithm based on three diagnostic criteria: symptoms (the pain felt by patients), cardiac enzymes (the dosage of enzymes, troponins in particular), and electrocardiogram (the ECG reading). The sources of data for the hospitalized patients came from 7 hospitals of the study region.
Since 1998, minimum clinical data (MCD) have allowed additional validation of every suspected case by using the codes of the International Statistical Classification of Diseases and Related Health Problems ICD: 410 - 414 (ischemic heart disorder). For fatal cases, the tenth revision of the ICD is used at present. Death certificates are collected by the Wallonia Brussels federation. All death certificates are validated and verified against the hospital databases and the certificates of the emergency medical aid service (SMUR).
The age variable was grouped into 4 categories (25 - 44, 45 - 54, 55 - 64 and 65 - 69 years). Analyses were carried out for a period of 10 years from 1999 until 2008 and are presented in five periods of two years (1999- 2000, 2001-2002, 2003-2004, 2005-2006, and 2007-2008). Certain analyses were spread to the 70 - 74 years category for the 2004-2008 period.
The evolution of attack rates was taken from community data (hospitalized cases and non-hospitalized cases). The descriptive statistics (proportions, medians and interquartile range) were used to describe the sample. Pearson’s chi2 test and the Kruskall-Wallis test were used to compare percentages and age respectively.
Fatal attack rates correspond to all the cases of infarcttion in which death occurred within 28 days of the coronary event. Attack rates were standardized (direct standardization) in comparison with the population of 2004. These analyses were performed on all hospitalized and non-hospitalized cases.
2.3. Measures of Association between Atmospheric Pollution and Myocardial Infarction
To measure the association between atmospheric pollution and the number of cases of myocardial infarction, Poisson regression was carried out. Non-dispersal of the data was verified (mean, variance). In the case of suspected overdispersion, the results were confirmed using robust Poisson regression or by negative binomial regression. A chi2 test was performed to verify the goodness of fit of the data. Graphs of the number of cases of infarction according to pollutant concentration categorized in 25-quantiles were also plotted. The excess risk of myocardial infarction was analysed according to the month of admission. The cold months are December, January and February; the warm months are June, July and August. The tests were considered statistically significant when the p-value was lower than 0.05. The statistical analyses were performed using Stata 10.1 software (StataCorp LP, TX, United States) or R version 2.15.0 (R Foundation for Statistical Computing).
3. RESULTS
3.1. Analyses of Atmospheric Pollution and the Environmental Data
Except for PM2.5 and ozone, the number of missing data concerning the average of the various stations is lower than 10 a year and lower than 20 for all 11 years (on 1999 in 2009). For ozone, measured only at one station, the number of missing data reached 56 in 2003 and the total is 239 for all 11 years. PM2.5 was only analysed in 2008 and 2009.
During the period of the study, the annual limit value of 40 µg/m3 for PM10 is surpassed in 2003, 2006 and 2007. For this pollutant, the authorized number of exceedances of the daily limit value was surpassed from 1999 to 2007. The years 2008 and 2009 seem markedly less polluted as regards PM10 with average concentrations of about 25 µg/m3 and less than 35 exceedances. This improvement is in accordance with the closure of a polluting enterprise and a review of environment licences (obligation for certain companies to install filters in chimneys). The European standards are observed for the other pollutants.
The concentration of ozone seems stable during the study period whereas a slight decrease is noticed for nitrogen dioxide and carbon monoxide. A net decrease in the concentration of sulphur dioxide is observed. This concentration fell from about 10 µg/m3 for 1999-2001 to approximately 3 µg/m3 for 2005-2009 (Table 1). Having only been analyzed since 2008, it is difficult to draw conclusions on the evolution of the concentration of PM2.5.
The long-term trends of the association between myocardial infarction and the concentration by polluting are confirmed by the graph and by linear regression. The standardized coefficients of regression are 0.09, 0.02, 0.12, 0.23 and 0.43 respectively for PM10, ozone, nitrogen dioxide, carbon monoxide and sulphur dioxide. These coefficients thus confirm the strongest decrease in the concentration of sulphur dioxide.
The warmest months are June, July and August with median temperatures of 16.3˚C, 17.7˚C and 17.1˚C respectively. The coldest months are December, January and February with median temperatures of 3.7˚C, 4.4˚C and 4.4˚C respectively. With the exception of ozone, the concentrations of pollutants (PM10, NO2, CO and SO2) are higher during the cold months than during the warm months. These differences are statistically significant for all the analysed pollutants (Kruskall-Wallis test, p < 0.001) as well as for temperature (Table 2).
Most of the pollutants vary according to season. With the exception of O3, concentrations are generally higher in winter. This seasonal effect is a consequence of less favourable weather conditions for the dispersal of pollutants (example: temperature inversion phenomenon) but also greater emissions in winter than in summer [4].
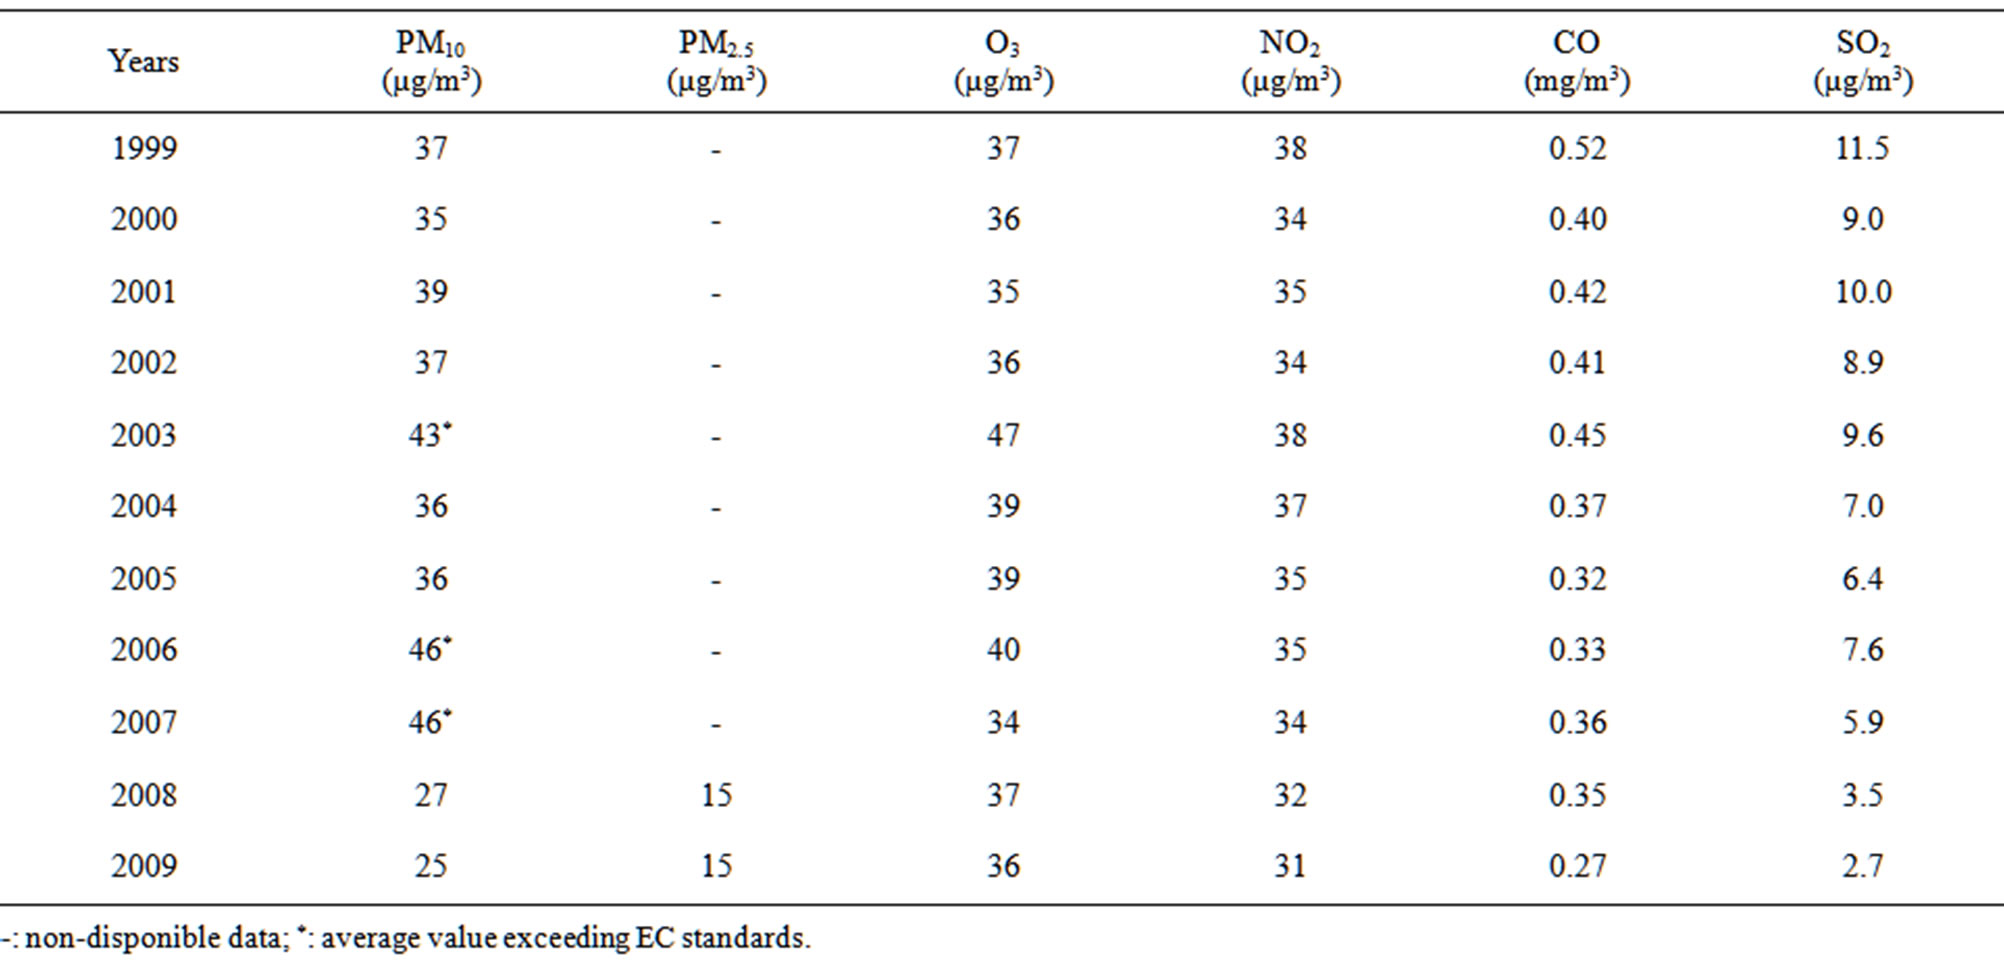
Table 1. Average values in pollutants in Charleroi (Walloon Region) according to the year.
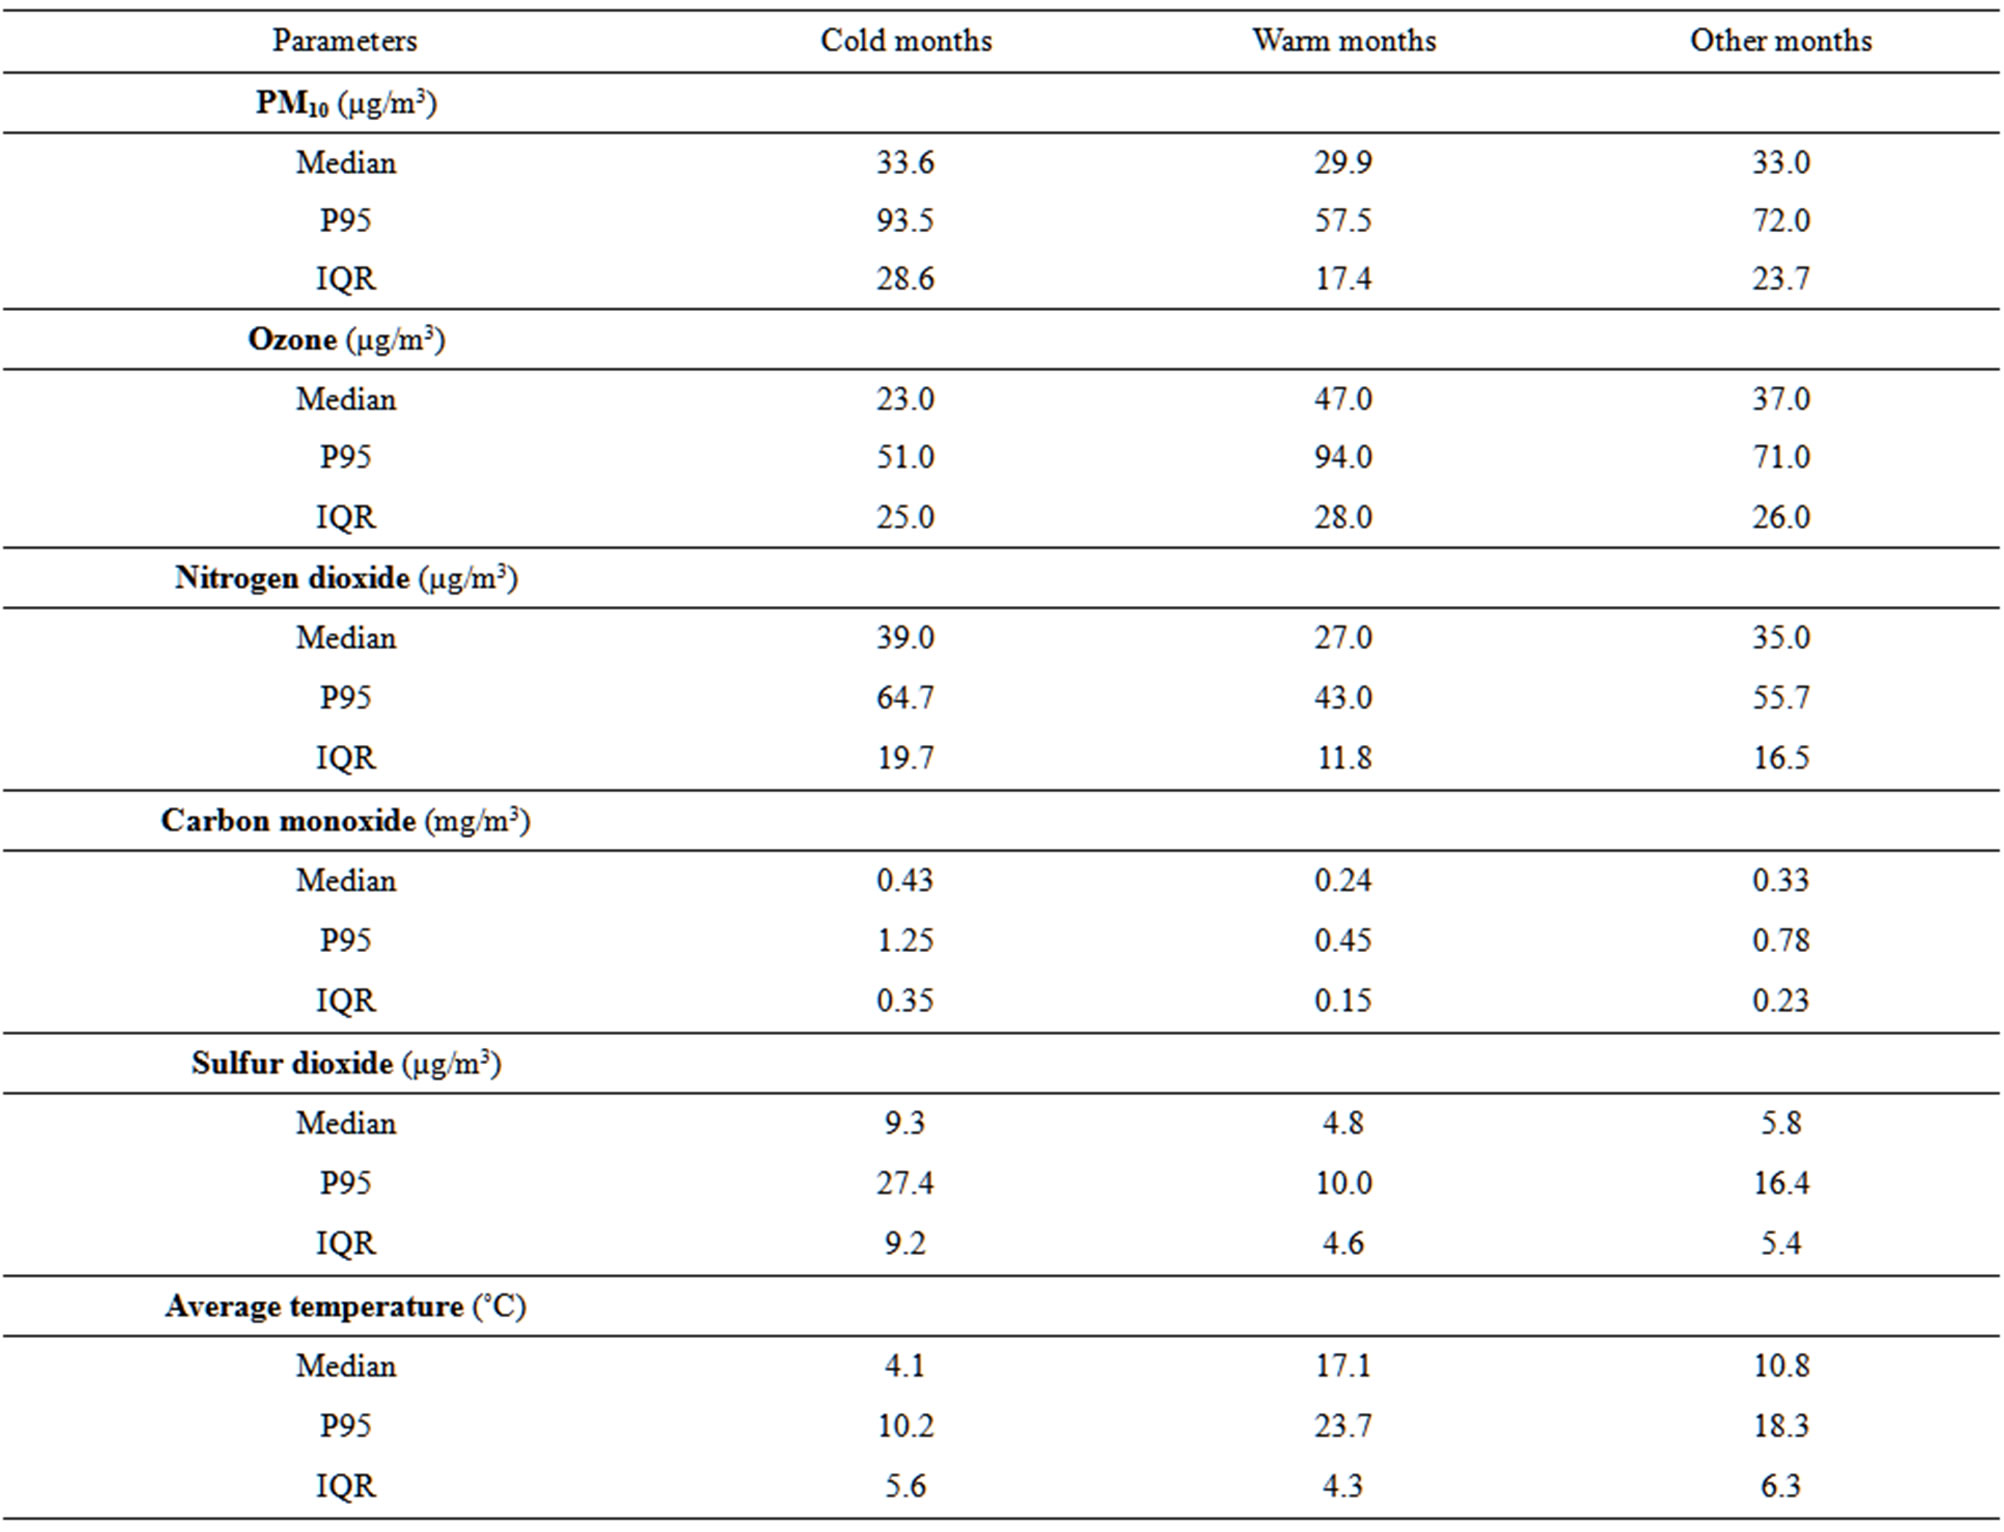
Table 2. Variation of the concentrations in pollutants and meteorological parameters according to the season.
3.2. Analyses of Morbidity/Mortality by Myocardial Infarction in Charleroi
The data of 3139 community myocardial infarctions were analysed in five periods of two years to cover the period ranging from 1999 until 2008 (Table 3).
The median age of the cases is 57 years (IQR: 16 years). Women represent 25.5% [CI 95%: 24.0; 27.1] of all myocardial infarctions. The percentage of women as well as their median age remained stable over the ten years. At the time of the coronary event, women are older, on average, than men [60 against 56 years, p < 0.001]. With the exception of the first period of analysis, a higher proportion of cases is observed for the 55 - 64 years age group. The analysis of attack rates (fatal and non-fatal) shows an increase according to age category with significant disparity between men and women. Men present very high rates in the 55 - 64 years age range and even more so in the 70 - 74 years range. Women also present high rates in the 65 - 69 years and 70 - 74 years age categories (Table 4).
Table 4 presents the evolutions of standardized attack rates for men and women from 1999 to 2008. Myocardial infarction attack rates decrease over 10 years both for men and women. Although the attack rate in women remains systematically lower by more than 50% in comparison with men, we observe a slower decrease in this category over time (from 14.2 to 10.4 per 10,000 inhabitants from 1999 to 2008). In men, the rates of attack remain high (between 27.6 and 22.4 per 10,000 inhabitants from 1999 to 2008) in spite of a progressive year-on-year decrease.
3.3. Association between Morbidity/Mortality and Pollution
A simple graphic approach does not allow us to demonstrate an association between number of cases of myocardial infarction and atmospheric pollution (Figure 1).
Indeed, seasonal changes are observed for the variations in pollutant but not for health data. Having applied Poisson regression with the number of cases of myocardial infarction as a dependent variable and pollutant concentration (univariate analysis, that is, every pollutant
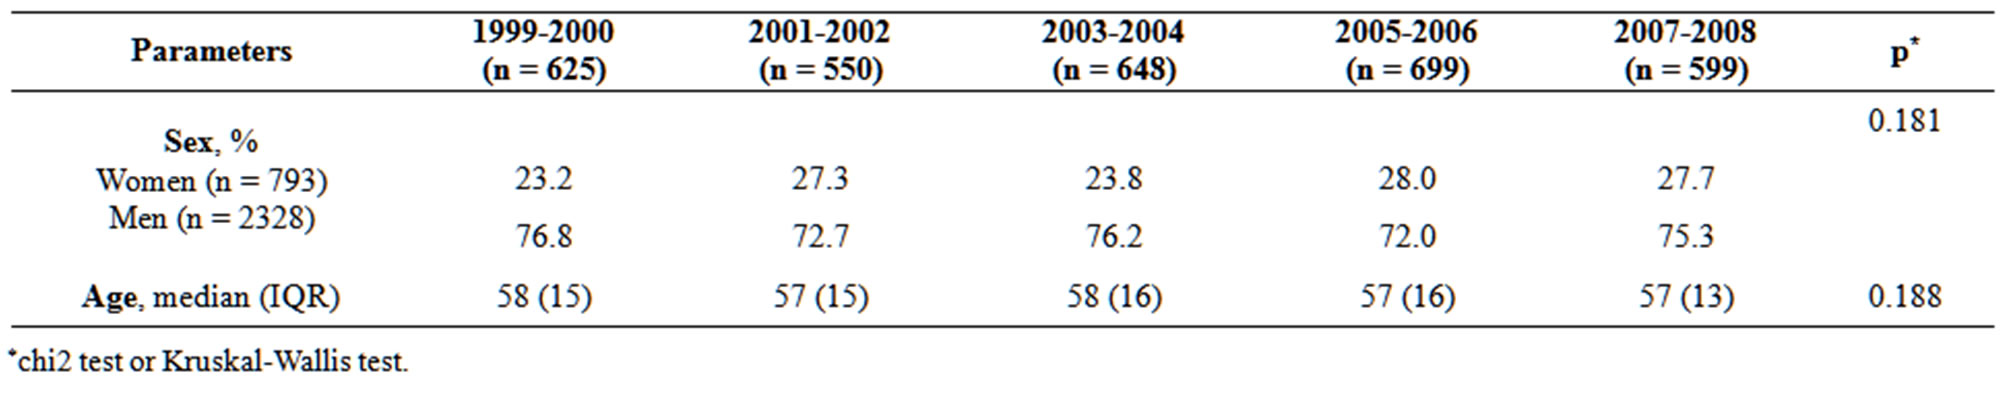
Table 3. Sociodemographic characteristics of patients for period from 1999 to 2008 (n = 3121).
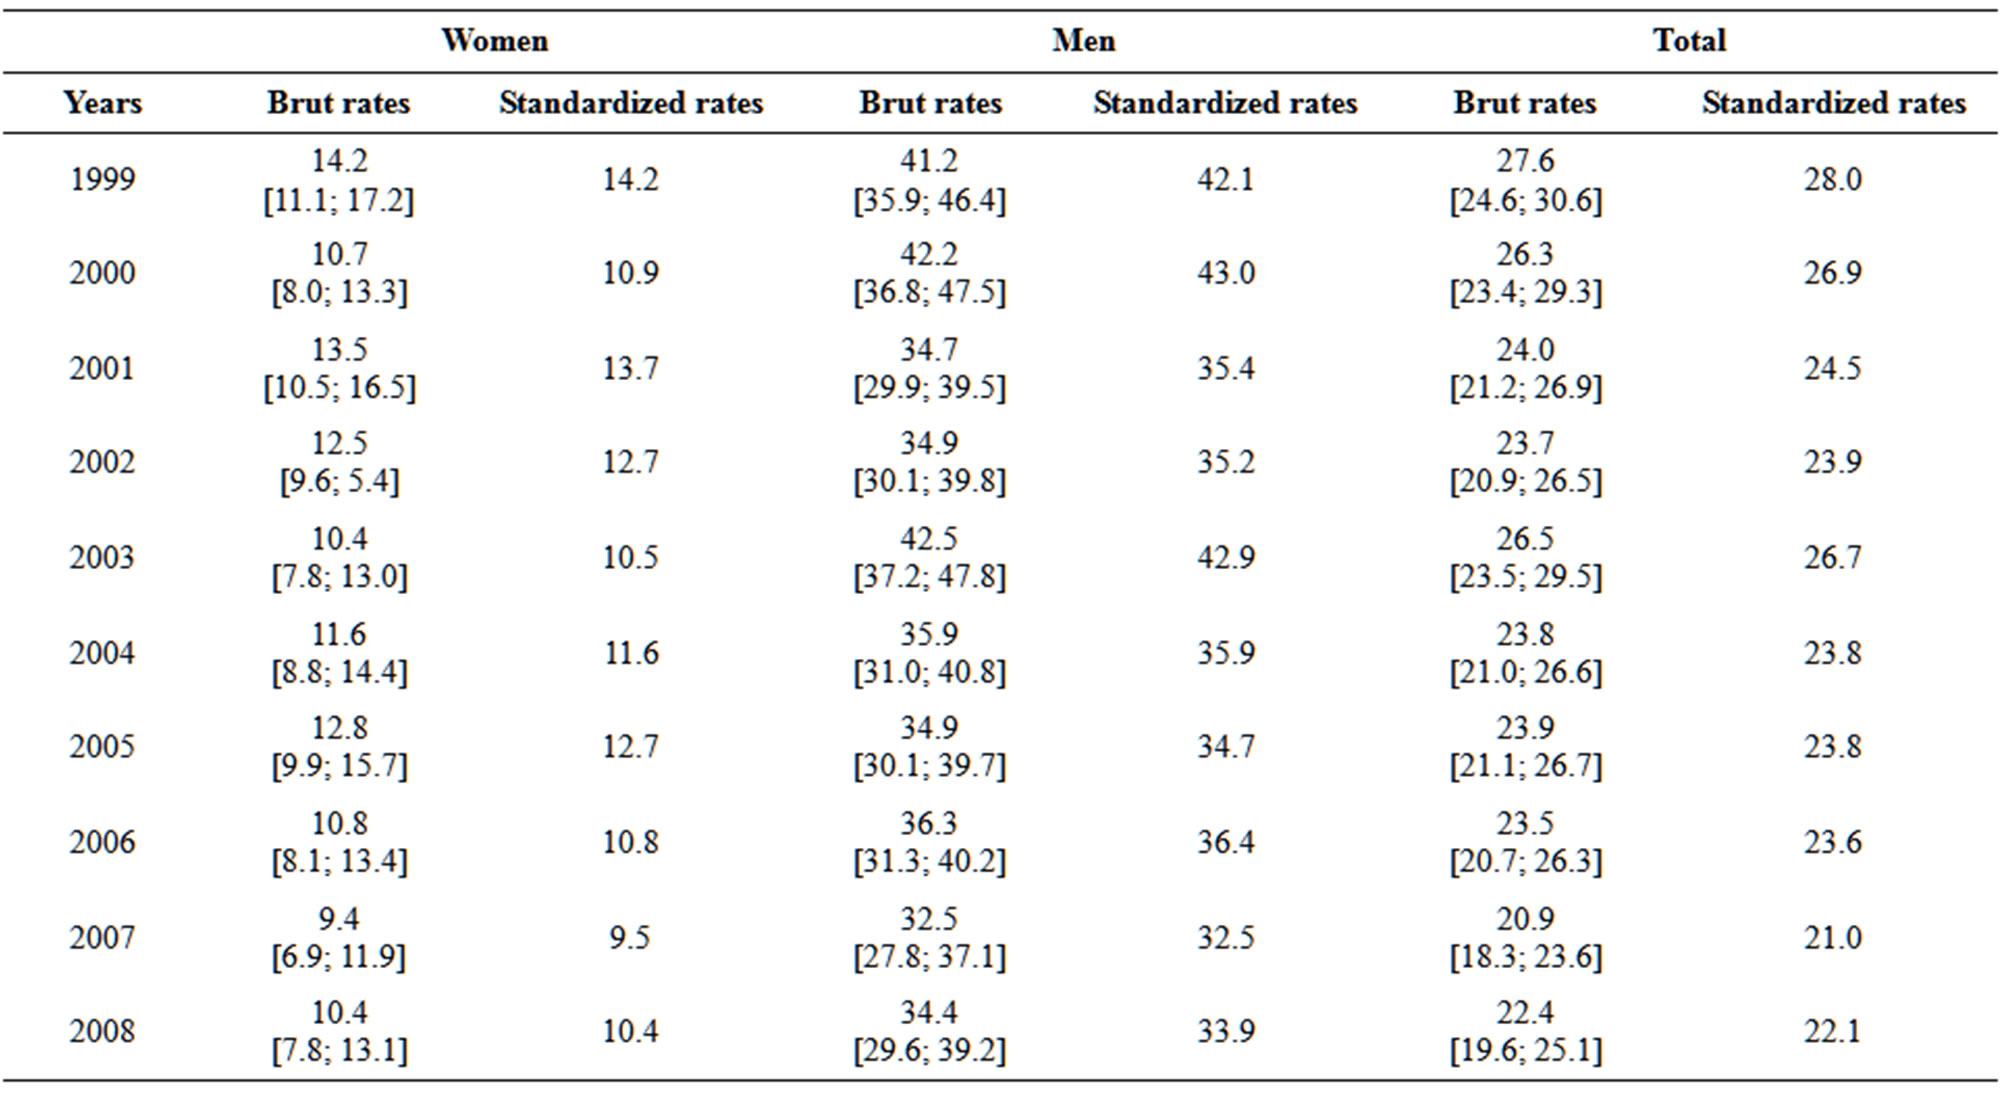
Table 4. Evolutions of attack rates by sex (rate for 10,000 inhabitants). Global and standardized rates age.
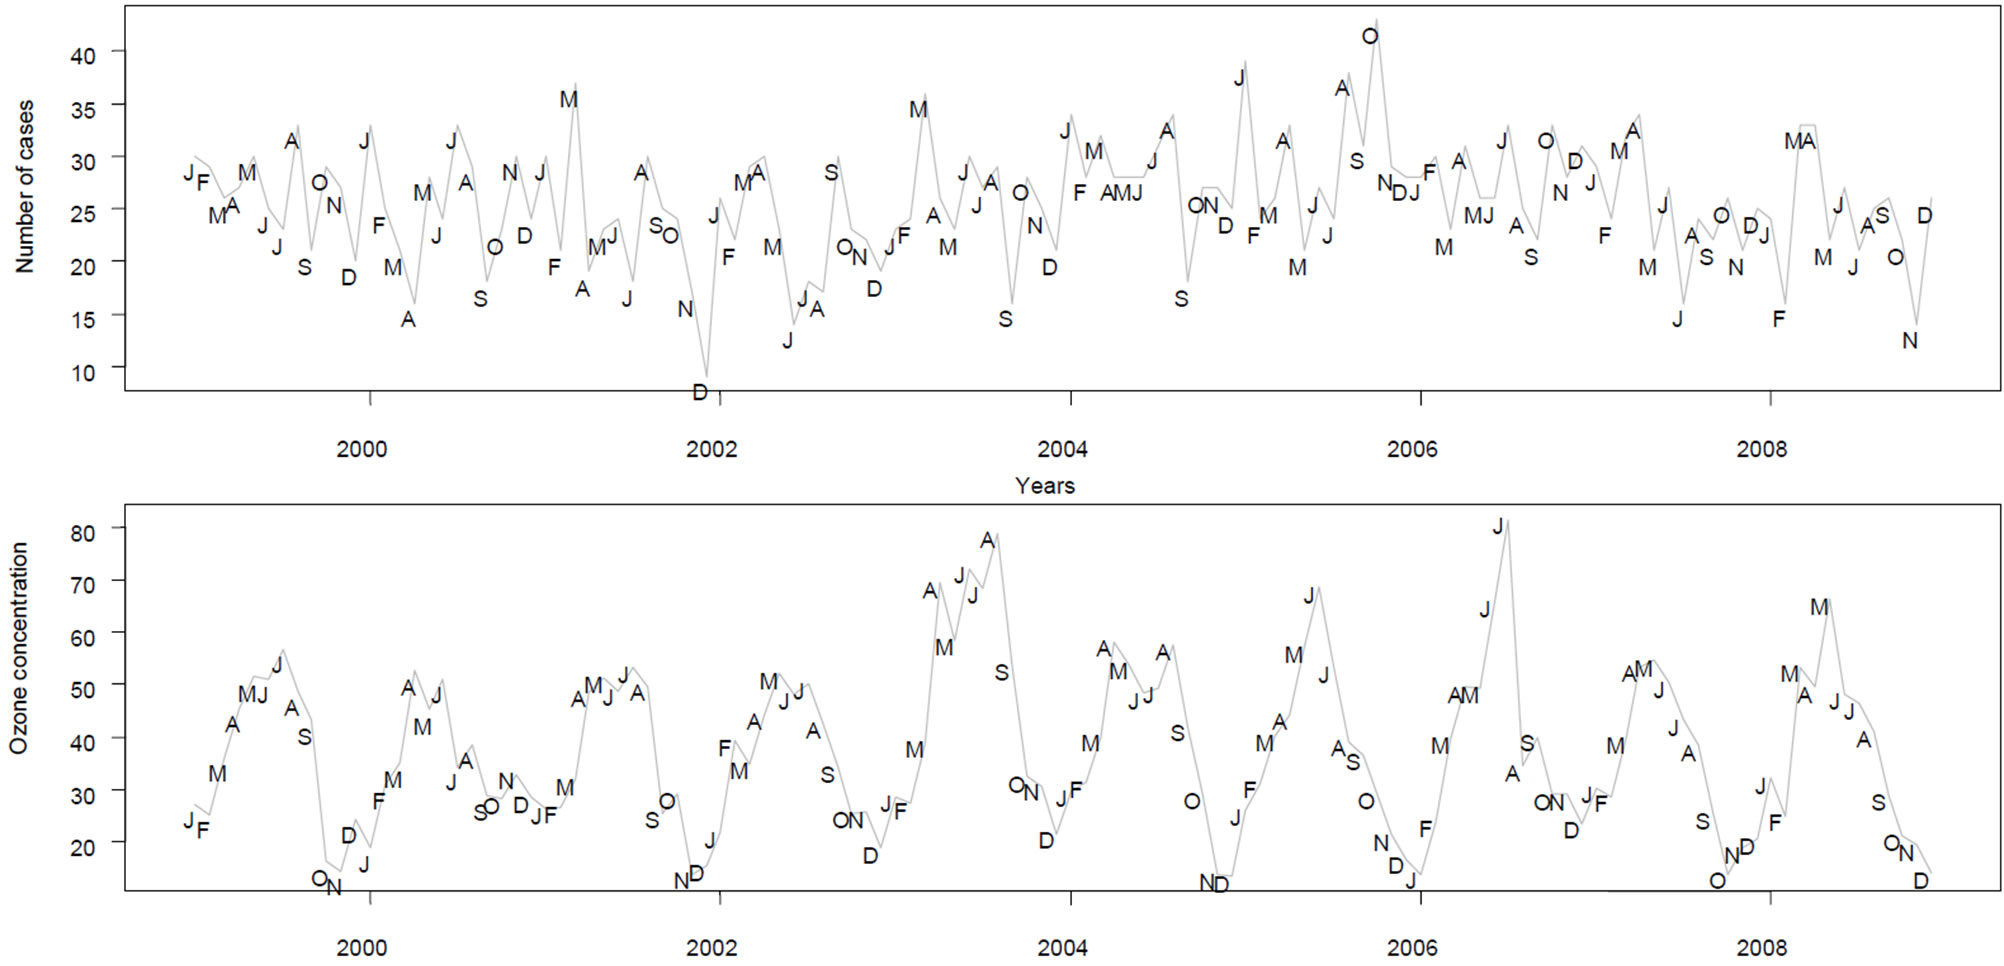
Figure 1. Number of case of ischaemic cardiopathies a month and ozone concentration.
taken one by one) as an independent variable, we observe an association between the concentrations of PM10 and of NO2 and morbidity/mortality by acute myocardial infarction (analysis over the whole year). The increased risk for a rise of 10 µg/m3 of pollutant is 1.8% for PM10 and 4.0% for the NO2. It would seem important to note that during the cold months, except for ozone, all excess risks strongly decreased. On the other hand, for the warm months, all excess risks increased, except for SO2 (Table 5).
Graphic representations of the correlations for the whole year are presented in Figure 2. These graphs show a positive association between the number of cases of myocardial infarction and the concentration of PM10 and NO2. For the concentrations of O3, CO and SO2, the absence of association is confirmed by this visual representation.
4. DISCUSSION
The establishment of environmental and health databases has allowed us to study the link between atmospheric pollutants and myocardial infarction in the largest city in Wallonia. The two sectors which emit most particles in the Walloon Region are industry and road transport. Walloon particle emissions have decreased in recent years. This reduction is probably explained by the closure of companies, the installation of filter systems or even the introduction of stricter standards [13].
Several studies confirm that the number of hospital admissions due to heart disorders and mortality increase in on days with high concentrations of SO2 [14,15]. The decrease in concentrations of SO2 can be explained mainly by the decrease of the sulphur content of diesel and heavy fuel oil, as well as by the increasing use of natural gas. Our study confirms the greater risk of myocardial infarction according to various pollutants for the warm months (except for SO2). Concerning NO2 for which excess risk is the highest both for the whole year and for the warm months, this association is also found in a British study which has shown on a database of myocardial infarction (records from 2003 to 2006) that based on mono-polluting models, high levels of NO2 are associated with a greater risk of myocardial infarction within six hours following the peak of pollution (excess risk 1.1%; CI 95% [0.3 - 1.8] respectively due to an increase in the concentration of pollutants of 10 µg/m³ [16]. The same excess risk is found for PM10 following the same increase in the concentration of pollutants [17]. Our environmental data show, however, a reduction in the average annual concentrations of NO2. The main factors which allow us to explain the decrease of the emissions of NOX (NO2 + NO) in Charleroi are a 50% reduction in transport emissions (catalytic converters), the closure of steel works, and modifications industrial processes (electricity producer, chemical industry and cement works) [13].
Our study does not show an association between short term rises in O3 and excess risk of myocardial infarction when the analysis is performed on the entire year. New methodological approaches were developed to test the effects of exposure to O3 in young people without any cardiac pathology. It demonstrates that for these people, the excess of O3 increases the markers of vascular inflammation, distorts the capacities of fibrinolyse, and modifies the autonomic cardiac control. These modifications put the exposed individuals in danger and present a plausible biological explanation to the link found between exposure to O3 and increased cardiovascular and overall mortality [18].
The positive association between myocardial infarcttion and PM10 is confirmed in our study (specifically for the warm months) and is described in numerous publications. A recent study shows that all of the pollutants usually included in this type of analysis, except ozone, have a negative effect on cardiovascular health [19]. A study carried out in Flanders showed that the association between PM10 concentrations and mortality was much stronger during the warm months than during the cold months [20].
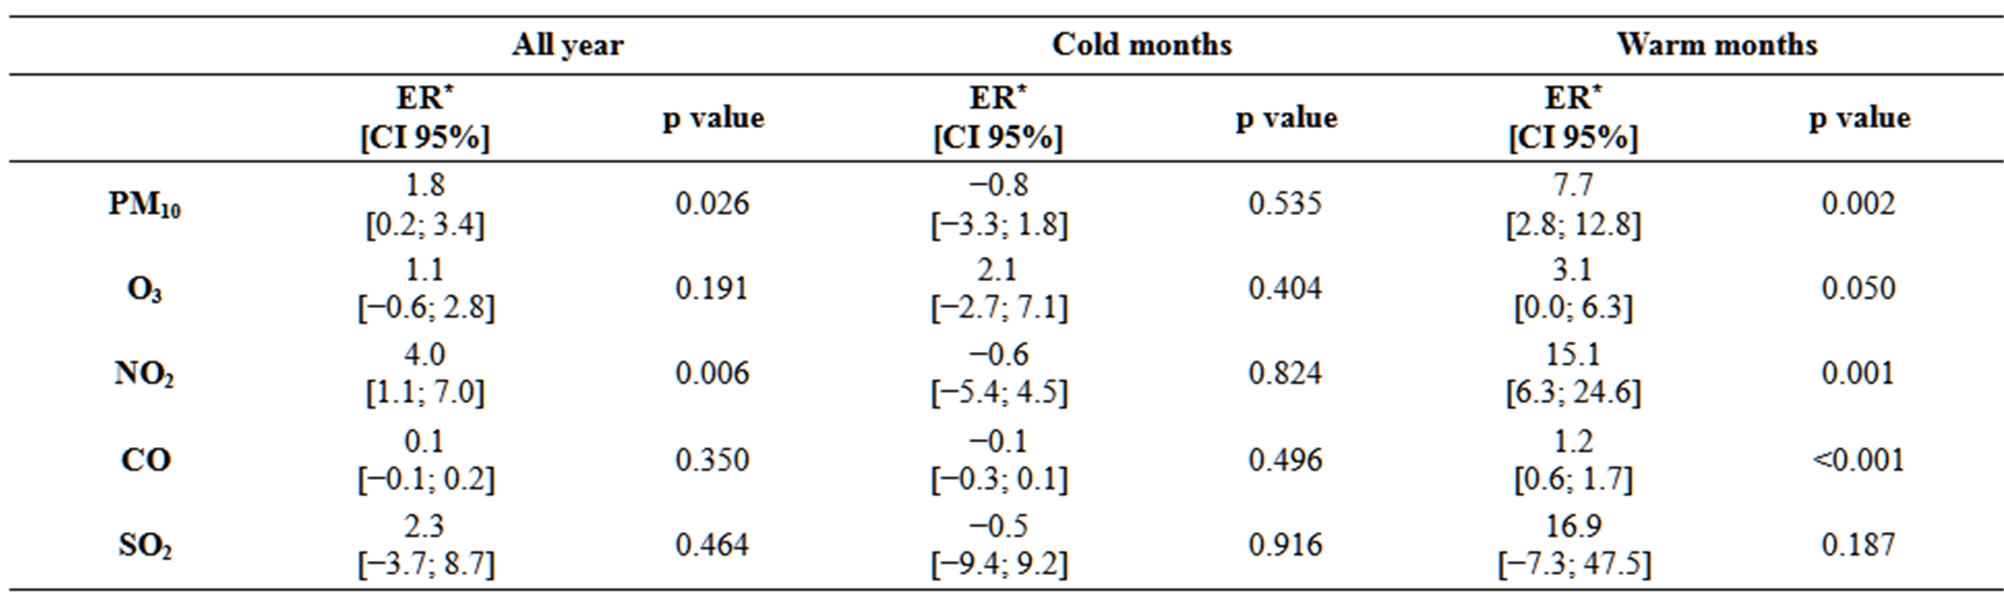
Table 5. Poisson regression: measure of the excess of risk between atmospheric pollutants and the myocardial infarction.
*ER: excess risk (%).
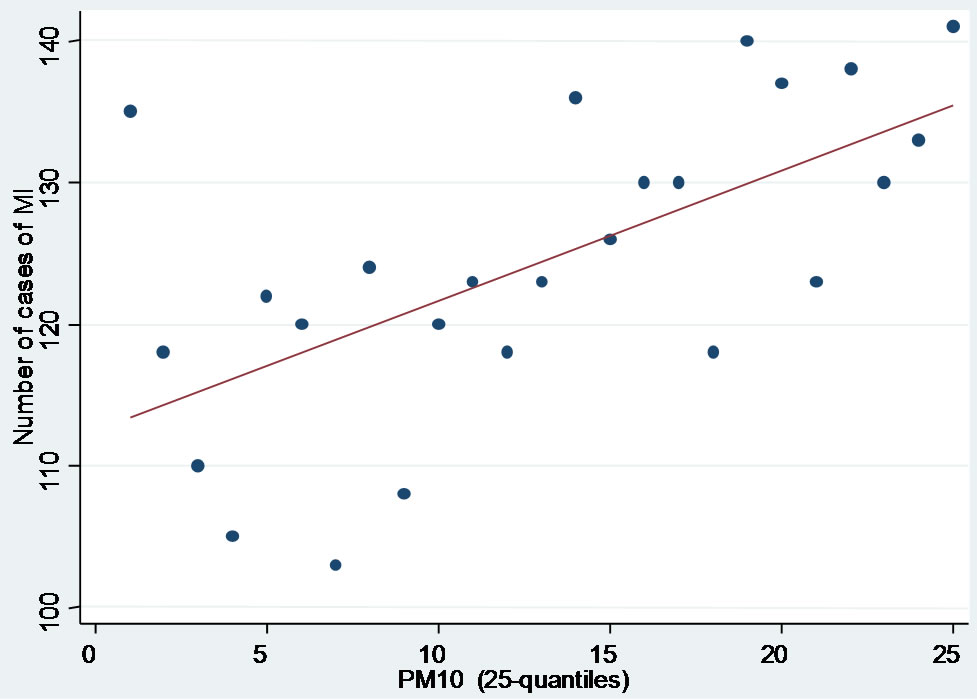

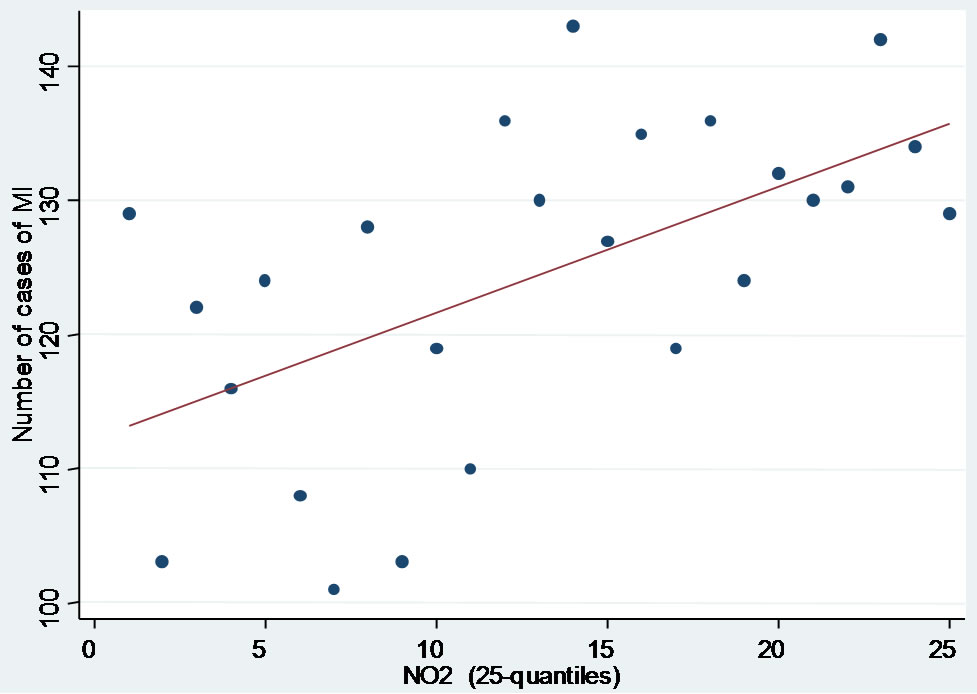
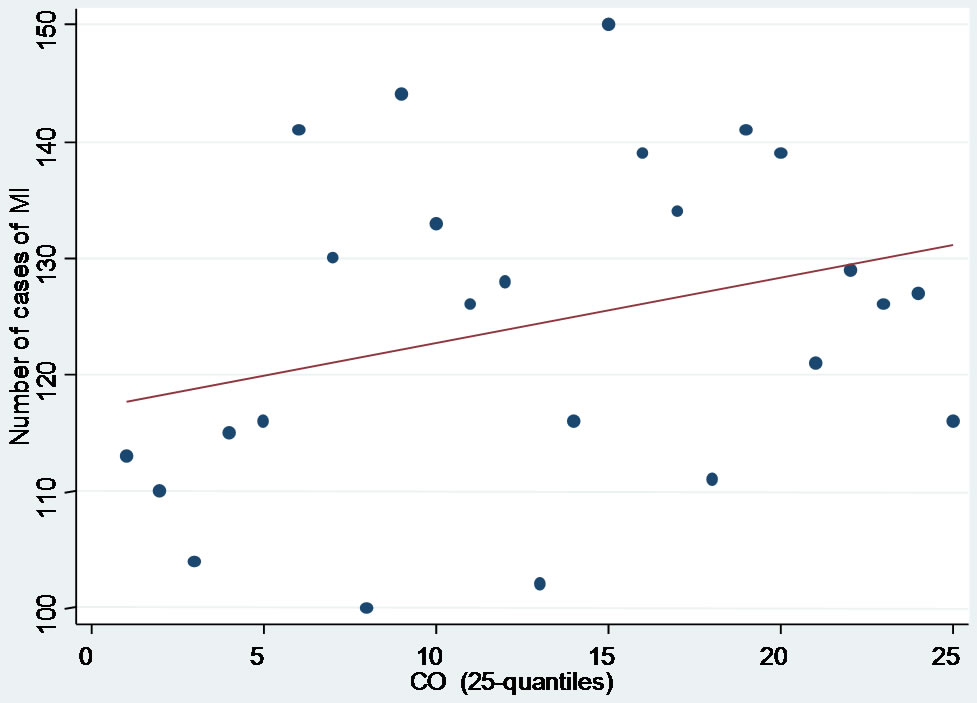
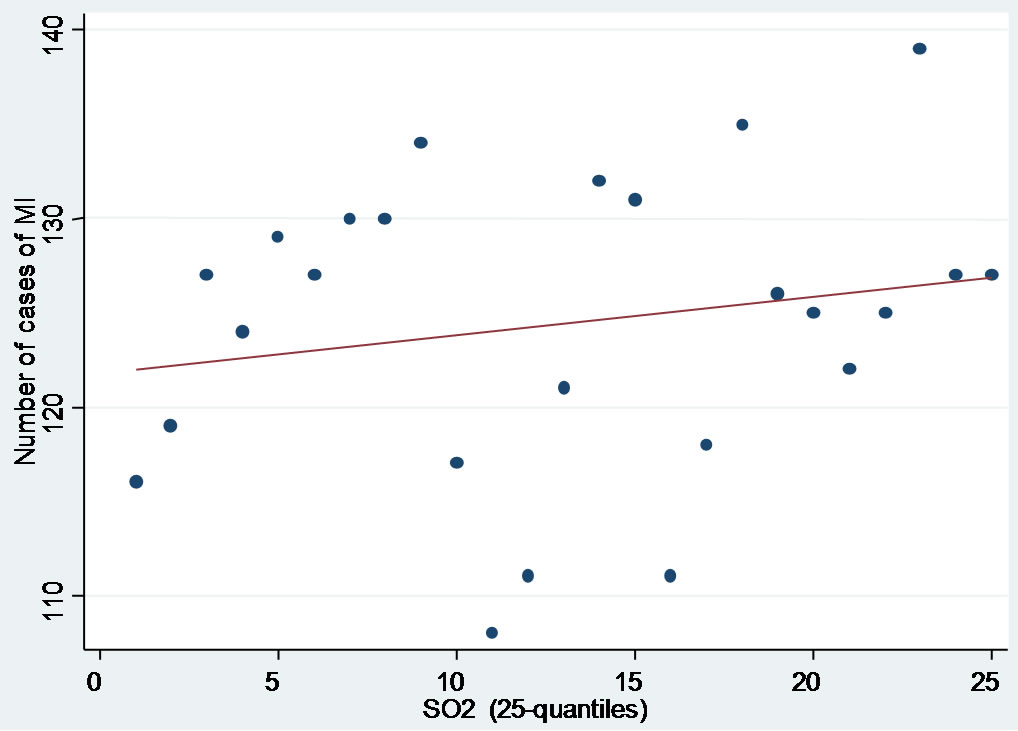
Figure 2. Association between myocardial infarction and the concentration by polluting categorized by their 25-quantiles.
It is difficult to draw any definitive conclusions at this stage of the study. Indeed, multivariate models (including the day of the week, humidity, flu epidemics) or multi-polluting models must still be developed and applied to our data. We must design case crossover models or generalized additive models to analyse the cases of myocardial infarction registered since 1983 compared with the levels of O3, CO, NO2, SO2 and PM10.
In Charleroi, we estimate an excess of myocardial infarction of over 50% compared with the north of the country and of cities such as Ghent [21], for example. Charleroi is the biggest urban area in the Walloon Region with low socioeconomic conditions and particular industrial development.
It has also been demonstrated that the classical cardiovascular classic risk factors, smoking, overweight, a sedentary way of life, are found more frequently in the south of the country (Walloon Region) compared to the north of the country (Ghent, for example), and this partially explains the observed north-south differences. Thus it will be necessary in the future to add to these analyses the weight of atmospheric pollution on the coronary pathology compared to the environmental specificities (social, economic, cultural and physical) of the population of this urban area.
5. ACKNOWLEDGEMENTS
This study was financed by the Walloon Region (Ministers of Health and the Environment) within the framework of a study on the impact of the acute exposure of the atmospheric pollution on the cardiovascular morbidity/mortality in Charleroi.
REFERENCES
- Bliefert, C. and Perraud, R. (2009) Chemistry of the environment: Air, water, soil, waste. De Boeck.
- Nemery, B., Hoet, P. and Nemmar, A. (2001) The Meuse Valley fog of 1930: An air pollution disaster. Lancet, 357, 704-708. doi:10.1016/S0140-6736(00)04135-0
- Peel, J.L., Metzger, K.B., Klein, M., Flanders, W.D., Mulholland, J.A. and Tolbert, P.E. (2007) Ambient air pollution and cardiovascular emergency department visits in potentially sensitive groups. American Journal of Epidemiology, 165, 625-633. doi:10.1093/aje/kwk051
- Pope 3rd, C.A., Thun, M.J., Namboodiri, M.M., Dockery, D.W., Evans, J.S., Speizer, F.E. and Heath Jr., C.W. (1995) Particulate air pollution as a predictor of mortality in a prospective study of US adults. American Journal of Respiratory and Critical Care Medicine, 151, 669-674. doi:10.1164/ajrccm/151.3_Pt_1.669
- Maheswaran, R., Haining, R.P., Brindley, P., Law, J., Pearson, T., Fryers, P.R., et al. (2005) Outdoor air pollution, mortality, and hospital admissions from coronary heart disease in Sheffield, UK: A small-area level ecological study. European Heart Journal, 26, 2543-2549. doi:10.1093/eurheartj/ehi457
- Bhaskaran, K., Hajat, S., Haines, A., Herrett, E., Wilkinson, P. and Smeeth, L. (2009) Effects of air pollution on the incidence of myocardial infarction. Heart, 95, 1746- 1759. doi:10.1136/hrt.2009.175018
- Walloon Public Service (SPW) and the Walloon Agency for Air and Climate (AWAC) (2009) Networks monitoring of air quality. Scientific Institute of Public Service (ISSeP), Report, 40 p.
- Boldo, E., Medina, S., Le Tertre, A., Hurley, F., Mücke, H.G., Ballester, F., Aguilera, I., Eilstein, D. and Apheis Group (2006) Apheis: Health impact assessment of longterm exposure to PM2.5 in 23 European cities. European Journal of Epidemiology, 21, 449-458. doi:10.1007/s10654-006-9014-0
- Medina, S., Le Tertre, A. and Saklad, M. on Behalf of the Apheis Collaborative Network (2009) The Apheis project: Air pollution and health—A European information system. Air Quality, Atmosphere and Health, 2, 185-198. doi:10.1007/s11869-009-0050-2
- WHO Regional Office for Europe (1985) Targets for health for all. Copenhagen.
- Tunstall-Pedoe, H., Kuulasmaa, K., Amouyel P., Arveiler, D., Rajakangas, A.M. and Pajak, A. (1994) WHO MONICA Project. Myocardial infarction and coronary deaths in the World Health Organization. Circulation, 90, 583-612. doi:10.1161/01.CIR.90.1.583
- Coppieters, Y., Collart, P. and Levêque, A. (2012) Gender differences in acute myocardial infarction, twentyfive years registration. International Journal of Cardiology, 160, 127-132. doi:10.1016/j.ijcard.2011.04.012
- Public Service of Wallonia (2012) Executive management of agriculture, natural resources and environment. Dashboard of Walloon environment. http://etat.environnement.wallonie.be
- HEI Collaborative Working Group on Air Pollution, Poverty, and Health in Ho Chi Minh City, Le, T.G., Ngo, L., Mehta, S., Do, V.D., Thach, T.Q., Vu, X.D., Nguyen, D.T. and Cohen, A. (2012) Effects of short-term exposure to air pollution on hospital admissions of young children for acute lower respiratory infections in Ho Chi Minh City, Vietnam. Research Report (Health Effects Institute), 5-72.
- Deger, L., Plante, C., Jacques, L., Goudreau, S., Perron, S., Hicks, J., Kosatsky, T. and Smargiassi, A. (2012) Active and uncontrolled asthma among children exposed to air stack emissions of sulphur dioxide from petroleum refineries in Montreal, Quebec: A cross-sectional study. Canadian Respiratory Journal, 19, 97-102.
- Bhaskaran, K., Hajat, S., Armstrong, B., Haines, A., Herrett, E., Wilkinson, P. and Smeeth, L. (2011) The effects of hourly differences in air pollution on the risk of myocardial infarction: Case crossover analysis of the MINAP database. British Medical Journal, 343, d5531. doi:10.1136/bmj.d5531
- Rosenlund, M., Bellander, T., Nordquist, T. and Alfredsson, L. (2009) Traffic-generated air pollution and myocardial infarction. Epidemiology, 20, 265-271. doi:10.1097/EDE.0b013e318190ea68
- Devlin, R.B., Duncan, K.E., Jardim, M., Schmitt, M.T., Rappold, A.G. and Diaz-Sanchez, D. (2012) Controlled exposure of healthy young volunteers to ozone causes cardiovascular effects. Circulation, 126, 104-111.
- Nuvolone, D., Balzi, D., Chini, M., Scala, D., Giovannini, F. and Barchielli, A. (2011) Short-term association between ambient air pollution and risk of hospitalization for acute myocardial infarction: Results of the cardiovascular risk and air pollution in Tuscany (RISCAT) study. American Journal of Epidemiology, 174, 63-71. doi:10.1093/aje/kwr046
- Nawrot, T.S., Torfs, R., Fierens, F., De Henauw, S., Hoet, P.H., Van Kersschaever, G., De Backer, G. and Nemery, B. (2007) Stronger associations between daily mortality and fine particulate air pollution in summer than in winter: evidence from a heavily polluted region in western Europe. Journal of Epidemiology & Community Health, 61, 146-149. doi:10.1136/jech.2005.044263
- De Henauw, S., De Bacquer, D., de Smet, P., Kornitzer, M. and De Backer, G. (1999) Trends in coronary heart disease in two Belgian areas: Results from the MONICA Ghent-Charleroi study. Journal of Epidemiology & Community Health, 53, 89-98. doi:10.1136/jech.53.2.89
NOTES
*The authors declare that they have no conflict of interest.
#Corresponding author.