Open Journal of Civil Engineering
Vol.06 No.02(2016), Article ID:64474,11 pages
10.4236/ojce.2016.62009
Traffic Regulation at Critical Intersections: A Case Study of Odole Intersection, Akure, Ondo State, Nigeria
Olumuyiwa Samson Aderinola, David Oladotun Owolabi
Department of Civil and Environmental Engineering, Federal University of Technology, Akure, Nigeria

Copyright © 2016 by authors and Scientific Research Publishing Inc.
This work is licensed under the Creative Commons Attribution International License (CC BY).
http://creativecommons.org/licenses/by/4.0/


Received 14 December 2015; accepted 11 March 2016; published 14 March 2016
ABSTRACT
Traffic congestion on major roads consequent upon existing bottlenecks at intersections is a major problem in Akure Metropolis. To change this trend, this research was carried out in order to design effective traffic control mechanisms at the “troubled spots” in the metropolis. Odole intersection was identified as one of the critical intersections during a reconnaissance survey and as such, selected for study. Data on geometric features were collected using Oedometer and Google Earth software. Peak and off-peak traffic volume data were collected between 7:30 and 8:30 am and between 12.00 noon and 1.00 pm respectively every other day using Cine camera. Furthermore, discharge headway and delay data were collected using stop watch. The geometric and traffic data collected were analysed using Microsoft Excel. An appraisal of Odole Intersection indicated that the major contributors to traffic are Motorcycles (70.88%) and Passenger Cars (28.72%). Other modes of transportation account for about 0.4% of vehicles traversing the intersection. The critical traffic volume at the intersection was over 4000 veh/hr and the average delay was 22 seconds. An Average delay of 22 seconds at the intersection was an indication that the operating level of service was C (i.e. fairly stable traffic condition with average delays attributable to traffic control by personnel). By juxtaposing the results of geometric and traffic data analyses with the pros and cons of various traffic control mechanisms, traffic control by signalisation was selected and designed to suit Odole intersection. In tandem with the results of this research, appropriate measures have been recommended to ameliorate traffic and commuting problems in the metropolis.
Keywords:
Traffic Congestion, Traffic Data, Signalisation

1. Introduction
The history of man is tied to history of movement. Transportation is essential to social progress; transportation itself is a social progress because it has been, throughout history, the way in which not only goods and services are moved around but ideas are exchanged among people [1] . However, the roses of transportation might grind to a halt as a result of bottlenecks occurring at intersections. An intersection is a general area where two or more roads cross at the same or different elevations [2] . Interruption of traffic flow is a daily experience in urban centers of the world and it occurs primarily at intersections.
Road traffic jams continue to be a major problem in most cities around the world, especially in developing regions resulting in increased fuel wastage and monetary losses [3] . The forecast of Global Traffic Volume (GTV) shows that road traffic jams would quadruple between 1990 and 2050 [4] . This type of traffic growth pattern, as envisaged by the end of year 2050, is an indication of what the future congestions portends for people living in urban environment. Effective traffic control mechanisms are therefore pertinent to curb the menace. Traffic control mechanisms at intersections include prioritization, traffic personnel control, channelization, signalization, rotary intersections and by grade separation (interchanges). Each of the aforementioned control mechanisms has its areas of applicability and limitations.
When traffic flows at an intersection are relatively low, adequate control can be achieved using the priority option. As flow levels increase, with this intersection type, delays/queue lengths become excessive and some alternative form is required. While grade-separated junctions may be the preferred option at high flow levels, the expense involved may be prohibitive. For this reason, particularly in an urban setting, at-grade roundabouts or signalised intersections become viable junction options at levels of flow above those suitable for priority control [5] . If the cost of land is an important factor, traffic signals will be preferred since land requirements for a standard 3 or 4-arm conventional roundabout would be greater [6] . However, grade separation is justified when a full control of access is to be achieved on roads with intersections; where volumes to be catered for would require the design of an intersection at grade of unreasonable size; in accident prone regions. Grade separation could also be justified in situations whereby topography hinders the feasibility of other forms of control and when huge economic losses could be incurred due to intersectional frictions at grade [7] [8] .
2. Description of Study Area
Akure metropolis, used as the study site is the capital city of Ondo State and it is located in south western Nigeria (as shown in Figure 1). Ondo state was created in 1976 and shares boundaries with Ekiti and Kogi States in the north, Edo State in the east, Delta State and Atlantic Ocean in the South. Akure is located in the northern part of the state on latitude 7˚15'0"N and longitude 5˚11'42" and has an area of 30.02 square kilometres [9] .The city has a population of 340,021. The population growth rate in the metropolis is about 3.5% per annum [10] .
2.1. Climatic Characteristics of Akure Metropolis
The climate is hot and humid with two distinct seasons, the rainy and dry seasons. The rainy season lasts for seven months (April - October) and the dry season for five months (November - March). The rainfall is about 1524 mm per year and the atmospheric temperature ranges between 28˚C and 31˚C with a relative humidity of 80 percent [11] . Akure is located in the forest zone with abundant forest resources and it is drained by a major river called ‘Ala’
2.2. Transportation System in Akure Metropolis
Road transportation is the most predominant form of transport in Akure metropolis. It accounts for about 98 percent of all travel in the town. The city of Akure was not planned ab-initio and as a result of this, there is minimal functional relationship between the various land uses. Its poorly developed road network and inefficient traffic management techniques often create chaotic traffic pattern [12] . The traffic composition in the city is mixed comprising of motorcycles, taxis, minibuses, Lorries and trucks (trailers). However, the traffic composition of Akure metropolis is dominated by taxis, motorcycles and buses [13] . The intersection under consideration in this study (Odole Intersection) is cross intersection linking OkeAro (a densely built up area) and Arakale (a commercial nucleus).

Figure 1. Map of Nigeria showing Ondo state and Akure township road network [14] .
3. Methodology
3.1. Data Collection
Odole intersection was identified as one of the critical intersections during a reconnaissance Survey and as such, selected for study. Data on geometric features were collected at the intersections using Google Earth software. Geometric details measured include: major road width, minor road width, number of lanes on major road, number of lanes on minor road and angles of inclination of the minor approaches relative to the major route. Data on traffic volume and delay were collected at all approaches during peak (7:30 - 8:30 am) and off peak periods (12.00 noon and 1.00 pm)every other day during weekdays using Cine Camera mounted at a vantage position. Both flow pattern and vehicle classes were monitored. Vehicle classification count was carried out by counting and classifying vehicles as they pass with the aid of tally sheets while flow patterns were documented with due consideration given to diverging, merging and crossing movements to and from each approach using tally sheets while playing back the recorded video. Transportation modes considered include Bicycle, Motorcycle, Passenger Car, Bus, lorry, 2 Axle Truck, 3-Axle Truck, and 4-Axle Truck. The counts were broken down into four flow regimes of 15 minutes interval.
Furthermore, discharge headway data were collected at Odole Intersection using a split timer. It involved recording the successive times it took for vehicles to pass the stop point at the intersection when they are given the right of way. Delay was measured using stop watch by successively taking note of waiting time of the first vehicle that reaches an intersection at an occurrence of stoppage before having the right of way.
3.2. Data Analyses
The geometric and traffic data collected were analyzed using Microsoft Excel. The traffic and geometric data collected were utilized in appraising the intersection. Data on geometric features of each intersection were employed in identifying intrinsic geometric problems by comparing the data with standards. Vehicle classification and delay data were used in determination of the proportions of various classes of vehicle plying the intersections under study and Level of Service at the intersection respectively. Saturation headway and discharge lost time were obtained from discharge headway data. To obtain the critical flow pattern at the intersection, the critical hourly volume for each direction of movement in each approach was determined by obtaining the highest volume observed in each regime of flow (15 minutes) and multiplying by 4. Appropriate traffic control mechanism for Odole intersection was selected by juxtaposing the results of geometric and traffic data analyses with the pros and cons of various traffic control mechanisms. This process led to the choice of traffic control by signalisation.
3.3. Design of Traffic Signal
Peak and off peak traffic signal designs were carried out to cater for the appreciable difference in the peak and off-peak traffic flow patterns. The choice of the number of phases required for signalization was premised on the existing road geometry and volume of through traffic relative to turning movements of the critical lane. Critical lane volume for each phase was identified by considering the movement with highest traffic volume on the flow pattern diagram. Other parameter required for signal design is Saturation Flow which was calculated as the reciprocal of the Saturation Headway obtained from traffic studies. Finally, Cycle Time and Effective Green Time and Effective Red time were evaluated using appropriate equations.
The mathematical relationships for thedetermination of cycle length and apportioning of green time are as given thus:
 (1)
(1)
where hs is the saturation headway
 (2)
(2)
where:
Gi = Actual green time for phase i.
Yi = Duration of the yellow interval.
tLi = Total lost time during phase i.
 (3)
(3)
where:
N = Number of phases.
 = Sum of critical lane volumes.
 (4)
(4)
where:
Vcx = Critical lane volume for phase “x”.
 = Sum of critical lane volumes.
4. Results and Discussion
4.1. Geometric Configuration of Odole Intersection
Geometric features of Odole Intersection are presented in Table 1. The major road links are Arakale (North) to OkeAro (South). The minor road links are Gbangbalogun (East) to OdiOlowo (West). There are no inadequacies in the geometric features of the intersection, more so that the intersection is located on a relatively flat terrain.
4.2. Analysis of Traffic Composition of Odole Intersection
Figure 2 presents the composition of vehicles observed during peak and off peak traffic counts undertaken at Odole intersection and indicate that the major contributors to traffic at the intersection are Motorcycles (70.88%) and Passenger Cars (28.72%). Other modes of transportation account for about 0.4% of vehicles traversing the intersection.
4.3. Analysis of Traffic Volume and Delay at Odole Intersection
Table 2 and Table 3 show the descriptive statistics of traffic volume and delay data collected at the intersection respectively. The delay at Odole intersection is similar at all approaches. The average delay of (22 seconds) is an

Table 1. Geometric features of Odole intersection.
Table 2. Descriptive statistics of traffic volume at Odole intersection.
Table 3. Descriptive statistics of delay at Odole intersection.
Secs = seconds.
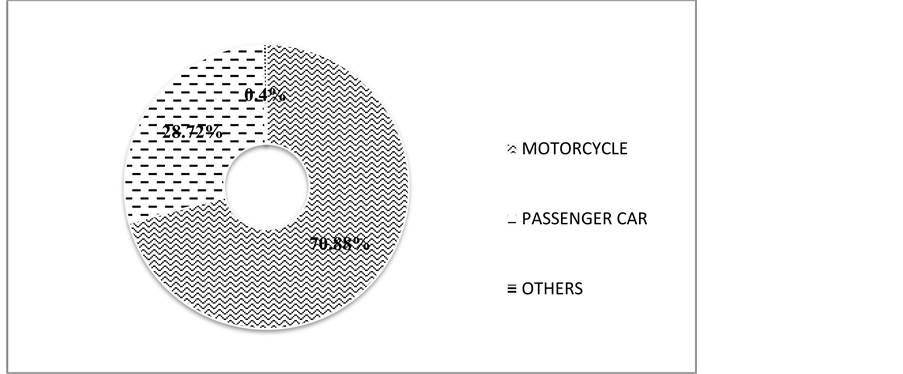
Figure 2. Traffic composition of Odole intersection.
indication of Level of Service of C which signifies stable operating conditions with average traffic delays at the intersection. This can be attributed to traffic control by personnel at the intersection. However, prolonged traffic jams are usually experienced when traffic personnel are not present.
The critical traffic flow patterns at Odole intersection during peak and off peak periods are illustrated by Figure 3 and Figure 4 respectively.
4.4. Discharge Headway Results at Odole Intersection
Table 4 and Figure 5 present the Summary of the results of discharge headway study carried out at Odole Intersection. The results reveal that the Saturation Headway (hs) at the intersection is about 1.7 seconds.
4.5. Justification for Adoption of Traffic Signalization at Odole Intersection
Free flow of traffic at Odole intersection would remain dependent on the availability of a Traffic Personnel if the regulatory mechanism is left in status-quo. Moreover, a rotary intersection would not avail at Odole Intersection because over 4000 vehicles traverse the intersection in an hour during peak periods. The maximum traffic volume a rotary can efficiently handle is 3000 vehicles per hour [2] . An interchange is unwarranted, considering the cost of construction which surpasses in a great deal, the economic benefits that could be derived from it. From the foregoing, the best alternative suitable for this intersection is signalization since the route is not a high speed route where traffic signalization could cause rear-end-collisions.

Figure 3. Critical traffic flow pattern at Odole Intersection during peak periods.

Figure 4. Critical traffic flow pattern at Odole intersection during off-peak periods.
Table 4. Average discharge headway at different vehicle positions at Odole intersection.
4.6. Pre-timed Traffic Signal Design for Odole Intersection
Most pre-timed traffic signal designs are geared to the peak time, resulting in frustrating delays to vehicles during off peak periods [8] . Therefore, from the traffic flow patterns, both peak and off peak traffic signal programmes need to be developed because there is an appreciable difference in the volume of traffic during the 2 periods. Furthermore, 2 phase signalization system is the preferred choice for both peak and off peak signal pro-
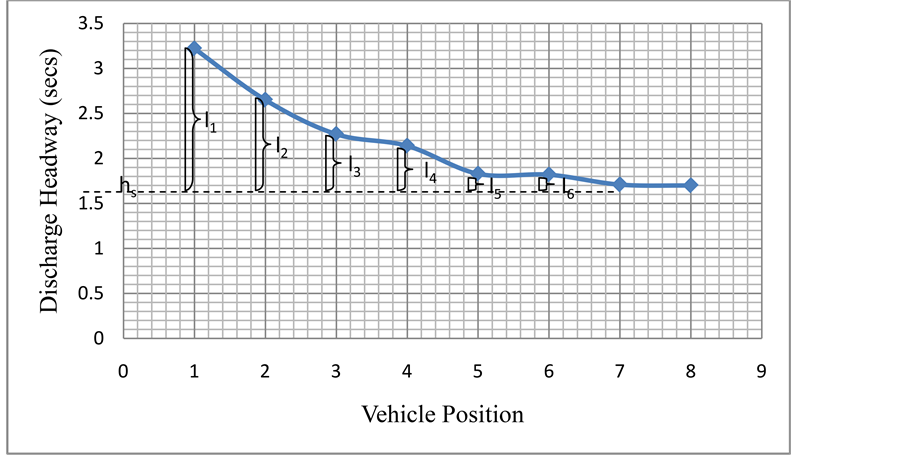
Figure 5. Graphical representation of discharge headway data at Odole intersection.
grammes because in both cases, the volume of through traffic is significantly greater than the turning movements. The critical lane volumes are indicated by bold arrows (Figure 2 and Figure 3).
The traffic studies undertaken at Odole revealed the following signal design parameters:
Average Start-up lost time (tL) = 3.73 secs.
Average Saturation headway (hs) = 1.7 secs.
Sum of critical lane volumes  (Peak Period) = 1100 + 816 = 1916 veh/hr.
Sum of critical lane volumes  (Off-Peak Period) = 956 + 560 = 1516 veh/hr.

Number of phases (N) = 2 (for both Peak and Off-Peak).
Amber time for Phase 1 (A1): 4 secs.
Amber time for Phase 2 (A2): 3 secs.
where:
Phase 1 gives right of way to major approaches (OkeAro road).
Phase 2 gives right of way to minor approaches (Gbangbalogun-Odiolowo road).
Pre-timed Traffic Signal Design for Peak Period
Since the Saturation Flow Rate is greater than the sum of critical lane volumes, the design can proceed without giving consideration to splitting traffic into more lanes in a bid to reduce sum of critical lane volumes.


Figure 6 is the timing diagram for the traffic signal during peak periods
It can be gleaned from the result of the design that traffic on the OkeAro road has an upper hand in the apportioning of right of way.
Pre-timed Traffic Signal Design for Off-Peak Period
Since the Saturation Flow Rate is greater than the sum of critical lane volumes, the design can proceed without giving consideration to splitting traffic into more lanes in a bid to reduce sum of critical lane volumes.


Figure 7 is the timing diagram for the traffic signal during off-peak periods.
There is a marked difference in the peak and off peak timing programmes, corroborating the need for both peak and off-peak timing programmes. However, it is apposite to remark that the traffic signal designs need to be revised from time to time in years to come due to the dynamic nature of traffic behaviour.
5. Conclusion
An appraisal of Odole Intersection has indicated that the major contributors to traffic are Motorcycles (70.88%) and Passenger Cars (28.72%). Other modes of transportation account for about 0.4% of vehicles traversing the intersection. Critical traffic volume at the intersection was over 4000 veh/hr. Furthermore, an average delay of

Figure 6. Timing diagram for peak period programme at Odole intersection (all values in seconds).

Figure 7. Timing diagram for off-peak period programme at Odole intersection (all values in seconds).
22 secs at the intersection was an indication of a level of service of C (i.e. fairly stable traffic condition with average delays attributable to traffic control by personnel). Odole intersection has been adjudged to require signalization and has been designed as such, having 40 seconds Green, 4 seconds Amber and 34 seconds Red time intervals in the first phase; 31 seconds Green, 3 seconds Amber and 44 seconds Red time intervals in the second phase for peak period programme. However, off-peak programme has 11seconds Green, 4 seconds Amber and 11 seconds Red time intervals in the first phase; 8 seconds Green, 3 seconds Amber and 15 seconds Red time intervals in the second phase.
6. Recommendations
In tandem with the findings of this research, the following recommendations are made:
・ Construction of Ring Road in Akure Metropolis in order to reduce the burden on existing transportation facilities especially the intersections.
・ Dualisation of Oke-Aro road to enable the road to meet up with future traffic demands.
・ Reviewing the traffic signal programme at Odole from time to time so as to guarantee its efficiency in controlling any prevailing traffic situation since the designed signal programme would become obsolete over time.
Acknowledgements
The authors wish to gratefully acknowledge Prof. A. O. Owolabi for his immense contributions toward the success of this research.
Cite this paper
Olumuyiwa Samson Aderinola,David Oladotun Owolabi, (2016) Traffic Regulation at Critical Intersections: A Case Study of Odole Intersection, Akure, Ondo State, Nigeria. Open Journal of Civil Engineering,06,94-104. doi: 10.4236/ojce.2016.62009
References
- 1. Adams, J. (1981) Transport Planning Vision and Practice. 1st Edition, Routledge and Kegan Paul Ltd., London.
- 2. Kadiyali, L.R. (2008) Traffic Engineering and Transport Planning. 7th Edition, Khanna Publishers, Delhi.
- 3. Jain, V., Sharma, A. and Subramanian, L. (2012) Road Traffic Congestion in the Developing World. Proceedings of the 2nd ACM Symposium on Computing for Development, Article 11, ACM New York, New York.
http://dx.doi.org/10.1145/2160601.2160616 - 4. Engwitch, D. (1992) Towards an Eco-City; Calming the Traffic. Envirobook Publishers, Sussex Inlet.
- 5. Hoel, L.A., Garber, N.J. and Sadek, A.W. (2008) Transportation Infrastructure Engineering (A Multi-Modal Integration). International Student Edition. Chris Carson, Key Largo.
- 6. Rogers, M. (2003) Highway Engineering. Wiley-Blackwell Publishing, Ames.
- 7. Wright, P.H. and Dixon, K.K. (2004) Highway Engineering. 7th Edition, John Wiley and Sons, Hoboken.
- 8. O’Flaherty, C.A. (1974) Highways Vol. 1 Highways and Traffic. 2nd Edition, Edward Arnold Publishers Ltd., London.
- 9. Wikipedia (2014) Akure Kingdom.
http://wikipedi.org/wiki/Akure_Kingdom - 10. Okoko, E.E. (2002) A Predictive Modeling of Spatial Interaction Pattern in the Transport System in Akure. Unpublished PhD Thesis, Federal University of Technology, Akure.
- 11. Ajibefun, I. (2010) Akure City Profile. International Water Management Institute, Colombo.
- 12. Owolabi, A.O. (2004) Intra-modal Competition in Urban Para-Transit Systems: Case Study of Akure Metropolis. Unpublished PhD Thesis, Federal University of Technology, Akure.
- 13. Owolabi, A.O. (2009) Paratransit Modal Choice in Akure, Nigeria. Applications of Behvioural Models. Institution of Transportation Engineers Journal, 79, 54-58.
- 14. Ayeni, A.O. (2011) Malaria Morbidity in Akure, Southwest, Nigeria: A temporal Observation in a Climate Change Scenario. Trends in Applied Sciences Research, 6, 488-494.
http://dx.doi.org/10.3923/tasr.2011.488.494