Modern Mechanical Engineering
Vol.4 No.1(2014), Article ID:43073,9 pages DOI:10.4236/mme.2014.41003
Fault Detection of Fuel Injectors Based on One-Class Classifiers
1Agricultural Engineering Laboratory, Aristotle University of Thessaloniki, Thessaloniki, Greece
2Department of Exploitation of Natural Resources and Agricultural Mechanics, Agricultural University of Athens, Athens, Greece
3Department of Biosystems Engineering, Technological Educational Institute of Thessaly, Larissa, Greece
Email: dmoshou@agro.auth.gr
Copyright © 2014 Dimitrios Moshou et al. This is an open access article distributed under the Creative Commons Attribution License, which permits unrestricted use, distribution, and reproduction in any medium, provided the original work is properly cited. In accordance of the Creative Commons Attribution License all Copyrights © 2014 are reserved for SCIRP and the owner of the intellectual property Dimitrios Moshou et al. All Copyright © 2014 are guarded by law and by SCIRP as a guardian.
Received November 19, 2013; revised December 21, 2013; accepted January 9, 2014
KEYWORDS
Fuel Injectors; Fault Detection; Acoustics; Neural Networks; One-Class Classifiers
ABSTRACT
Fuel injectors are considered as an important component of combustion engines. Operational weakness can possibly lead to the complete machine malfunction, decreasing reliability and leading to loss of production. To overcome these circumstances, various condition monitoring techniques can be applied. The application of acoustic signals is common in the field of fault diagnosis of rotating machinery. Advanced signal processing is utilized for the construction of features that are specialized in detecting fuel injector faults. A performance comparison between novelty detection algorithms in the form of one-class classifiers is presented. The one-class classifiers that were tested included One-Class Support Vector Machine (OCSVM) and One-Class Self Organizing Map (OCSOM). The acoustic signals of fuel injectors in different operational conditions were processed for feature extraction. Features from all the signals were used as input to the one-class classifiers. The one-class classifiers were trained only with healthy fuel injector conditions and compared with new experimental data which belonged to different operational conditions that were not included in the training set so as to contribute to generalization. The results present the effectiveness of one-class classifiers for detecting faults in fuel injectors.
1. Introduction
In comparison to gasoline engines, diesel engines do not use a flammable mixture of gasoline and air. In diesel engines, compressed air is mixed with injected fuel inside the cylinder with a compression rate of circa 25:1. Combustion occurs in a temperature of 700˚C - 900˚C.
Fuel injectors are critical components in diesel internal combustion engines. Moreover, they are used in gasoline engines. The injector’s diameter and orifice’s manufacturing tolerances should be adequate in order to ensure the proper functioning of the petrol engine. During fuel injector operation, carbonified fuel residues are deposited inside the injectors. These residues are able to cause partial or total blockage. As a result, abnormal injection patterns occur which gradually worsen unless a solution to the problem is found or the injectors are replaced by new ones.
Industrial products and equipment appraisal should be reliable. Good mechanical design is required for ensuring reliability. Also, quality fades as a function of time, even if the mechanical design of products is efficient. Prolonged operation under high load carries responsibility as well. Therefore, maintenance is a helpful way to assure a sufficient level of reliability.
Albarbar et al. [1] investigated the identification of original sources for diesel engine acoustic data that were simulated. Three microphones were responsible for collecting air-borne acoustic signals including combustion pressure, injector vibration and injector line pressure. The proposed method utilized the ICA algorithm for decomposing the residual signal by disturbance elimination and noise cancelation. Wigner-Ville Distribution (WVD) helps in the definition of dominant combustion frequencies while few data could be derived from diesel engine acoustic signals utilizing time domain and frequency domain analysis.
Elamin et al. [2] proved that signals stemming from a four cylinder diesel engine are suitable for detecting Acoustic Emission (AE) signal injector faults. Four tests were performed under various engine conditions. AE signals in the angular domain are able to aid in the diagnosis for no load condition. A Continuous Wavelet Transform (CWT) was used for the analysis. From the above research, it can be easily assumed that CWT can tell a part small injection fault from healthy and demonstrate diagnosis including both high and low load conditions.
In Zahi et al. [3], a diagnosis system introduced was specialized in detecting and isolating various faulty types. The study was concentrated on controlling the pressure of a diesel injection system. Both injectors and filling actuator situated on the pump were regulated by an electronic control unit, in order to stabilize the rail pressure at a desired level. They have demonstrated the potential of this method as suitable for managing a wide range of process failures and components.
Lin et al. [4] presented a method to analyse the signal of simulated injector faults by using acoustic emission and pressure inside the cylinder. A comparison between the pressure and acoustic against baseline data from normal engine operating conditions has shown that the acoustic emission technique is capable of detection of simulated injector faults. When operating at full load condition, the AE signal from the simulated fault can be utilized for detecting similar injector faults occurring in diesel engines in practice.
Elamin et al. [5] examined the possibility of detecting injector faults in a JCB 444T2 diesel engine utilizing acoustic emission (AE) technique. Short time Fourier transformation (STFT) was applied to process AE signals acquired from a cylinder head of an engine. It was proved that less fuel was provided into the cylinder and less energy was produced when the injection pressure was elevated. In contrast, when the injection pressure was lowered, more fuel was provided into the cylinder and a more profound AE transient was observed. It was discovered that the main AE transients were derived from the combustion inside the cylinders and that the injection faults can be inferred from the main AE transients due to their high impact on the combustion.
Jianmin et al. [6] attempted to extract data related to the condition of the fuel injection system, by analyzing the vibration response of the needle valve. The closing crash of the needle valve can excite head vibration which leads to the generation of a dual-peak in the signal during the combustion stage under certain work conditions. From the results, it is proved that these features can be utilized to diagnose fuel injection faults.
In Albarbar et al. [7], adaptive filtering techniques were used to isolate the needle impact excitations resident inside the air-borne acoustic signals recorded from diesel fuel injectors. A Two Stages Adaptive Self-Tuning (AST) was used. The above scheme enhanced the diagnosis of faults and it was proposed as a tool for condition monitoring applicable in other similar rotating machinery like gearboxes and pumps.
Two specialized classification strategies within an exemplary scenario intended for the verification of the Comprehensive Nuclear Test-Ban-Treaty (CTBT) were presented. It has been shown that One-Class (OC) classifiers can successfully be applied to classify Stochastically Episodic (SE) events, which are unknown, although present, at the time of training. The used one-class classifiers included SVM, MLP, Naive Bayes, Nearest Neighbour and Decision Tree Classifiers.
Crupi et al. [8] focused on a new procedure, incorporating neural network that was designed and realized to evaluate the vibration signatures and recognize the fault presence. The system developed was able to diagnose a new fault not present in the training data set. For the novelty detection, a description of normality (normal machine behavior) was learnt by fitting a model to the set of normal examples, and anomalies or faults were detected as significant deviations from this description or normal domain (admissible or healthy).
This work proposes fuel injector fault detection utilizing two novelty detection methods based on one-class classification, one-class Support Vector Machine (OCSVM) and one-class Self-Organizing Map (OCSOM). The suggested method introduces new signal processing techniques providing useful information to achieve fault recognition based on outlier detection. An original contribution includes the introduction of the new feature of line integral of the acoustic signal in combination with oneclass classification for novelty detection. Acoustic signals were recorded by microphones from healthy and damaged fuel injectors, and seven (7) time-domain features were extracted from the acoustic time signals.
The one-class classifiers were calibrated only with healthy fuel injector conditions and compared with new experimental data which belonged to different operational conditions that were not included in the training set so as to contribute to generalization. The results present the effectiveness of one-class classifiers for detecting faults in fuel injectors.
2. Materials and Methods
Firstly, measurements were performed in new or used tractors. As a result, the features of healthy injectors could be used for further appraisal and comparison with others that are suitable for future testing. Deviations that appeared in healthy injector signals could be utilized as indication of malfunctioning.
The research was performed at the Agricultural Engineering Laboratory of Agricultural University of Athens (AUA) during 2009-2010. The main objective of the research was the prognosis and diagnosis of faults in agricultural machinery. This research concentrated on diesel oil fuel injectors (becks) of petrol engines.
The Collection of Acoustic time series was conducted by microphones for healthy fuel injectors as well as malfunctioning ones. Seven time domain features were extracted from the acoustic signals. A Bearing Checker of SPM was used to test the injectors (Figure 1). The Bearing Checker is a portable palmtop device, capable of determining the health state of bearing in preventive maintenance. Bearing Checker measures shock pulse as well as surface temperature via an infrared sensing. It has a dual role as an electronic stethoscope for detecting abnormalities from engine sounds.
In this work, Bearing Checker (manufactured by SPM Instrument) was applied for fuel-injector measurements. This device is utilized for recording impulse levels during machine operation using an embedded microprocessor. The impulse analyzer extracts samples from various bearings and record determines status during operation. The Bearing Checker is incorporating a 1.5 mm headphone jack as presented in Figure 2. The Bearing checker’s output was connected to the computer sound card. By this way, the Bearing checker communicated with the computer. Sound storage was performed using the free program “Audacity” in mp3 format. Earphones were used in order to control the audio recording. The produced sound was transferred to a portable computer for advance processing (Figure 2).
An electronic stethoscope was used for injector investigation. The produced sound was processed in a laptop computer. The experiments were performed both in healthy and damaged fuel-injectors. A New Holland TN65N tractor was utilized for data acquisition. In this tractor, all three fuel-injectors were controlled electronically. The condition of the injectors appears as follows: one healthy (fuel-injector 1), one slightly damaged (fuelinjector 2) and one was different from a healthy condition (fuel-injector 3). A short sample of the recorded signals is introduced in Figure 3.

Figure 1. Bearing Checker device [9].

Figure 2. Data acquisition setup for sounds produced by faulty fuel-injectors.
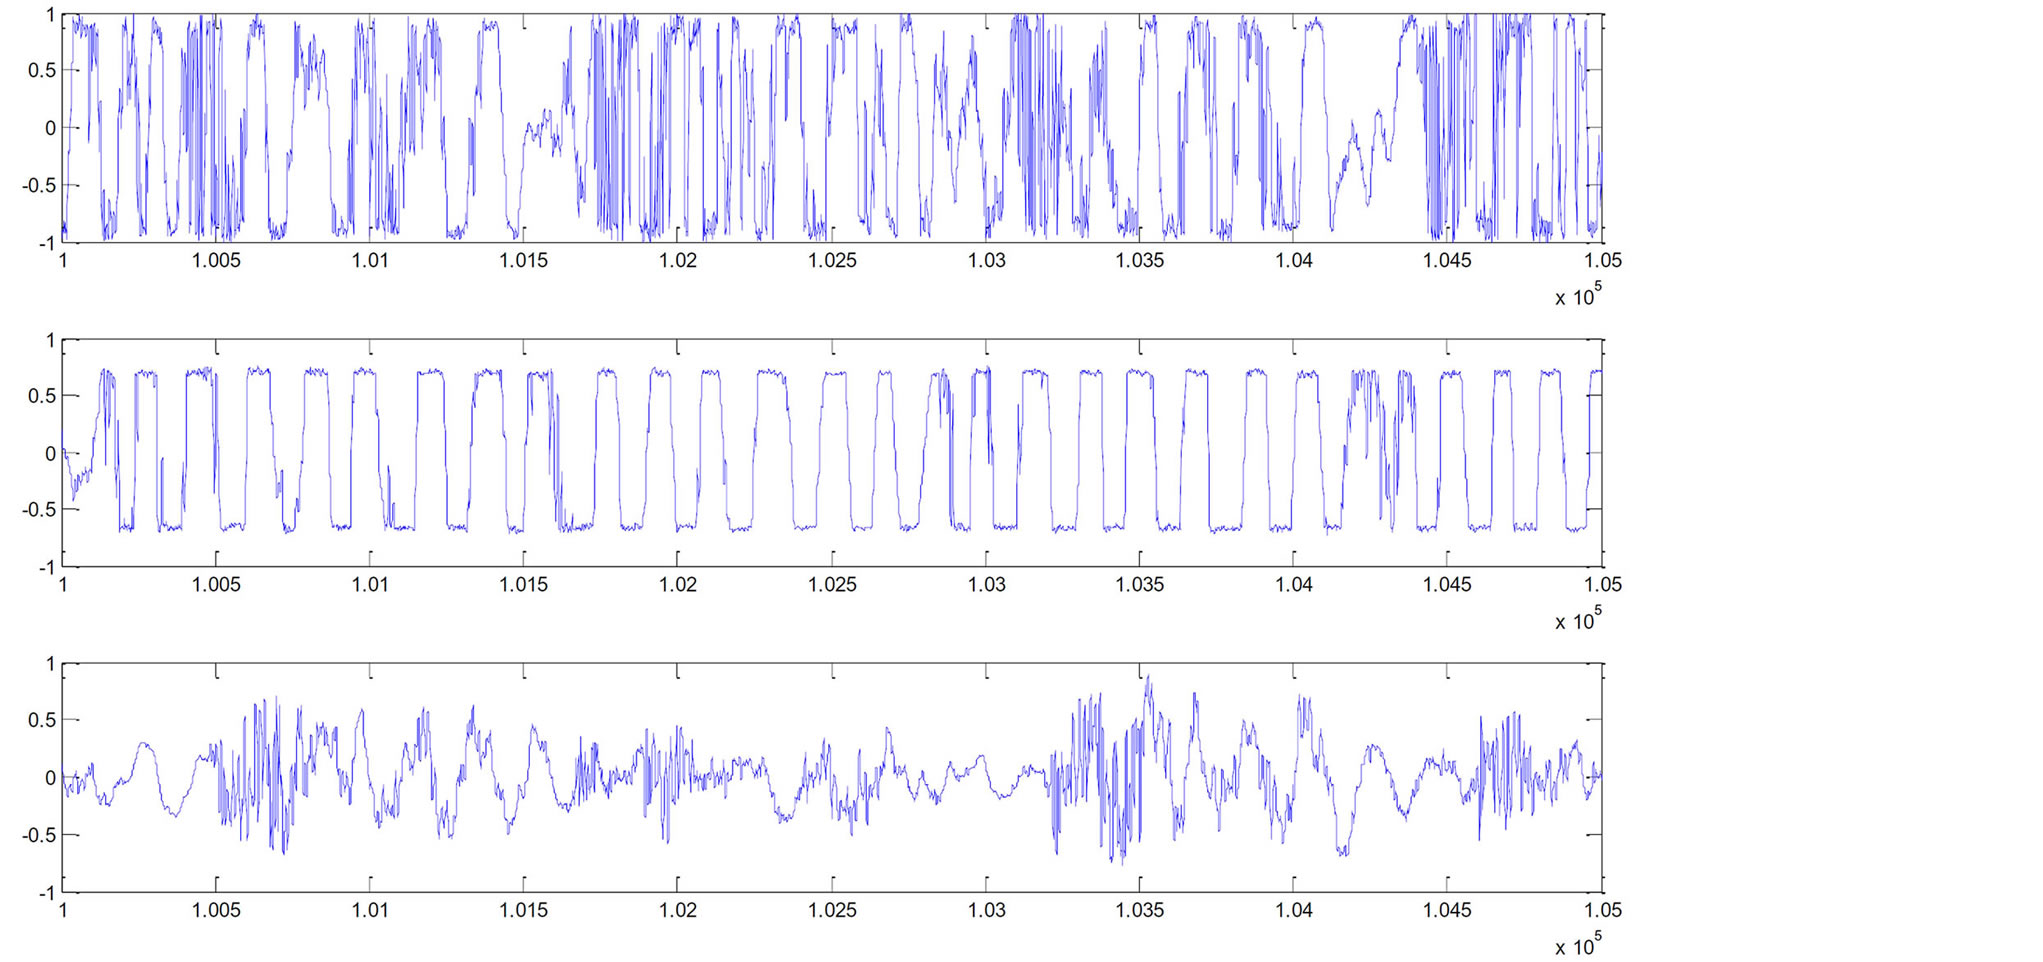
Figure 3. Waveforms that belong to three fuel injectors from the New Holland TN65N tractor. Signal samples between 100,000 and 105,000 having a sampling rate of 44,100 Hz.
From the above mentioned, it is obvious that the first and second fuel injectors are considered as healthy. On the other hand, the third demonstrates several abnormalities owing to the fact that pulses do not include any clear definition. Moreover, the peak values vary irregularly. Furthermore, they appear only a few times during the examination period. After two weeks, the experiments were repeated presenting same result. While experiments were carried out for second time, an unused injector replaced the faulty one in the New Holland TN65N tractor. The waveform of the new injector has given the impression of a healthy injector free of abnormalities (Figure 4).
In addition, fuel-injector sounds data acquisition was performed on fuel-injectors belonging to a Zetor 7711 tractor, applied for viticulture. Four fuel-injectors were already installed. All fuel-injectors (denoted as 4-5-6-7) didn’t belong to the healthy condition. As a result, it was necessary for all faulty fuel-injectors to be cleaned so as their functionality be established (Figure 5).
From the above mentioned, it is easy to reach the conclusion that all fuel injectors belonging to the Zetor 7711 are supposed to be at bad condition. Generally they all display a number of mechanical faults due to the fact that the pulses are not clearly formed. On the contrary they tend to differ, due to the peak values’ irregular appearance. Thus, these mechanical faults tend to occur intermittently during the examination period. The experiments that were carried out again after two weeks presented similar results, compared with the New Holland TN65N tractor.
To sum up, the injectors were eight. Three of them were tested on the New Holland TN65N tractor, while four of them were tested on the Zetor 7711. The damaged one was replaced by a healthy one.
The first two steps included data acquisition and feature extraction. The sound signal obtained from each
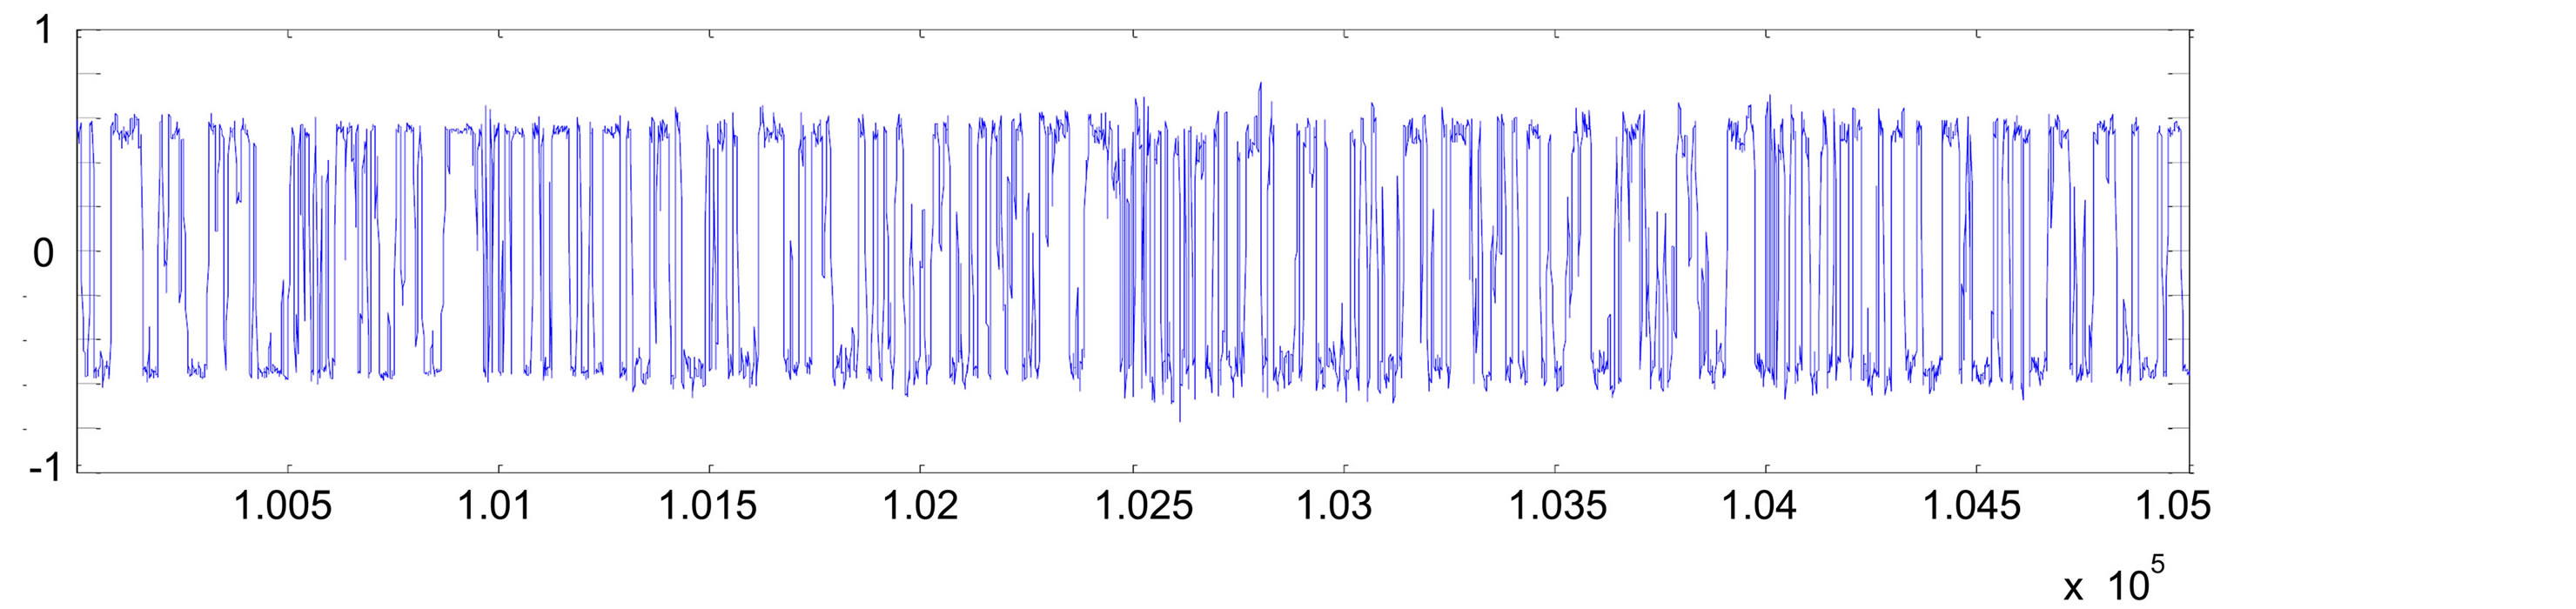
Figure 4. Sample signal of the waveform of the newly installed intact fuel injectors incorporated into the New Holland TN65N tractor. The experiment comprised of samples between 100,000 and 105,000 which have a sampling rate of 44,100 Hz.
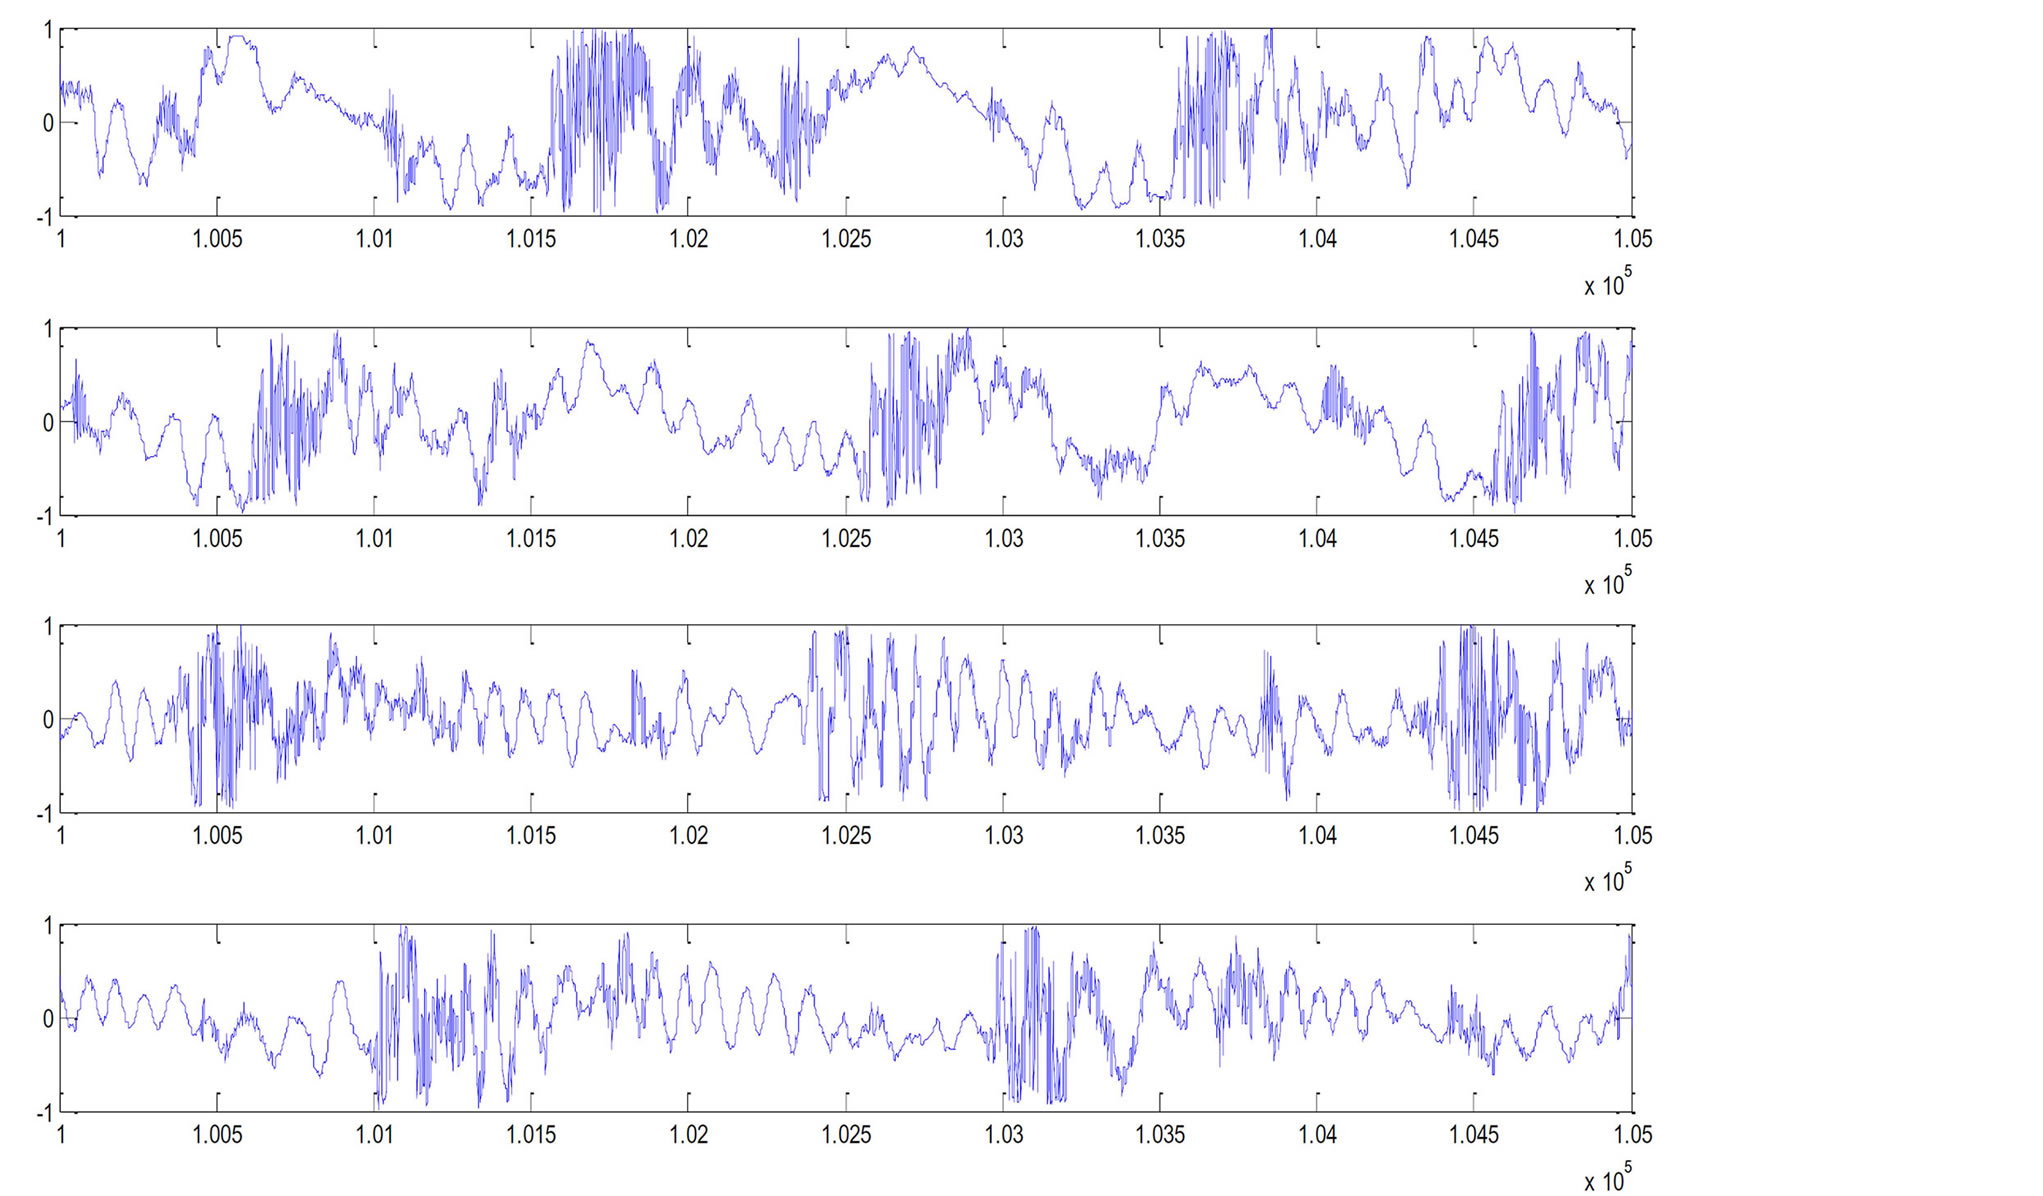
Figure 5. Sample signal of the waveforms belonging to four fuel injectors of the Zetor 7711 tractor. Samples were between 100,000 and 105,000 comprising of a sampling rate of 44,100 Hz.
injector consisted of 570,000 points. The signals were sampled at 44,100 Hz. The recording period was 12.925s for each injector. From these 1140 parts that belong to the sound signal (500 samples) were obtained from each injector. Seven (7) statistical features belonging to the time-domain were extracted from each part. Two oneclass classifiers were applied, aiming to detect the presence of fuel faults in fuel injectors (OCSVM and OCSOM). A testing set was used for investigating the oneclass classifiers’ generalization performance. The calibration set included 2280 feature values consisting of 1140 per type (intact and faulty). The experiment comprised of consecutive non-overlapping segments of 500 samples. The training set comprised of 1710 feature values and a testing set of 570 feature values which contained an equal amount of the two classes of fuel injector situation (healthy and damaged). By using training data from only one healthy fuel injector it was proven that one-class classifiers are capable of detecting the condition of both healthy and damaged injectors.
3. Signal Processing and Feature Extraction
When a fault diagnosis problem appears, features have to be extracted from the raw signal. In this way, general machine operation situations are reflected. However, some features are recognized as faults, others are not. In this study, seven (7) time-domain features parameters were chosen.
Time-Domain Features
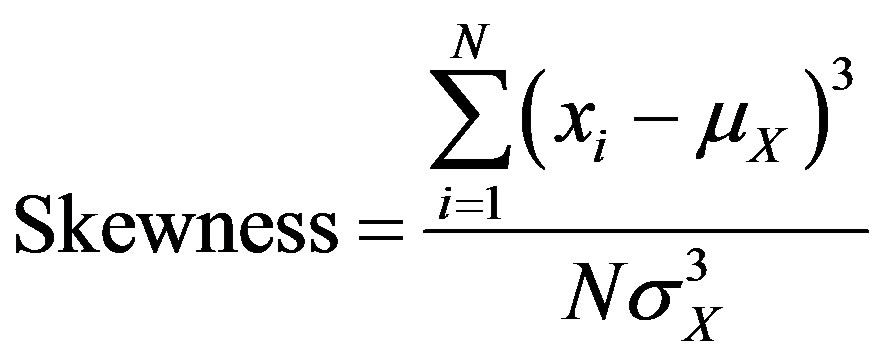
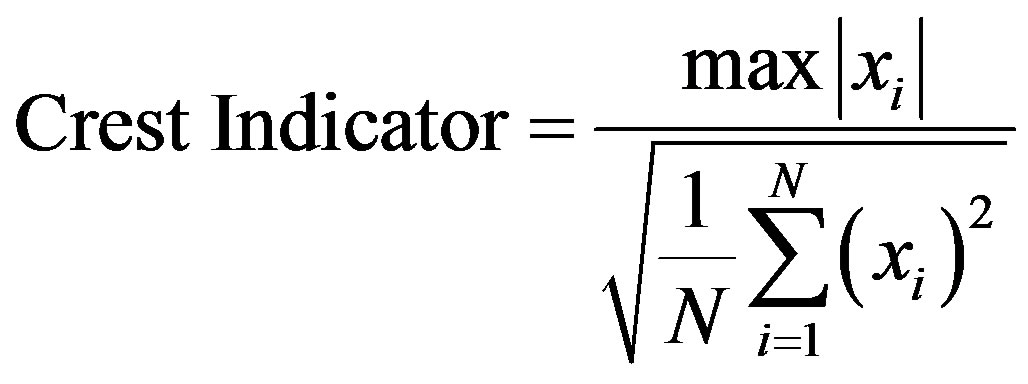
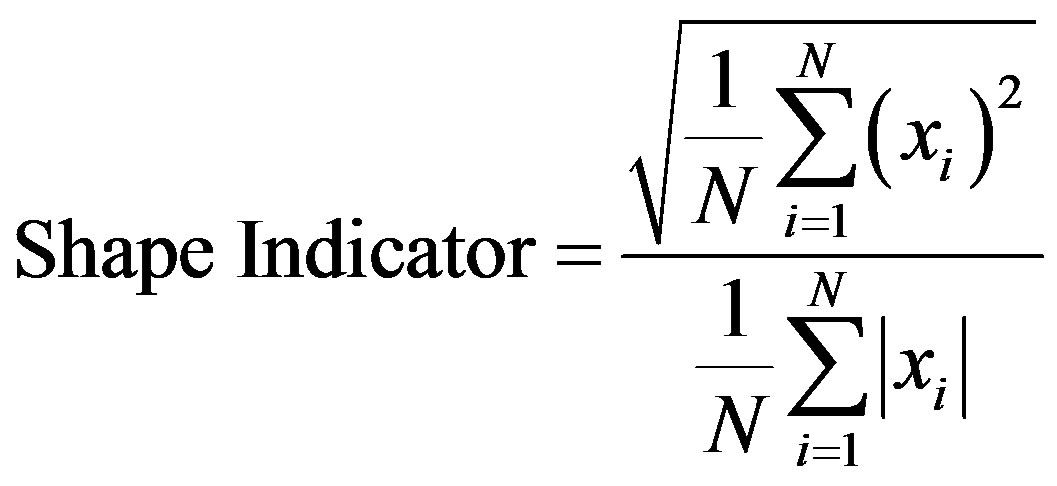
Lei et al. [10] presented the following six features: Impulse Indicator, Shape indicator, Skewness, Crest factor, Kurtosis, and Clearance indicator. Moshou et al. [11] has introduced the seventh feature which represents the line integral of the acceleration signal. Statistical information regarding the nature of data are provided by all the above mentioned features due to features’ specialization in detecting faults in rotating machinery.
 (1)
(1)
 (2)
(2)
 (3)
(3)
 (4)
(4)
 (5)
(5)
 (6)
(6)
The symbols  that appear in Equations (1)-(6)
  represent mean value and standard deviation.
The new line integral feature is presented as follows:
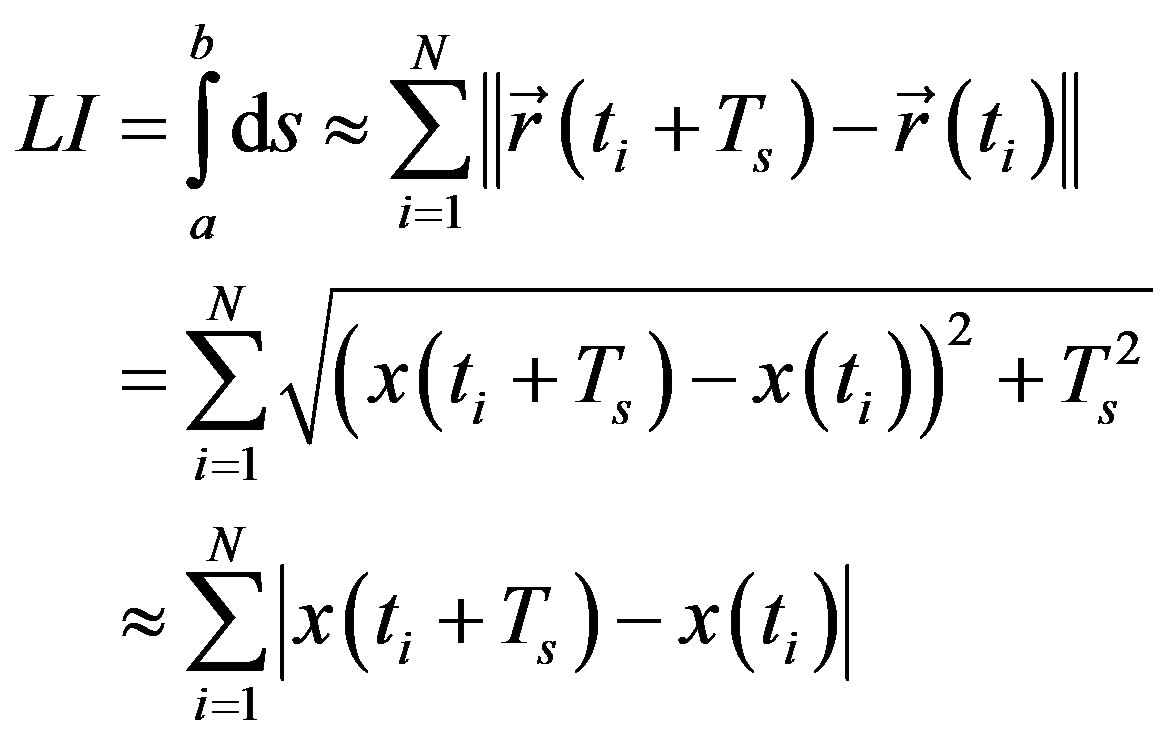
Non-overlapping windows consisting of N = 500 sample points were used to determine Kurtosis and the other features. Ts denotes the sampling period. The lately proposed feature of the line integral focuses on the fact that when high frequencies are abundant in a signal, the density of the signal increases in proportion. This affects the signal track because it is directly dependant on the signal variation. This parameter can supply a precise indication of frequency content. As a result, the overall length of the signal is affected by the frequency content. The estimation can be easier for high sampling rates. Given the signals high sampling rate and high frequency (especially because of the occurrence of faults), the final approximation contained only acceleration values, therefore, the sampling period was not included.
In safety critical applications for novelty fault detection, it is vital for the degree of change to be established. Normal system behaviour may change thanks to aging system modifications, seasonal changes are considered as responsible for bringing about alterations in operating conditions. A critical issue concerns the estimation of robust novelty thresholds leading to trustable novelty detection. Novelty detection algorithms structured around one-class neural networks must be calibrated with data which cover all possible normal conditions so that erroneous fault detection would not appear during normal operation.
In the practical application of the injectors a unique fault description is not available but there exist examples of injectors that are either intactor have different faults which cannot be defined exactly. On the other hand the typical approach is not applicable because there are not distinct classes. Only healthy injectors were utilised as target group for classification leading to the selection of one-class classification methods.
One-class classification can be characterized as follows:
• Only data belonging to the target class (not outlier class) is available for calibration;
• The limit demarcating the border between the two classes has to be calculated from data stemming from the target class only;
• The main task concerns the definition of a boundary surrounding the target class (to classify as many as possible of the target examples correctly, while simultaneously minimizing the prospect of accepting outlier examples).
Figure 6 depicts a target domain XT where there are two errors which are defined as EI which is related to falsely rejected target examples and EII associated to falsely accepted outlier objects. The circular area symbolizes the target domain of the selected one-class classifier.
Utilizing an even outlier distribution also leads to the assumption that when EII becomes smaller, the data description that has minimal volume is obtained. EI combined with the volume of the description can be minimized to get a good data description instead of minimizing both EI and EII.
The One-Class SVM (OCSVM) constructs a model from performing callibration using normal data. At the second stage, classifies test data based on the deviation from normal training data as either normal or outlier [12]. The influence of the RBF’s spreading parameter in
 can be estimated considering that a large spread indicates a linear class of target data while on the other hand, numerous support vectors combined with a small spread indicate a highly nonlinear case (Figure 7).
Firstly, a One-Class SOM (OCSOM) is calibrated using normal operation data. Subsequently, the feature vector that corresponds to a new measurement is examined in order to assess its similarity to the weight vectors of every other map unit. If the smallest distance exceeds a predetermined threshold, it is assumed that the process belongs to a fault situation. This result emanates from the assumption that quantization errors exceeding a certain
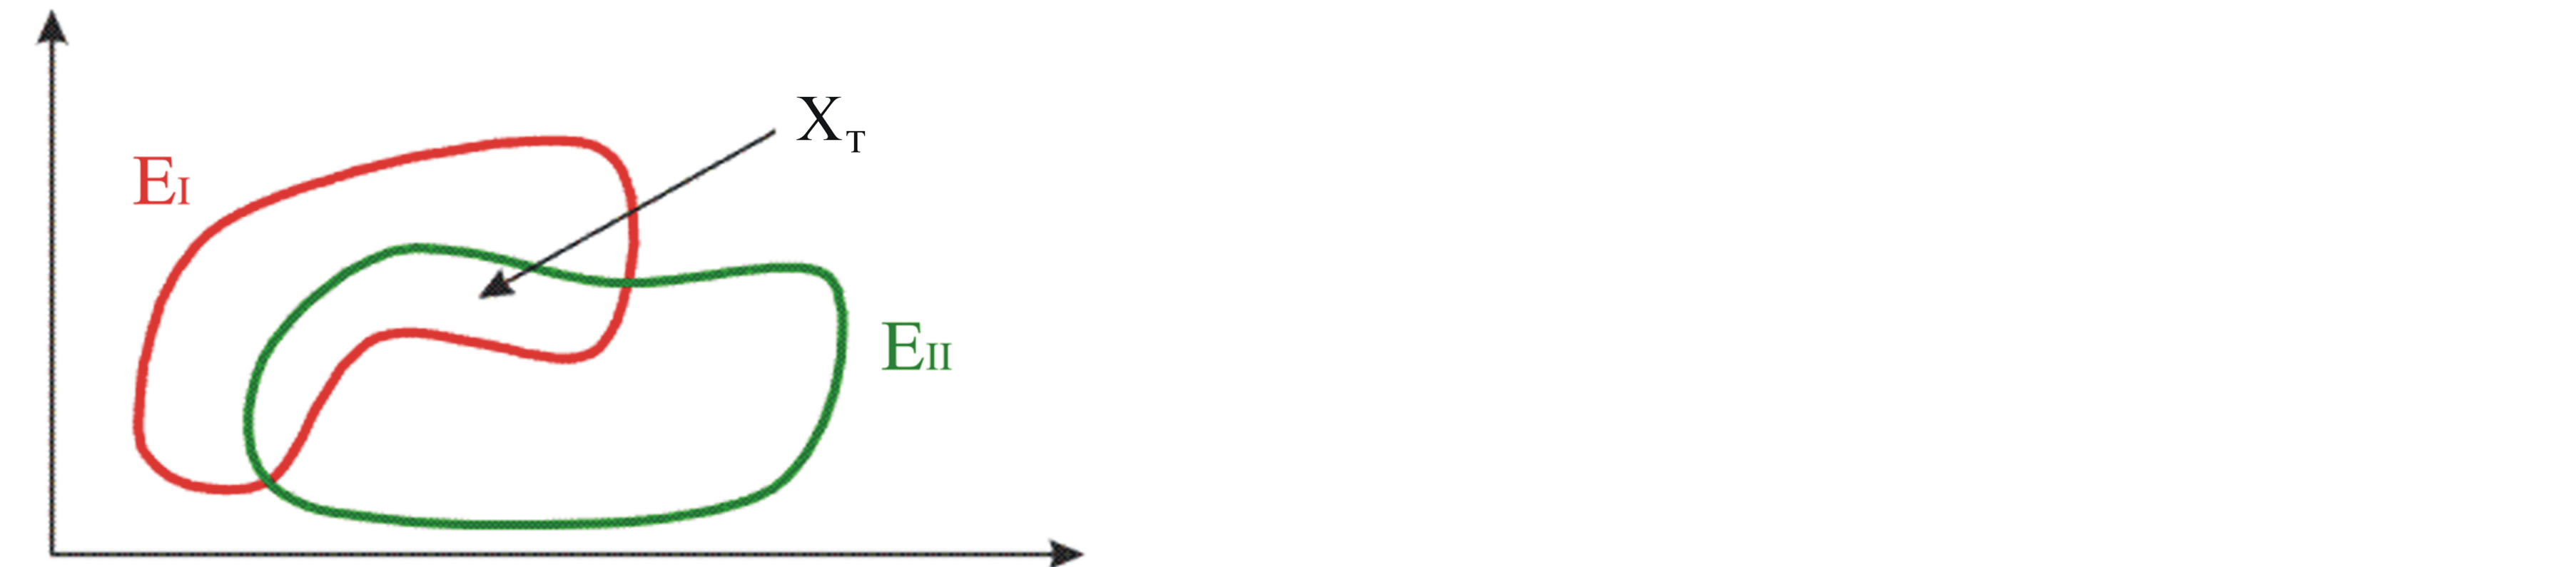
Figure 6. Domains of target dataset and one-class classifier.
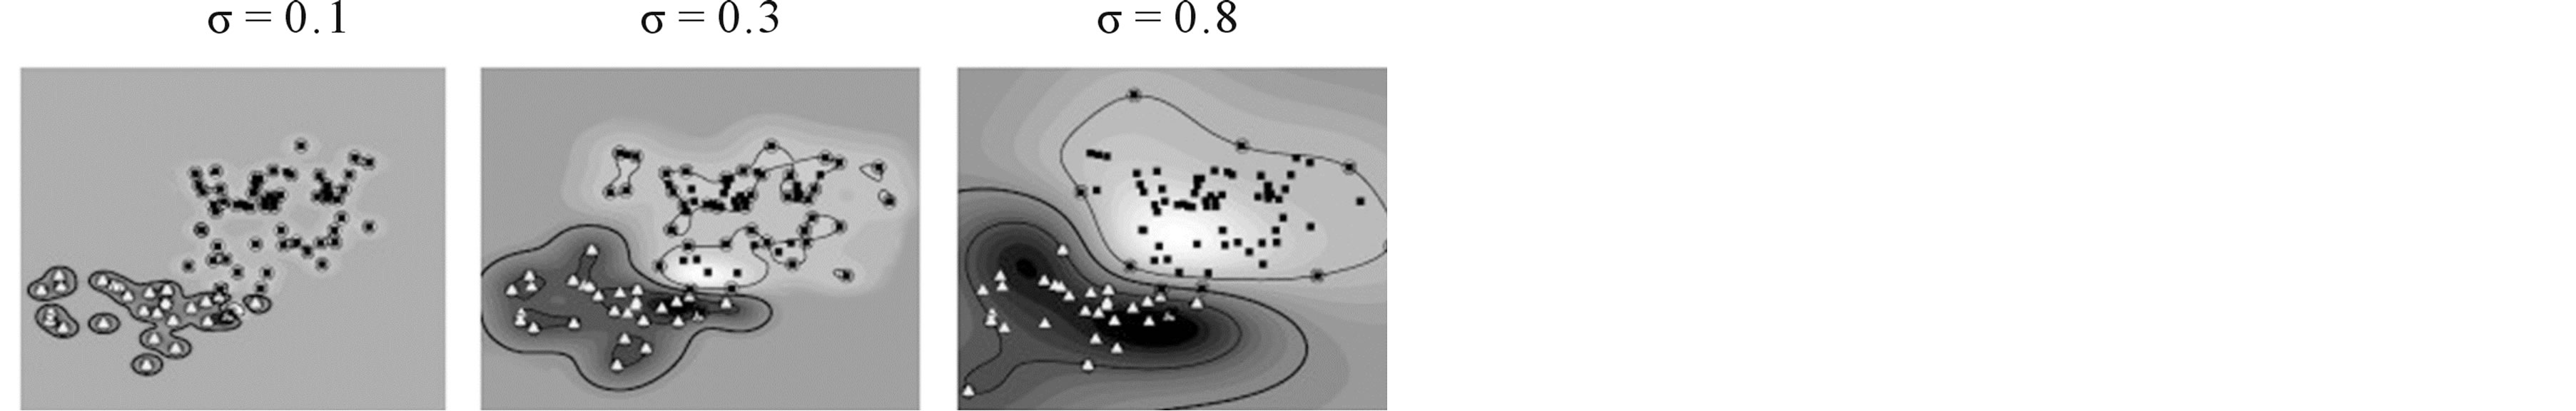
Figure 7. The influence of the RBF spreading parameter on the behaviour of the One-Class SVM [13].
value are associated with the operation points that are external to the region that has been covered by the training data. Hence the situation is novel and raising the possibility of abnormality detection. Depending on the magnitude of deviation from the normal operation state, a degradation index can be calculated. The One-Class SOM (OCSOM) constructs a model from healthy fuel-injector data and subsequently classifies new data according to its deviation from the healthy training data. During novelty recognition, novel examples from fuel-injectors of not definable health state are used to formulate the input to the network while the SOM algorithm selects the best matching unit. In Saunders and Gero [14] if the quantisation error that results from the comparison between the new exemplar data (xNEW) and best matching unit (bmu) is larger than a pre-specified threshold (d) then the example is considered as novel. Equation (8) represents the minimum distance for the bmu and examines it against the threshold.
 (8)
(8)
where M denotes the SOM grid of neurons similar to Equation (8).
There are various heuristics to determine a threshold based on the usefulness of the threshold and the specific structure of the data set. A simple way to define a threshold (d) depends on the similarity between the SOM centroid vectors and target training vectors that have selected them as best matching units which determines the quantization error. These distances have to be estimated according to Equation (9):
 (9)
(9)
The threshold is estimated by utilizing the Matlab code which is presented below:
Data _distances_sorted = sort(distances);
Fraction = round(fraction_targets * length(target_set));
Threshold = (Data _distances_sorted(fraction) + Data _distances_sorted (fraction + 1))/2;
Through the threshold’s selection aiming to represent a fraction of distances referring to the whole training set, it is possible to get distance values which represent the codebooks data vectors more proximally, especially when the distances are formed. As a result, the quantisation errors might be caused by the outliers. Hence, the fraction error is capable of representing a subset of the distances that were measured so that it can isolate outlier values utilizing a specific distribution. For example, if the 99% fraction of the distances between data and codebooks is selected as belonging to the dataset, it is easy to determine a descriptive hypersphere so that it is radius covers the 99% of the data. This remaining 1% corresponds to outliers which will be classified as such since they are located outside the target set description area. According to Figure 6 this is possibly a contributing factor to EI while the target data description has been minimized by imposing a threshold according to a predetermined fraction of the data. In others words, by constraining the target data description there is a cost to in incurring in terms of falsely rejected examples. These results have to be tolerated in order to obtain a more precise novelty detection which would not be impossible if the rate of acceptance would be high because of a very high threshold. In Figure 8, it is easily seen that different areas are defined by the threshold in correspondence best matching units.
The best matching units define Voronoi polygons which represent the domains of the OCSOM neurons. It is evident that some points would be selected as lying inside a domain of neuron now are situated outside the threshold-defined polygon which defines the border between target data and novel data which belong acoustic signatures originating from damaged components (for illustration purposes, actual data are of high dimension so the so direct visualization is not possible).
4. Results and Discussion
The seven time-domain feature were presented as shown in Figure 9. These features follow a specific order of presentation to One-Class Support Vector Machine (OCSVM) and One-Class Self-Organising Map (OCSOM). The order of presentation did not have an effect on the results.
In the presented fault detection application seven features extracted from acoustic time series were supplied to the one-class classifiers. The seven features can possibly provide a more precise separation of classes with respect health condition especially due to their complementarity.
Initially, an OCSVM was used to classify the injectors to a target class corresponding to healthy injectors and detect outliers indicating injectors that are malfunctioning. As target class, features that belong to injector 1 have been used. All injectors that remain have been utilized so as to investigate the performance of the OCSVM. The OCSVM was calibrated by separating the data to 75% for training and 25% for testing. Sets have resulted in 99.82% correct classification for the target class of injector 1 and 100% when using injector 7 as outlier class for testing. These were results for a spread parameter of 1.97 which demonstrated the best results by testing different spreads between 0 and 10. Further testing of the obtained OC-SVM classifier was performed by utilizing all available injectors. Results are presented in Table 1. It is obvious, that all injectors have been identified correctly based on their respective condition. The second injector which is identified as slightly damaged has also
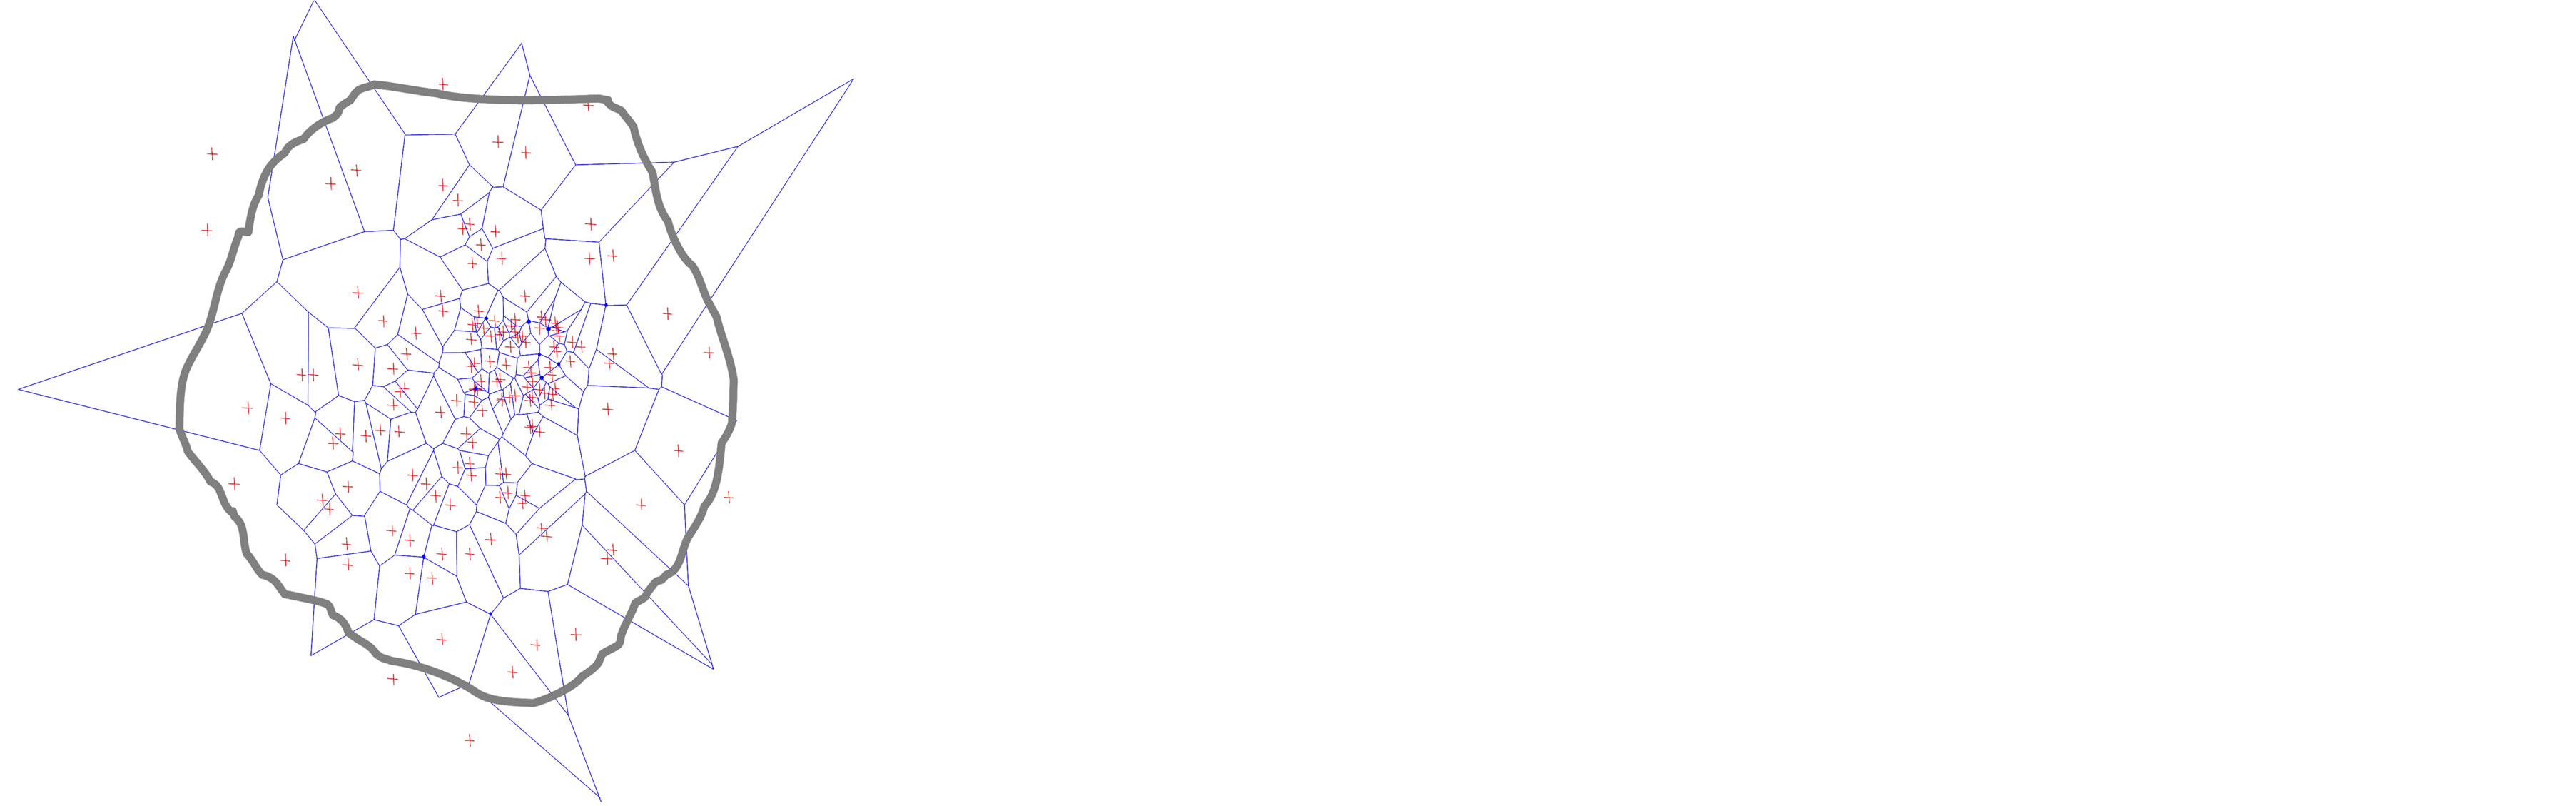
Figure 8. Target dataset domains corresponding Voronoi polygons together with threshold perimeter for OCSOM. The target data that are defined by the threshold are situated inside the grey border line.
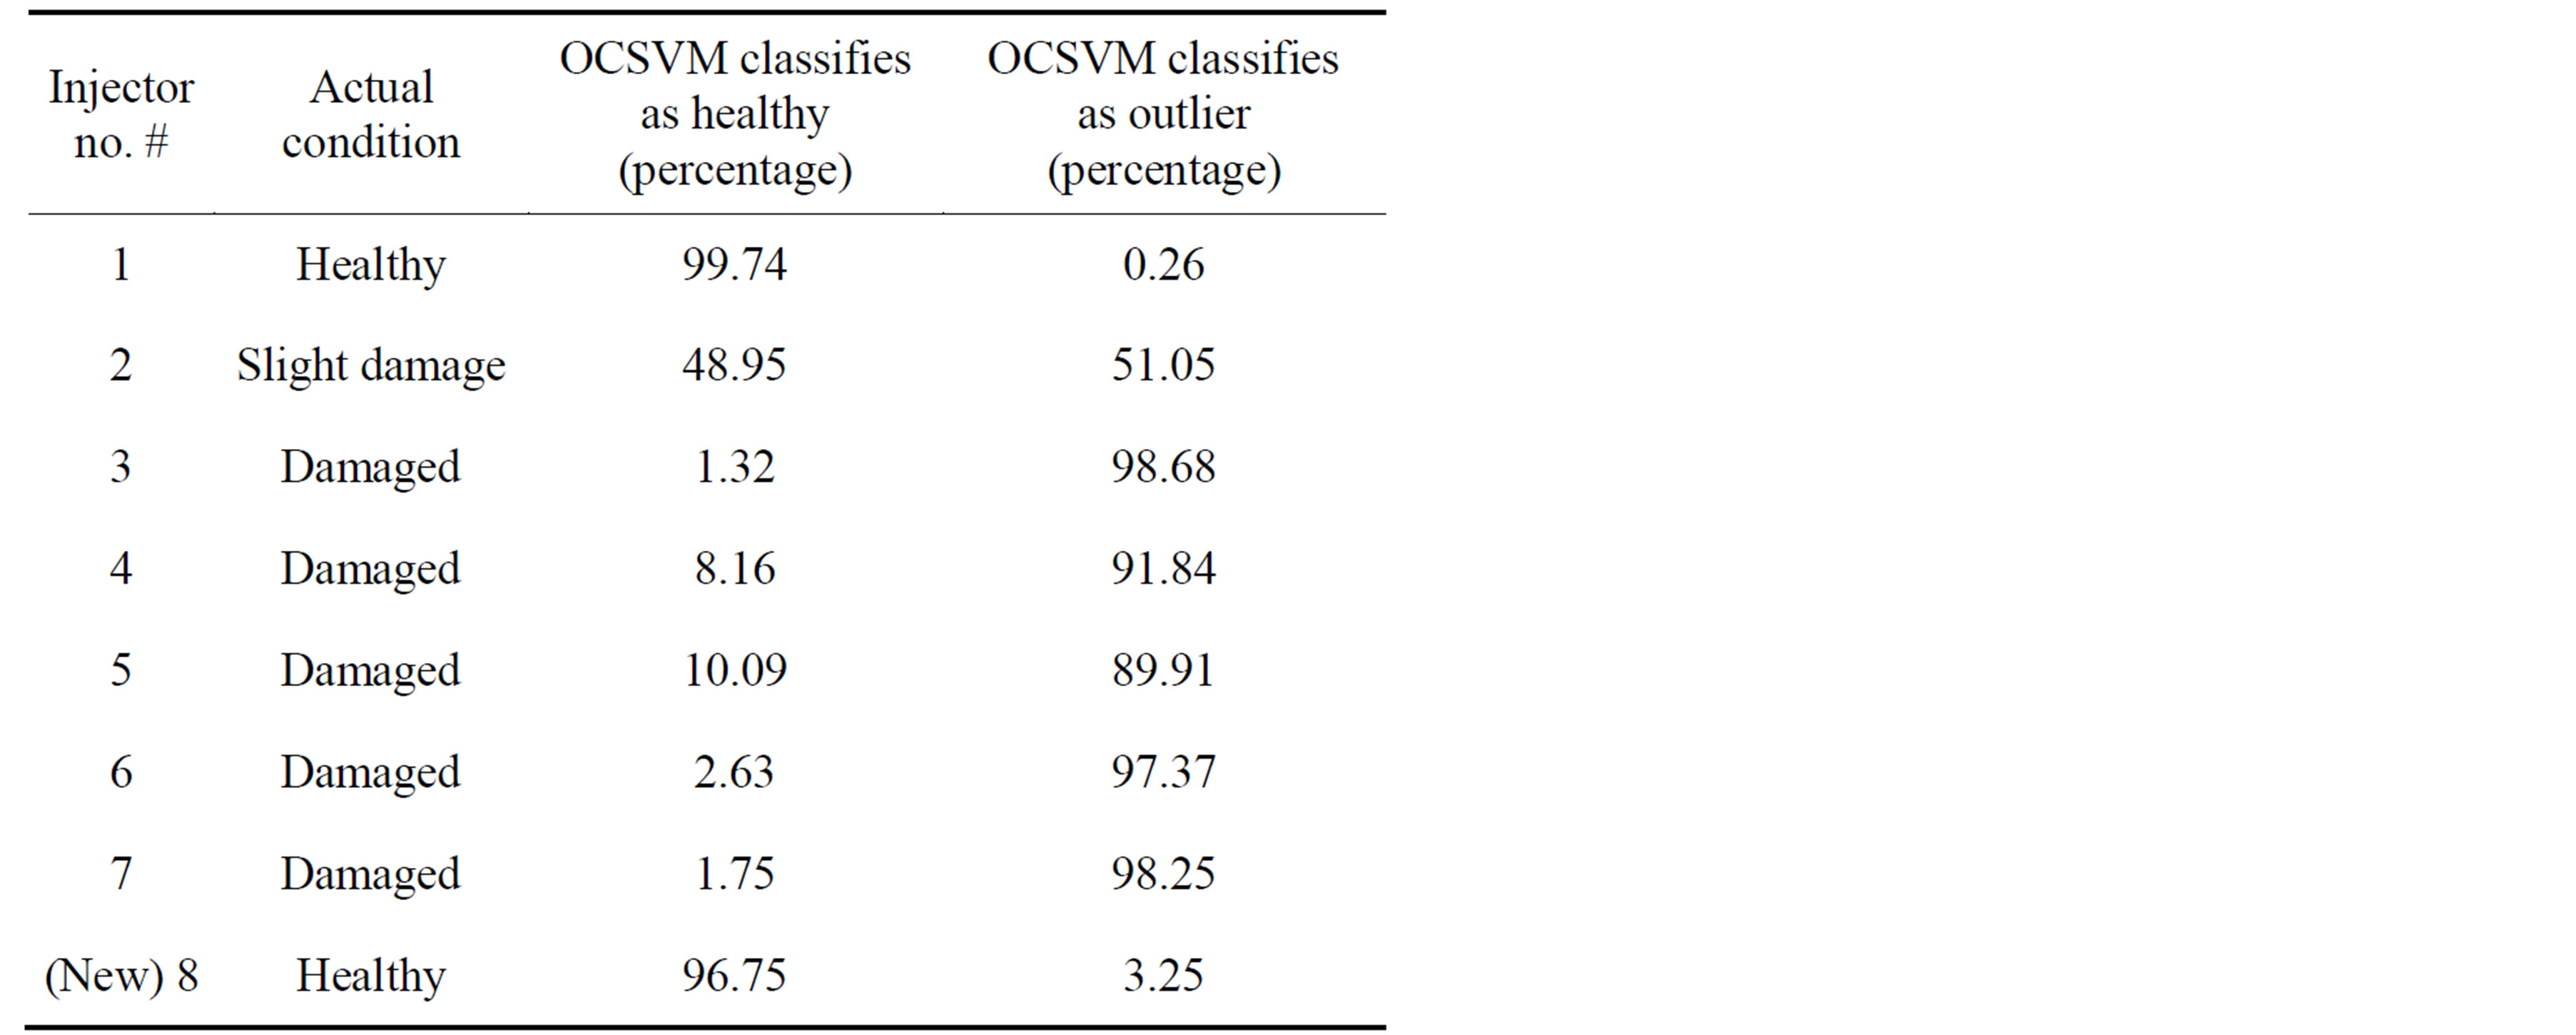
Table 1. Results of OCSVM based classification of injector condition.

Figure 9. Ordering of the features as presented to the classifiers.
been considered as midway to damage which is accurate according to the expert opinion based on the sound emission from that injector.
In a second step, an (OCSOM) was utilized for fuelinjectors classification to a target class corresponding to healthy fuel-injectors. Moreover it was also used for detecting outliers indicating fuel-injectors that belong to a malfunctioned condition. As target class, features belonging to fuel-injector 1 have been used. All other fuelinjectors have been used aiming to test the performance of the OCSOM. The OCSOM was calibrated by separating the data to 75% training of the target set containing only healthy bearing instances and 25% testing sets has resulted in 100% correct classification for the target class of fuel-injector 1 and 99.65% (97.89% without using the feature of the line integral) when using fuel-injector 7 as outlier class for testing. These were results for an OCSOM of 100 neurons (arranged in a 10 × 10 grid) which gave the best results by testing different sizes between 5 and 25. Further testing of the obtained OCSOM classifier was performed using all available fuel-injectors. Results are presented in Table 2. It is easily understood that all fuel-injectors have been identified efficiently according to their respective condition. The slightly damaged second fuel-injector has also been identified as midway to damage which is accurate according to the expert opinion based on the sound emission from that fuel-injector.
From the fuel injector analysis, with OCSVM and OCSOM classifiers, it was obvious that, the recorded sound waveforms were not indicative of completely healthy injectors even in new tractors. By this way the sensitivity of fuel injectors and the importance of monitoring their health status are shown. Even from a first visual examination it was evident that the injectors of the Zetor 7711 tractor were not intact and they would need cleaning.
One of the injectors of New Holland TN65N exhibited similar symptoms. However, visual inspection necessi-
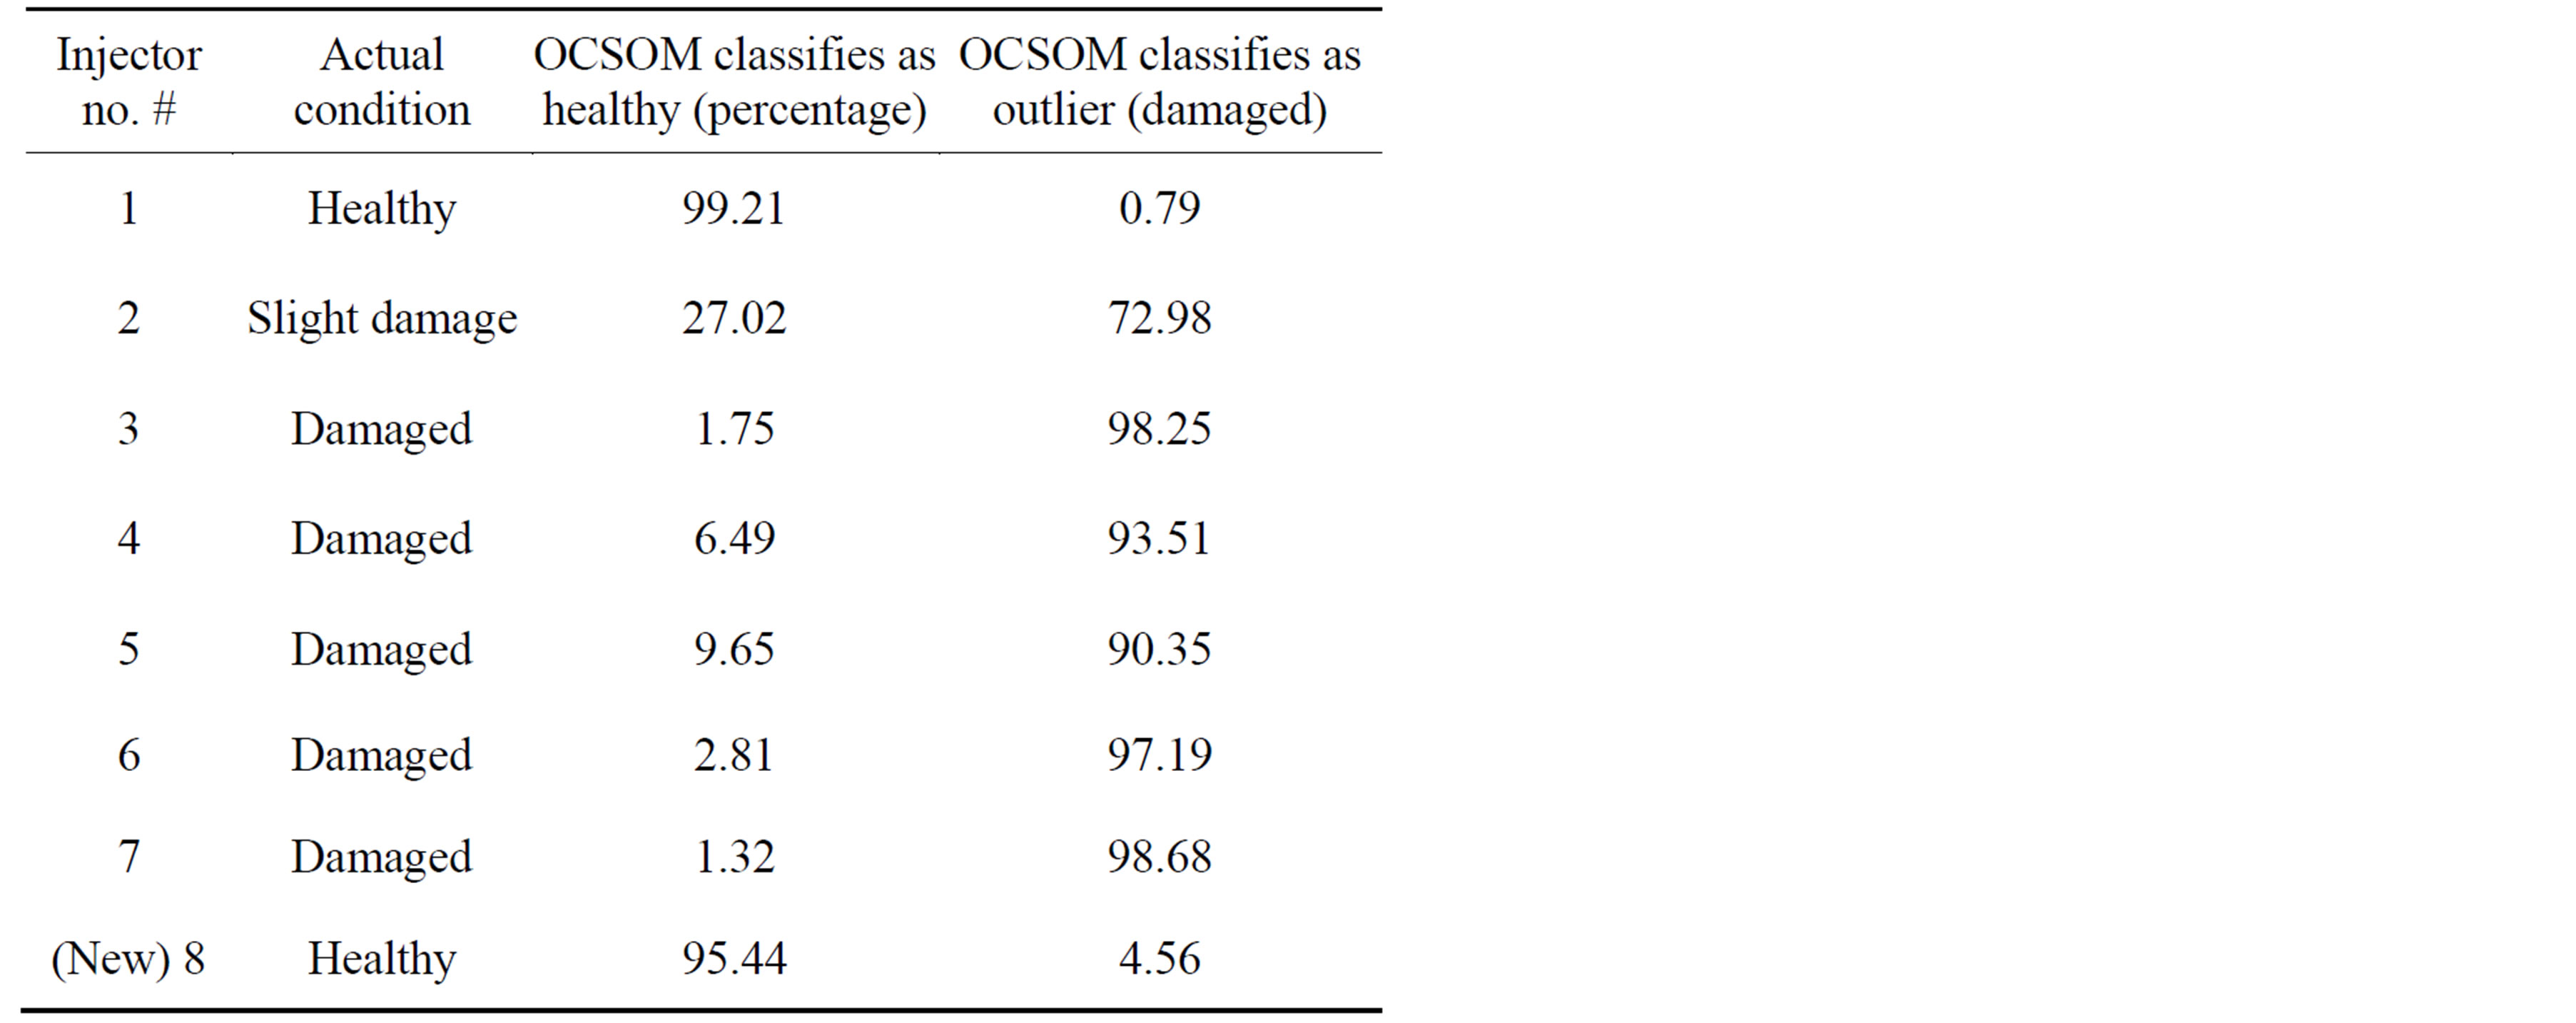
Table 2. Results of OCSOM based classification of fuel-injector health condition.
tates the presence of an experienced human to inspect the waveforms. Furthermore, the application of signal processing and artificial neural networks enabled the quantification of fault incidence with a high accuracy level.
Due to the specific nature of the problem, reliance solely on acoustic signatures from intact injectors, oneclass classification has been utilised. An OCSVM has been used and has given very hopeful results. Furthermore, it was possible to determine correctly the health state of all the injectors classified by the One-Class OCSVM. This result indicates that OCSVM is a robust classifier able to detect injector malfunction with high accuracy. Furthermore, an OCSOM has been used with promising results and in a similar way to the OCSVM it was possible to identify correctly the health condition of all the fuel-injectors presented to the OCSOM. This result indicates that OCSOM can be characterized as a robust classifier able to detect fuel-injector malfunction in a more precise way. A possible enhancement of OCSOM could be the outcome of definition of context sensitive thresholds. Another approach would include activation profiles implemented as a kernel map able to indicate novelty through interpreting neuron activity bursts.
5. Conclusion
The objective of the current work was the diagnosis of fuel injector malfunction in different agricultural tractors by making use of acoustic analysis and signal processing. From the presented results, the conclusion was that certain techniques that are currently used in industrial condition monitoring are easily adaptable for use in agricultural vehicle engine monitoring. The presented original fault detection system can be utilized for the automatic detection of damaged fuel injectors in agricultural tractors. The presented novelty detection methods can be used in other applications where condition monitoring and novelty detection are needed, such as process control, network security and sensor networks in various monitoring applications. A future plan includes an extension of the current work by including more experimental data, different types of features (frequency domain, wavelets etc.) and fault types for various types of fuel-injectors in different diesel engines.
REFERENCES
- A. Albarbar, F. Gu, A. D. Ball and A. Starr, “Acoustic Monitoring of Engine Fuel Injection Based on Adaptive Filtering Techniques,” Applied Acoustics, Vol. 71, No. 12, 2010, pp. 1132-1141. http://dx.doi.org/10.1016/j.apacoust.2010.07.001
- F. Elamin, F. Gu and A. Ball, “Diesel Engine Injector Faults Detection Using Acoustic Emissions Technique,” Modern Applied Science, Vol. 4, No. 9, 2010, pp. 3-13.
- S. Zahi, J. Ragot and F. Kratz, “Structured Hypothesis Tests Based Diagnosis: Application to a Common Rail Diesel Injection System,” Advances in Vehicle Control and Safety, Genova, 2004.
- T. R. Lin, A. C. C. Tan and J. Mathew, “Condition Monitoring and Diagnosis of Injector Faults in a Diesel Engine Using In-Cylinder Pressure and Acoustic Emission Techniques,” 14th Asia Pacific Vibration Conference APVC 2011, The Hong Kong Polytechnic University, 5-8 December 2011.
- F. Elamin, Y. Fan and F. Gu, “Andrew Ball Detection of Diesel Engine Injector Faults Using Acoustic Emissions,” COMADEM 2010: Advances in Maintenance and Condition Diagnosis Technologies towards Sustainable Society, Nara, 28 June-2 July 2010.
- L. Jianmin, S. Yupeng, Z. Xiaoming, X. Shiyong and D. Lijun, “Fuel Injection System Fault Diagnosis Based on Cylinder Head Vibration Signal,” Procedia Engineering, Vol. 16, 2011, pp. 218-223. http://dx.doi.org/10.1016/j.proeng.2011.08.1075
- A. Albarbar, F. Gu and A. D. Ball, “Diesel Engine Fuel Injection Monitoring Using Acoustic Measurements and Independent Component Analysis,” Measurement, Vol. 43, No. 10, 2010, pp. 1376-1386. http://dx.doi.org/10.1016/j.measurement.2010.08.003
- V. Crupi, E. Guglielmino and G. Millazo, “Neural-Network-Based System for Novel Fault Detection in Rotating Machinery,” Journal of Vibration and Control, Vol. 10, No. 8, 2004, pp. 1137-1150. http://dx.doi.org/10.1177/1077546304043543
- SPM Instrument http://www.spminstrument.se/en/Products/Portable-instruments/BearingChecker/
- Y. Lei, Z. He and Y. Zi, “A New Approach to Intelligent Fault Diagnosis of Rotating Machinery,” Expert Systems with Applications, Vol. 35, 2008, pp. 1593-1600. http://dx.doi.org/10.1016/j.eswa.2007.08.072
- D. Moshou, D. Kateris, I. Gravalos, S. Loutridis, N. Sawalhi, Th. Gialamas, P. Xyradakis and Z. Tsiropoulos, “Determination of Fault Topology in Mechanical Subsystems of Agricultural Machinery Based on Feature Fusion and Neural Networks,” 4th International Conference TAE 2010, Czech University of Life Sciences Prague, 2010, pp. 448-453.
- B. Scholkopf, J. Platt, J. Shawe-Taylor, A. Smola and R. Williamson, “Estimating the Support of a High Dimensional Distribution,” Neural Computation, Vol. 13, No. 7, 2001, pp. 1443-1472. http://dx.doi.org/10.1162/089976601750264965
- A. Ypma, “Learning Methods for Machine Vibration Analysis and Health Monitoring,” Ph.D. Dissertation, Delft University of Technology, Delft, 2001.
- R. Saunders and J. S. Gero, “A Curious Design Agent: A Computational Model of Novelty-Seeking Behaviour in Design,” Proceedings of the 6th Conference on Computer Aided Architectural Design Research in Asia (CAADRIA 2001), Sydney, 19-21 April 2001, pp. 345-350.