Modern Mechanical Engineering
Vol.3 No.3A(2013), Article ID:34863,8 pages DOI:10.4236/mme.2013.33A003
Intelligent Fault Detection of Retainer Clutch Mechanism of Tractor by ANFIS and Vibration Analysis
1Department of Mechanical Engineering of Agricultural Machinery, Islamic Azad University, Kermanshah Branch, Kermanshah, Iran
2Department of Mechanical Engineering of Agricultural Machinery, Razi University, Kermanshah, Iran
3Department of Mechanical Engineering of Agricultural Machinery, Islamic Azad University, Takestan Branch, Takestan, Iran
Email: e.ebrahimi57@gmail.com
Copyright © 2013 Ebrahim Ebrahimi et al. This is an open access article distributed under the Creative Commons Attribution License, which permits unrestricted use, distribution, and reproduction in any medium, provided the original work is properly cited.
Received April 21, 2013; revised June 3, 2013; accepted June 18, 2013
Keywords: Fault Detection; Maintenance Clutch Mechanism; Vibration Analysis; Neuro-Fuzzy Inference Systems
ABSTRACT
In this study, ANFIS, as decision support system, is applied to detect the faults of MF 285 mechanism tractor clutch. Maintenance mechanisms include normal mode, rolling element failure, seal failure and attrition-based. Experiments were carried out in three speeds: 1000, 15,000, 2000 RPM and two conditions. The sensor was mounted vertically and horizontally. Vibrating spectrum of the time domain and the frequency of vibration data were obtained. Thirty-three statistical parameters of vibration signals in frequency domain and time were chosen as the sources attribute to detect errors. Finally, the top three features as input vectors to the ANFIS were evaluated. Using statistical parameters the performance of the system was calculated with the experimental data and training of ANFIS model. The system could not provide a seal to identify the fault. Regardless of the vibration data obtained from the classification of the seal, the overall classification accuracy of the ANFIS was 99.14% in the amount of 100% of the sensor installed vertically and horizontally. The results showed that this system can be used as an intelligent diagnosis system.
1. Introduction
Rotating machines are the mainstay of several industrial applications worldwide. They can be found automobile, water industry, wind turbines, agricultural machinery, etc. Failures associated with gears represent the cause of extended outages and are typically caused by gradual deterioration and wear [1].
An important objective of condition-based maintenance (CBM) is to determine the optimal time for replacement or overhaul of a machine. The ability to accurately predict the remaining useful life of a machine system is crucial for its operation and can also be used to improve productivity [2].
Vibration analysis is a powerful tool in machine fault diagnosis. It is a way to check the status of a machine using a special tool. Troubleshooting machines can be more identified in the future and before the crash.
Fault diagnosis of mechanical or electronic components or systems is a subject of expert system applications. Today, neuro-fuzzy devices are emerged by combining network based on adaptive neural networks and fuzzy models. These adaptive networks, based on fuzzy inference system, are called ANFIS. In such systems the desired output will be achieved by means of human knowledge, in the form of if-then rules for the desired input. Dealing with systems that are not well-defined it is not true model the system based on conventional mathematical tools and component identification and therefore the neuro-fuzzy systems could be applied.
Many researchers [3-12] have employed various methuds to detect weak periodic signals using the sensitivity of system parameters. Some of these methods are shock pulse monitoring, crest factor analysis, kurtosis, spectrum analysis, envelope spectrum analysis, wavelet analysis, filtration of signal, etc.
Among the researches carried on machine condition monitoring with vibration analysis using fuzzy logic and neuro-fuzzy networks there are rotary machines fault diagnosis, troubleshooting automotive active suspension system and taking into account the non-linear behavior of hydraulic actuator and significantly the impaired controller, an engine control ventilation, fault diagnosis of bearing rotary, fault diagnosis of rolling bearing [4,7,12], tapered gearbox fault diagnosis [11].
In agricultural tractors, fractures in different parts of the power transmission due to the lack of early detection and location of damage and repair or replace the damaged part will be caused waste of time, cost more to repair and loose time for farming operations which often are duly carried. MF285 Tractor, is equipped with a two stage clutch. The two main types of clutches are necessary. The first resembles a driven plate clutch to power takeoff but the latter is based on the sheath power takeoff. The shaft makes the gear box to move while the pad moves through two gears toward the empowerment shaft. Figure 1 illustrates the position of each component.
Failure on this part will lead to some fraction in other parts specially in gearbox of tractor, on condition of late diagnosis. The overall objective of this research is to present the intelligent detection of some parts of MF285 tractor clutch holder mechanism with high accuracy.
2. Materials and Methods
Classical methods for fault diagnosis include measurable change of system, values of tolerance condition monitoring of machinery health state. This method requires the presence of a person qualified to comment on the health of the defective machine. This study intends to provide an intelligent fault diagnosis system, so that it could help to give a quick decision on machine safety to an expert. In this study the experiments on trial setup of MF285 tractor clutch holder mechanism in a single laboratory unit (Figure 2).
Intelligent system for Condition monitoring is generally, divided to three parts: data acquisition, signal processing and feature extraction and classification of defects. The proposed system for failure detection includes vibration signals collection in data acquisition, data transfer from time zone to frequency zone in signal processing, calculating the most important features in features extraction and finally data entrance to ANFIS and calculating the total classification accuracy.
2.1. Data Acquisition
Data was acquired in two accelerometer sensor direction
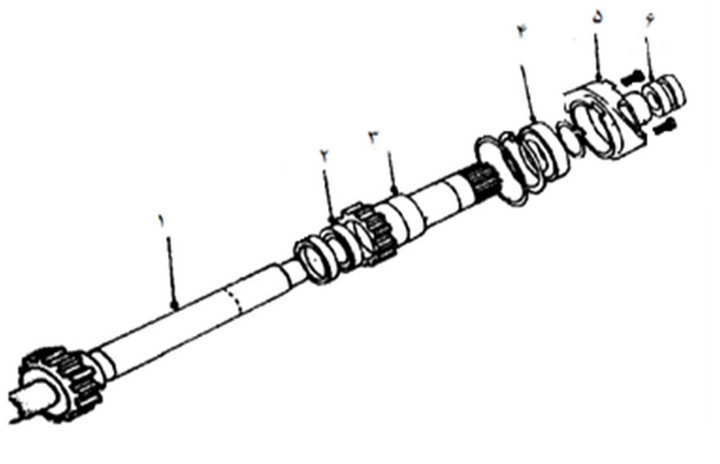

Figure 1. The position of clutch holder mechanism (right) and internal components of clutch holder mechanism (left).
and three rotation speeds include 1000, 1500 and 2000 RPM in safe mode on laboratory setup. The accelerometer was installed in two X and Y directions on the main holder. ARMA Software was used for this purpose and 10,240 voltage data were recorded and saved in an Excel file. Data collected for each sample took 10 s. Total 24 states and 130 vibration data for each state (780 for safe mode and 2340 for down mode and totally 3210 samples) were extracted.
Different failures that may be happen on mechanism were occurred on different parts of clutch holder mechanism (Figure 3) and the vibration data acquired separately. Table 1 shows the specifications of each failure.
Due to the breakdown in rotating machines, time domain signals vary in each fault conditions. Vibrational spectra taken during the time of each of the modes are obtained. A typical vibration spectrum obtained at a moment when the photograph is taken. Figure 4 shows a sample of vibration spectrum obtained during data mapping taken momentarily.
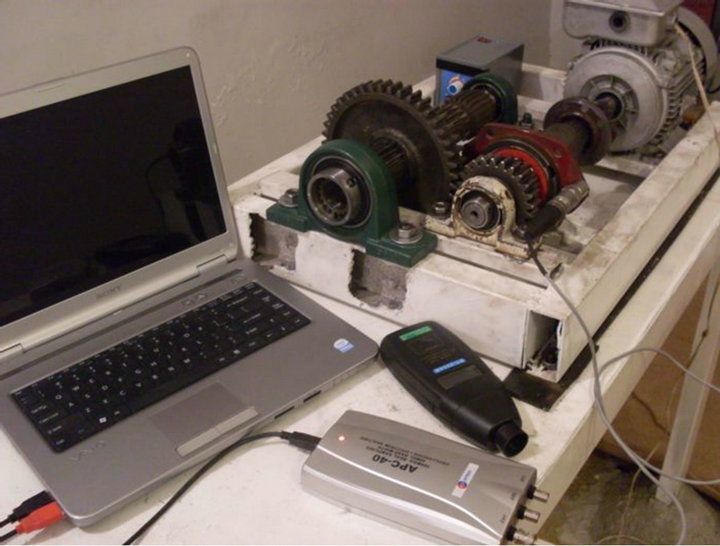
Figure 2. Setup tools and parts used in the laboratory.
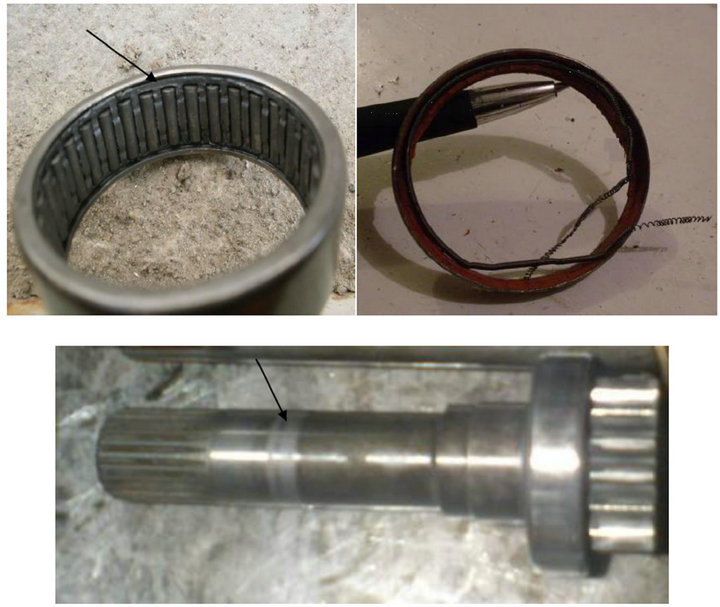
Figure 3. Clutch holder mechanisms failures: seal failure (top-right), roller failure (top-left), PTO shaft friction (bottom).
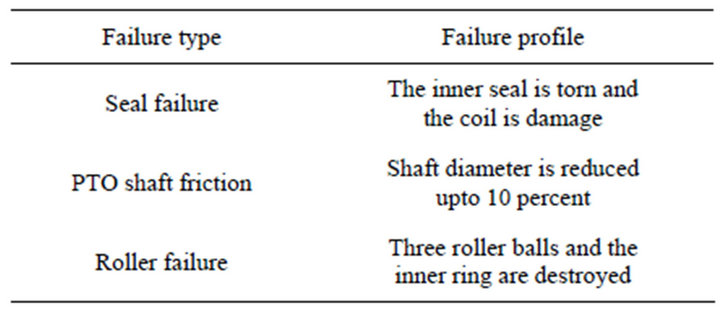
Table 1. Specifications of each failure.
 (a) (b)
Figure 4. Vibrationsignal from health condition (a) andvibrationsignal from fault condition (b) horizontal sensor and 1000 rmp.
2.2. Signal Processing
Signal processing and feature extraction are the most important parts of the monitoring process by which the system feature including safety or failure and the system type could be specified. One common way to provide useful features is to transfer signal from time domain to frequency domain. The analyzer, using the Fourier series, changes the analogous signals of time zone into digital data in frequency zone. For this purpose, at first program the necessary codes in the form of MATLAB. This Excel program contains vibration data and using the filter applied, the data was filtered the noises were eliminated and finally the time and frequency statistical parameters were calculated. So, some conversion feature of Fourier series (FFT) with 10240 points was calculated for each time signal. Also, the power spectrum density (PSD) and phase angle (FFT) of vibration signals were calculated using MATLAB.
Using MATLAB, the diagrams related to vibration spectrum in frequency domain in safe and failure modes were acquired to be analyzed and compared with each other (Figures 5 and 6).
2.3. Feature Extraction
The main purpose of feature extraction techniques is to
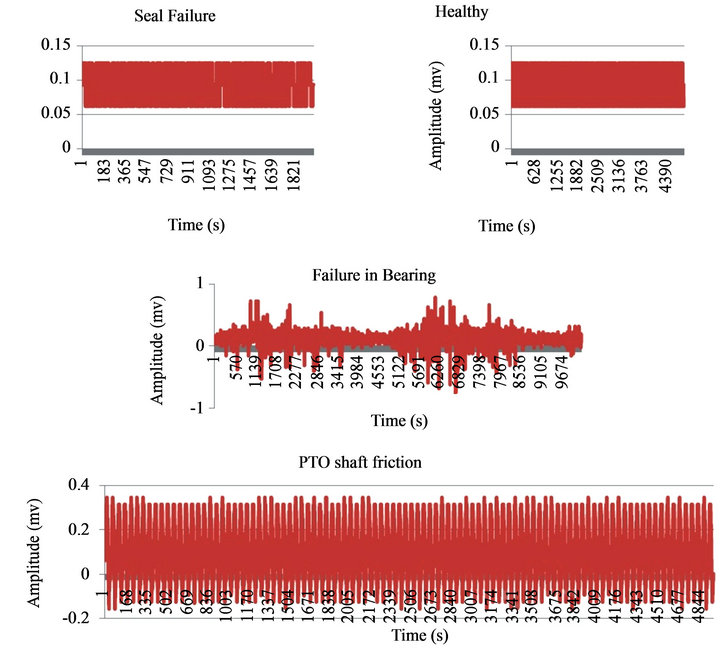
Figure 5. Typical vibration spectra obtained in time domain.
present failure features in signals. In this research, the time domain data with 10240 formed the sample. Also, the frequency domain data points, which is PSD data and FFT phase angle were each 10,240. These signals were used to extract thirty-three features of safe and failure modes. Eleven features (T1 - T11) of time domain statistical parameters and rest of parameters (P1 - P11) and (A1 - A11) form the frequency domain statistical parameters.
2.4. Fault Classification with ANFIS
For better definition of output result each of safe and fault modes have a code to classify the failures (Table 2).
Then in order to data model in ANFIS, 8 models (A - H) were considered for modeling in ANFIS and experimental data were placed in classification (Table 3).
During the initial data mapping and using seal fault in
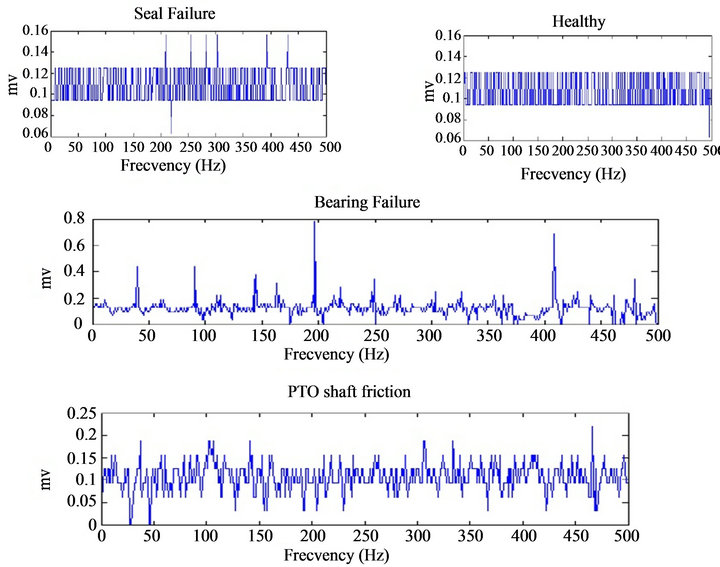
Figure 6. Frequency spectra obtained in frequency domain.

Table 2. Code definition for each safe and failure mode.
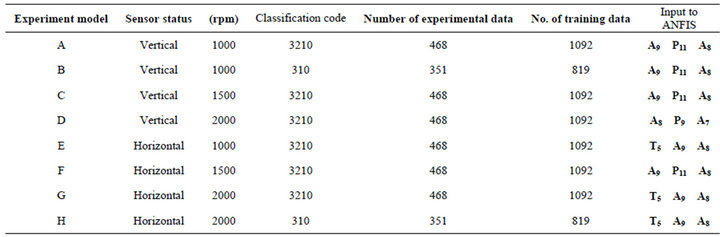
Table 3. Modes classification and input data to ANFIS.
laboratory model, the vibration resulted from seal fault were felt less than safe mode and no significant difference was observed from initial comparison of data obtained from seal failure and safe mode and their vibration spectra. On the other hand, after investigating data related to seal fault, in order to select super features, less significant features from data on seal fault were observed. So, it was assumed that the present system could not have a good show of defects resulted from seal fault. Therefore, the data related to seal fault were eliminated in B and H models and other data were entered into the network.
3. Results
The FFT diagram is the most applicative device for the vibration analysis. But much information on machine behavior may be eliminated in FFT diagram for various results like: some frequencies filtering, the adjacent frequencies overlap regarding the selective clarity. The neuro-adaptive techniques provide some method to make a phase modeling trend along with information learning from a data collection. In order to evaluate the proposed fault detection system the vibration data were placed in classification and 8 models were considered for modeling and entering the ANFIS network. The ANFIS feature vector was extracted for each model in different sensor modes and rotations per each three features. For the experiment models, in order to train and test the data, better significant features which made better results using the failure and try method were applied to enter the network. 70% data in each model were assigned to train and 30% were loaded to test in the network. To obtain better results the input and output membership features and different training periods were considered. Also, the initial value of 1% as the step size was formed for the parameters adaptation. After loading for all models, the failure diagram was drawn based on didactic periods. Then, the rules monitor form, fuzzy rules, fault detection topology and levels diagram were extracted for each separate model. Meanwhile, from the results obtained of ANFIS, the mean square error (MSE), sum of square error (SSE), correlation coefficient (R), mean absolute error (MAE), the degree of significance (P) and the prediction were obtained (Table 4).
By observing the result of ANFIS and counting correct answers, confusion matrix for the entire model was established. In Table 5 the confusion matrix is illustrated for model B.
Diagonal elements in matrix represent the number of correct answers.
Overall classification accuracy, sensitivity and statistical are two statistical criteria to elevate the performance of the system in classification. These criteria are defined

Table 4. The best results of the ANFIS models in different experiment.
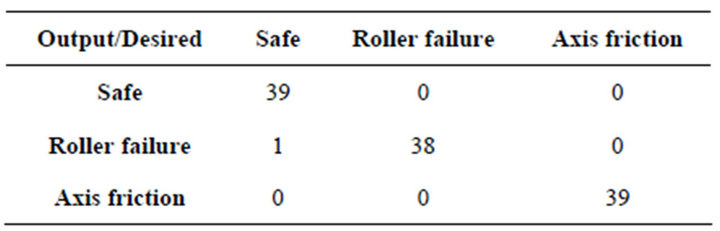
Table 5. The confusion matrix for flaw detection in model B.
as follows:
Sensitivity equals to the number of correct positive decisions divided by total possible decisions. Total classification accuracy equals to the number of correct decisions divided by total possible decisions. Finally, the statistical criteria were obtained to detect system performance in classifying each model (Table 6).
In order to compare the success of failure detection of the models together, a description of overall classification accuracy in each case is shown as diagram (Figure 7). In model B the total classification accuracy were 99.14% and the highest amount of accuracy 100% was obtained in model D, which is desired. Also, the total classification mean accuracy of fault detection system with vertical sensor 76.41 and horizontal sensor 71.47 was obtained (Figure 8).
4. Conclusion
In this study, vibration data resulted from experimental setup were obtained using the data acquisition system. Statistical features of time and frequency domain were obtained for different failures detection and among them three super features were selected to enter the ANFIS network. 8 models were places in classification to detect the failure. In two models (models B and H), the seal fault was not placed in classification. After calculating statistical parameters, the total classification accuracy in
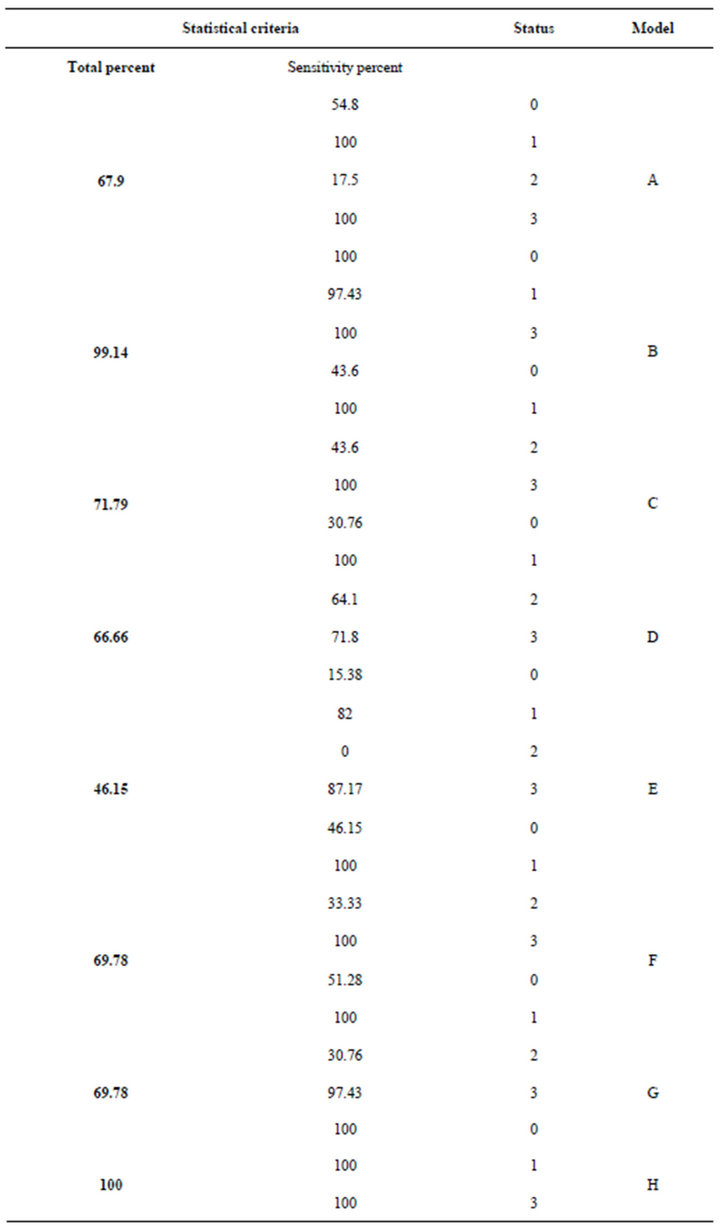
Table 6. Statistical criteria and classification accuracy obtained in all test models.
 (a)
(a) (b)
(b) (c)
(c) (d)
(d)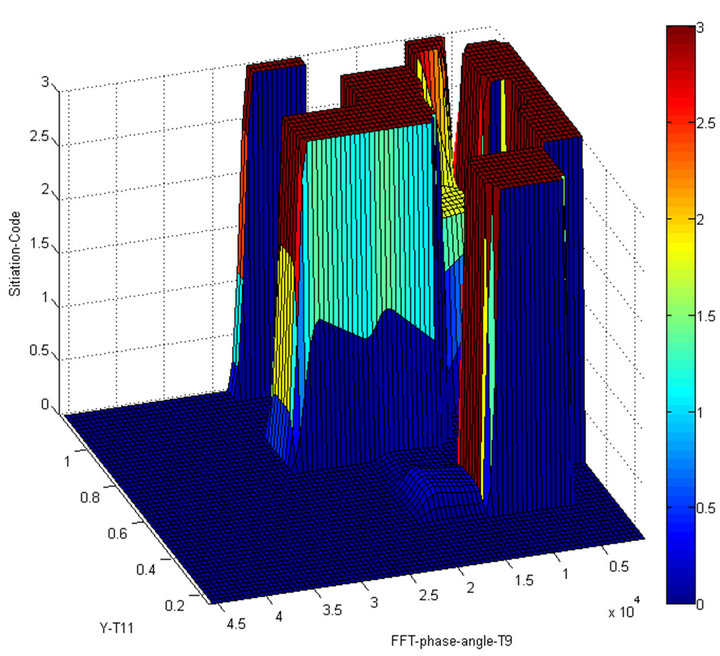 (e)
(e)
Figure 7. (a) The extraction of fuzzy rules; (b) Designed ANFIS topology; (c) Rules monitor, regression diagram on predictions; (d) The extraction of levels monitor in model B; (e) The topography of model.

Figure 8. Diagram of total classification accuracy based on experiment models.
model D and H were, respectively, 99.14 and100 percents. Comparing the results of total classification accuracy obtained from ANFIS models showed the assumption that the seal failure makes little vibration is true and the proposed fault detection system was not able to show the seal failure. As a whole, the results showed that using intelligent neuro-fuzzy logic could be an effective method to detect the failures in clutch holder mechanism.
5. Acknowledgements
The authors would like to thank Islamic Azad University, Kermanshah Branch for its support to this research.
REFERENCES
- M. Elforjani, D. Mba, A. Muhammad and A. Sire, “Condition Monitoring of Worm Gears,” Applied Acoustics, Vol. 73, No. 8, 2012, pp. 859-863. doi:10.1016/j.apacoust.2012.03.008
- H.-E. Kim, A. C. C. Tan, J. Mathew and B.-K. Choi, “Bearing Fault Prognosis Based on Health State Probability Estimation,” Expert Systems with Applications, Vol. 39, No. 5, 2012, pp. 5200-5213. doi:10.1016/j.eswa.2011.11.019
- D. G. Lewicki and H. J. Decker, “Transmission Bearing Damage Detection Using Decision Fusion Analysis,” Glenn Research Center, Cleveland, Army Research Laboratory, NASA/TM, 2004, pp. 1-20.
- G. Goddu, B. Li, M. Chow and J. Hung, “Motor Bearing Fault Diagnosis by Fundamental Frequency Amplitude Based Fuzzy Decision System,” Development of Electrical and Computer Engineering, North Carolina University, 1998, pp. 1961-1965.
- N. Hotwai, “Vibration Analysis of Faulty Beam Using Fuzzy Logic Techique,” Department of Mechanical Engineering National Institute of Technology, Rourkela, 2009, pp. 23-27.
- Ch. Kong, J. Ki, S. Oh and J. Kim, “Trend Monitoring of a Turbofan Engine for Long Endurance UAV Using Fuzzy Logic,” KSAS International Journal, Vol. 9, 2008, pp. 64-70.
- Z. Kiral and H. Karagülle, “Simulation and Analysis of Vibration Signals Generated by Rolling Element Bearing with Defects,” Department of Mechanical Engineering, Dokuz Eylul University, Turkey, 2003, pp. 667-678.
- Y. Lei, Z. Hea, Y. Zia and Q. Hua, “Fault Diagnosis of Rotating Machinery Based on Multiple ANFIS Combination with Gas,” Department of Mechanical Engineering, Xi’an Jiaotong University, Xi’an, 2003, pp. 667-678.
- Y. A. Lei, Z. He and Y. Zi, “A New Approach to Intelligent Fault Diagnosis of Rotating Machinery,” Expert Systems with Applications, 2008, pp. 1593-1600.
- R. Martins Marcal, K. Hatakeyama and A. Susin, “Managing Incipient Faults in Rotating Machines Based on Vibration Analysis and Fuzzy Logic,” Electrical Engineering Department, 2006, pp. 1-6.
- N. Saravanan and S. Cholairajan, “Ramachandran Vibration-Based Fault Diagnosis of Spur Bevel Gear Box Using Fuzzy Technique,” Department of Mechanical Engineering, Amrita Vishwa Vidyapeetham, India, 2009, pp. 3119-3135.
- J. H. Singonahalli and N. R. Iyer, “Etection of Roller Bearing Defect Using Expert System and Fuzzy Logic,” Department of Mechanical Engineering, California University Sacramento, Sacramento, 1996, pp. 596-613.