Modern Mechanical Engineering
Vol.3 No.3(2013), Article ID:36145,9 pages DOI:10.4236/mme.2013.33018
Use of Vehicle Power-Train Simulation with AMT for Fuel Economy and Performance
Automotive Engineering Department, Faculty of Engineering, Helwan University, Cairo, Egypt
Email: nagwaibrahim2006@yahoo.co.uk
Copyright © 2013 Nagwa Ahmed Abdel-Halim. This is an open access article distributed under the Creative Commons Attribution License, which permits unrestricted use, distribution, and reproduction in any medium, provided the original work is properly cited.
Received March 4, 2013; revised June 9, 2013; accepted June 22, 2013
Keywords: Automated Manual Transmission (AMT); Dynamic Characteristics; Dynamic Performance Simulation; Fuel Economy
ABSTRACT
Frequent stops and starts for the traffic lights as well as acceleration/deceleration, rather than at constant speed, are the most common transient operating conditions. Consequently, understanding the dynamic characteristics of the powertrain system is vitally important in designing an efficient and fresh vehicle. To investigate the dynamic characteristics of the road vehicle performance, apart from a real road testing, it is necessary to set up a numerical test bed for dynamic performance simulation. The latter is even more convenient, costless and data repeatable. However, the aim of the present paper is to establish a computer simulation package by which the road vehicle power-train system design is developed for a small passenger vehicle based on fuel economy and performance. Furthermore, a proposed professional computer program of Automated Manual Transmission (AMT) system related to organizer algorithm of attractive gearshift requests is also introduced. The result of the proposed AMT ensures that the drive wheels forces balance in order to keep gear shift, to kick down or up not only shift feel but also the fuel consumption, and to alarm by near a specific failure or to get back system performance.
1. Introduction
To develop the road vehicle power-train system design based on fuel economy and performance a computer simulation package was established for a small passenger vehicle. The developed vehicle power-train system is included automated manual transmission (AMT). AMT has additional advantage rather than the manual transmission (MT) in which the clutch works by an actuator is controlled by number of solenoids instead of manual operation. Also, the transmission select and shift speeds are achieved by actuators and valves. The program is based on calculation difference between vehicle tractive effort Ft and total resistance; also predict by near a specific failure and control it by get back system performance modification.
It is well understood that for the vehicle power train design, the targets are always to achieve minimum fuel consumption, best derivability and acceptable air pollution. On the other hand, the main cause of unwanted emissions and bad fuel economy is the transient operation conditions [1].
In the past, there are some power-train simulation techniques published to aid the design of the vehicle performance predictions and/or experiments. These techniques are normally termed as, transient-reconstruction technique; because they reconstruct the transient performance from steady state engine performance maps to evaluate the real transient operation. Although this technique is significantly reduces the computational time, the drawback comes from the discrepancy between the simulation condition and the real operation. The main reason is the absence of modeling the dynamic characteristics of the thermal power engine, such as transient effects during acceleration/deceleration [2-5].
The introduction of methods for operating a manual transmission for heavy duty trucks with diesel engine is introduced. The basic logic of the methods is to select the most economical gear position among usable gear positions and to achieve compatibility of fuel economy with drivability. The usable gear positions which mean gear position appropriate for drivability are determined from vehicle acceleration, engine speed, gear position used, etc. While the most economical gear position is determined by comparison of engine specific fuel consumption data between each usable gear position for the same running resistance and vehicle speed [6-8].
In this paper, a professional computer program of AMT system was proposed, which is mainly evolved from a vehicle spark ignition engine. The program uses vehicle speed (or road load) simulation technique. The main aim of the simulation technique is to do the optimum gear change according to the fuel economy based on the data obtained of the vehicle speed, road load and the behavior of the driver. The major input includes the engine/power-train/ vehicle specifications (which may be obtained from its workshop manual); the operation schedule (includes the instantaneous engine speed, vehicle speed, throttle, clutch, and gear positions which are exactly same as those controlled by the driver). The major output consists of the instantaneous vehicle resistances, acceleration or deceleration and the fuel flow rate, and those accumulated results such as accumulated fuel consumption, traveling distance, etc and alarm by near a specific failure, which are regarded as the basic vehicle performance. This model is derived from the engine, the power-train and the vehicle dynamics.
2. Vehicle Designed Parameters
2.1. Engine Power at Full Open Throttle Valve
Accurate engine performance information giving the specific fuel consumption at different loads and speeds is essential if fuel consumption over the test cycle has to be accurately computed. Such performance is commonly presented, either in a power/speed or torque/speed or fuel consumption/speed or engine efficiency/speed form. The power/speed and torque/speed characteristics can be constructed from an empirical formula, if the maximum power, Pemax (in kW) and the angular velocity, ωN (rad/s) are known. One of the empirical formulas suggested to be used is illustrated below [2]:
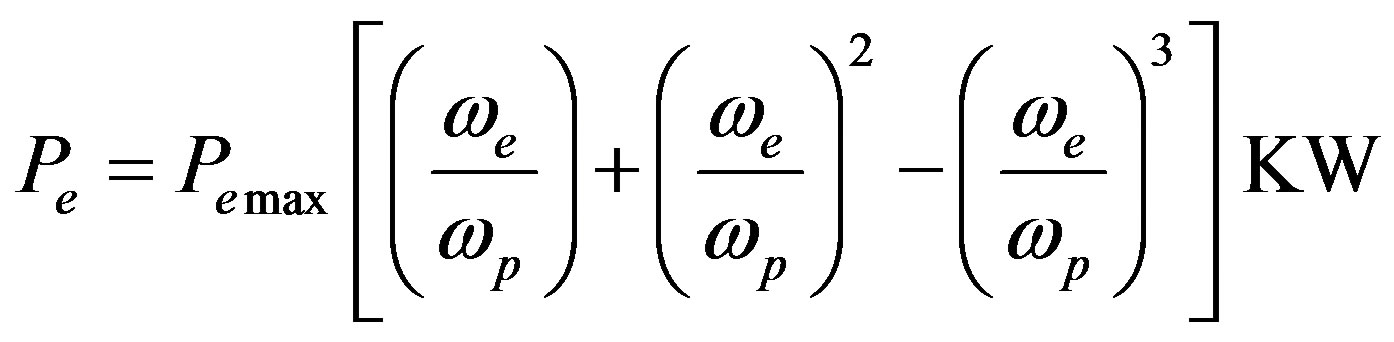 (1)
(1)
Having specified the angular velocities ωe and estimated their corresponding values of the power Pe, the speed characteristic of the power  can be plotted and then the speed characteristic of the torque
 . The values of the torque, Me, can be found from the formula [2]:
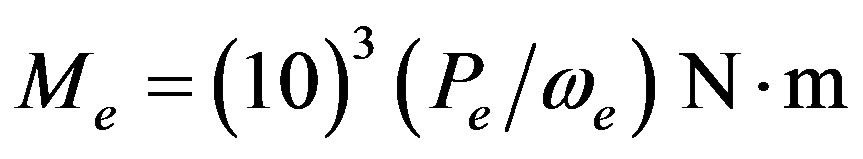 (2)
(2)
2.2. The Desirable Number of Gear Changes
The most desirable number of gear changes depends on the difference between the highest and the lowest gear ratios. In most automotive transmissions the gear ratios come fairly close to forming a geometrical series. The diagram there shown applies to a five-speed passenger car transmission. The cars may be accelerated in the first gear until the engine turns over at np rpm, which corresponding to a little over V1 km/hr road speed. This is indicated in the diagram by the first sloping line on the left. For acceleration above this speed the gearbox is shifted to the second shift, which pulls down the engine speed until the engine again reached nm rpm. In second gear the car is allowed to accelerate until the engine again reached np rpm, and then the change to third gear is made, which again slows the engine down to nm rpm. After bringing the engine up to np rpm in third gear, the transmission is shifted into higher shift and the process is repeated until the gear shift reached to the highest reduction ratio. This would insure that in each gear change the fuel economy characteristics are similar [2,3]. The reduction ratios come from the following formula:
Or
 (3)
(3)
3. Road Dynamic Properties of a Motor Vehicle
3.1. Vehicle Power Balance
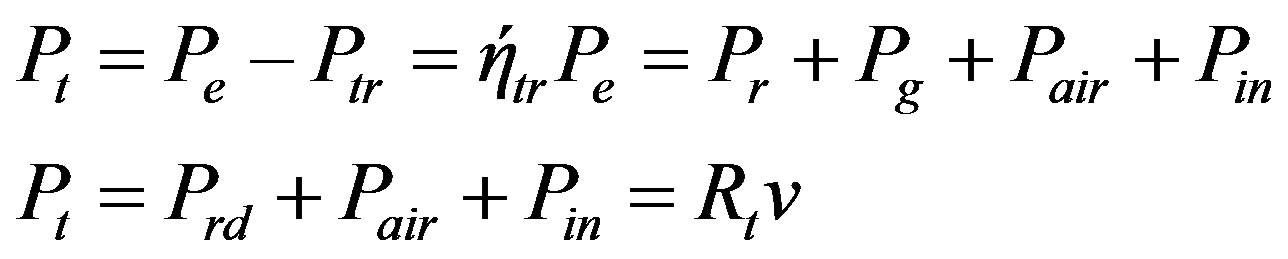
The dynamic properties of a passenger motor vehicle can be analysed by comparing the tractive power which is produced from the engine and the power required to overcome the vehicle motion resistance during ascent and acceleration, the equation of power balance is [2].
 (4)
(4)
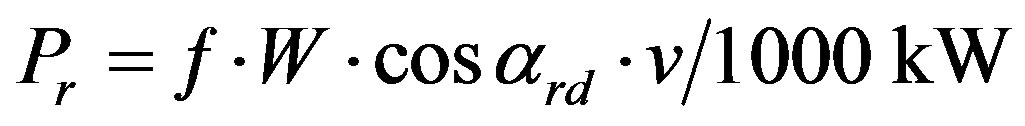
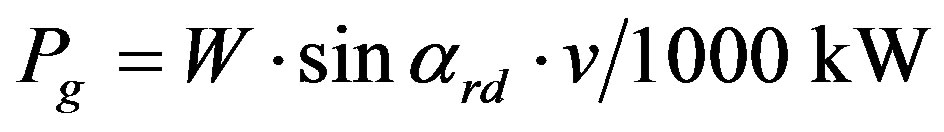
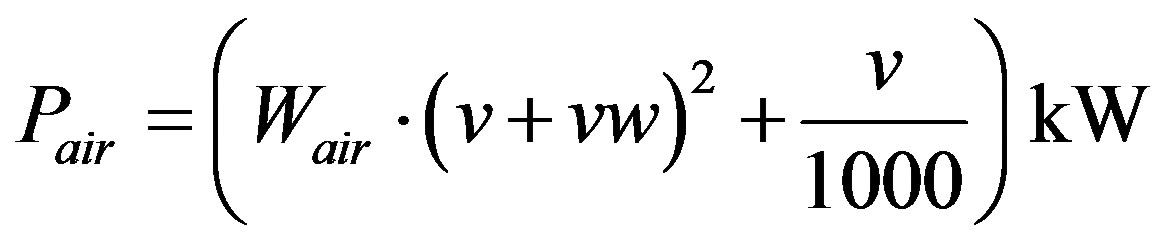
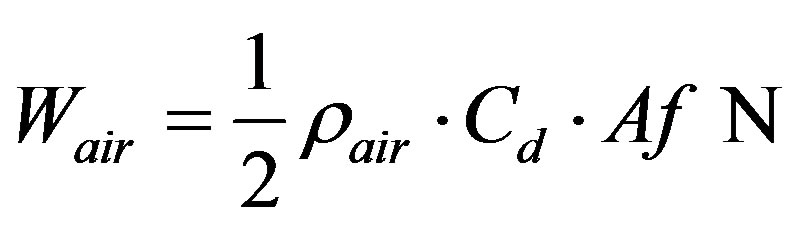
Or can be calculated from
The dynamic certificate of a motor vehicle is a combination of the dynamic characteristics, load monogram and skidding control graph. The certificate makes it possible to solve the equation of motion with design parameters of a vehicle, basic characteristics of the road and the vehicle load [2].
 (5)
(5)
3.3. Vehicle Fuel Consumption
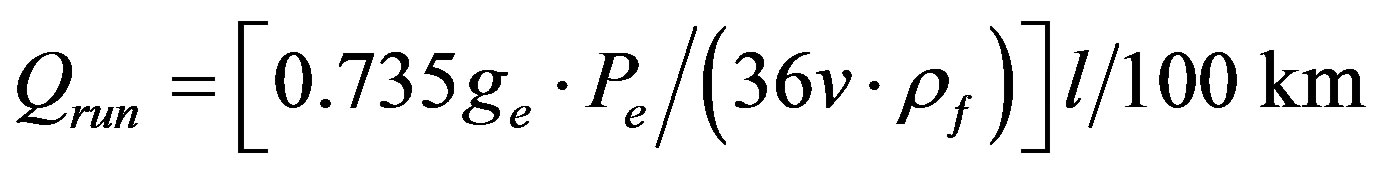
The fuel consumption for a unit can be easily determined rather easily, but it does not take into account the transport operation undertaken by the vehicle, and this may result in wrong conclusions when fuel economy is evaluated. Thus, when a vehicle carries a load its fuel consumption per unit run is always greater than with the same vehicle operating in the identical conditions but without load. However, the fuel consumption for a run of 100 km in liters can be estimated based on the following formula [2]:
 (6)
(6)
4. Application
4.1. Data Description
In this application, the modeling analysis stated above was applied on a vehicle. The vehicle is equipped by spark ignition internal combustion engine as a propulsion system, where its dynamic parameters and technical specifications are listed in Table 1. The engine performance information is in a power/speed and torque/speed form and is shown in Figure 1.
4.2. Results and Discussions
The velocity/engine-speed diagram Figure 2 gives a good overview of appropriate configurations of the transmission ratios and is reference to a geometrical series for number of gearbox reduction ratios. As mentioned in Secction (2.2) the number of gear changes can be designed related to the maximum and minimum allowable vehicle speed which depends on many factors. This design follows the geometric gear index which can be changed slightly in practice. The gear ratios can be adapted to the vehicle by a bench tests, road tests and computer simulation of field condition.
Figure 3 shows the traction versus vehicle speed. These shows explain how the difference gaps between the available traction are reduced in the higher reduction
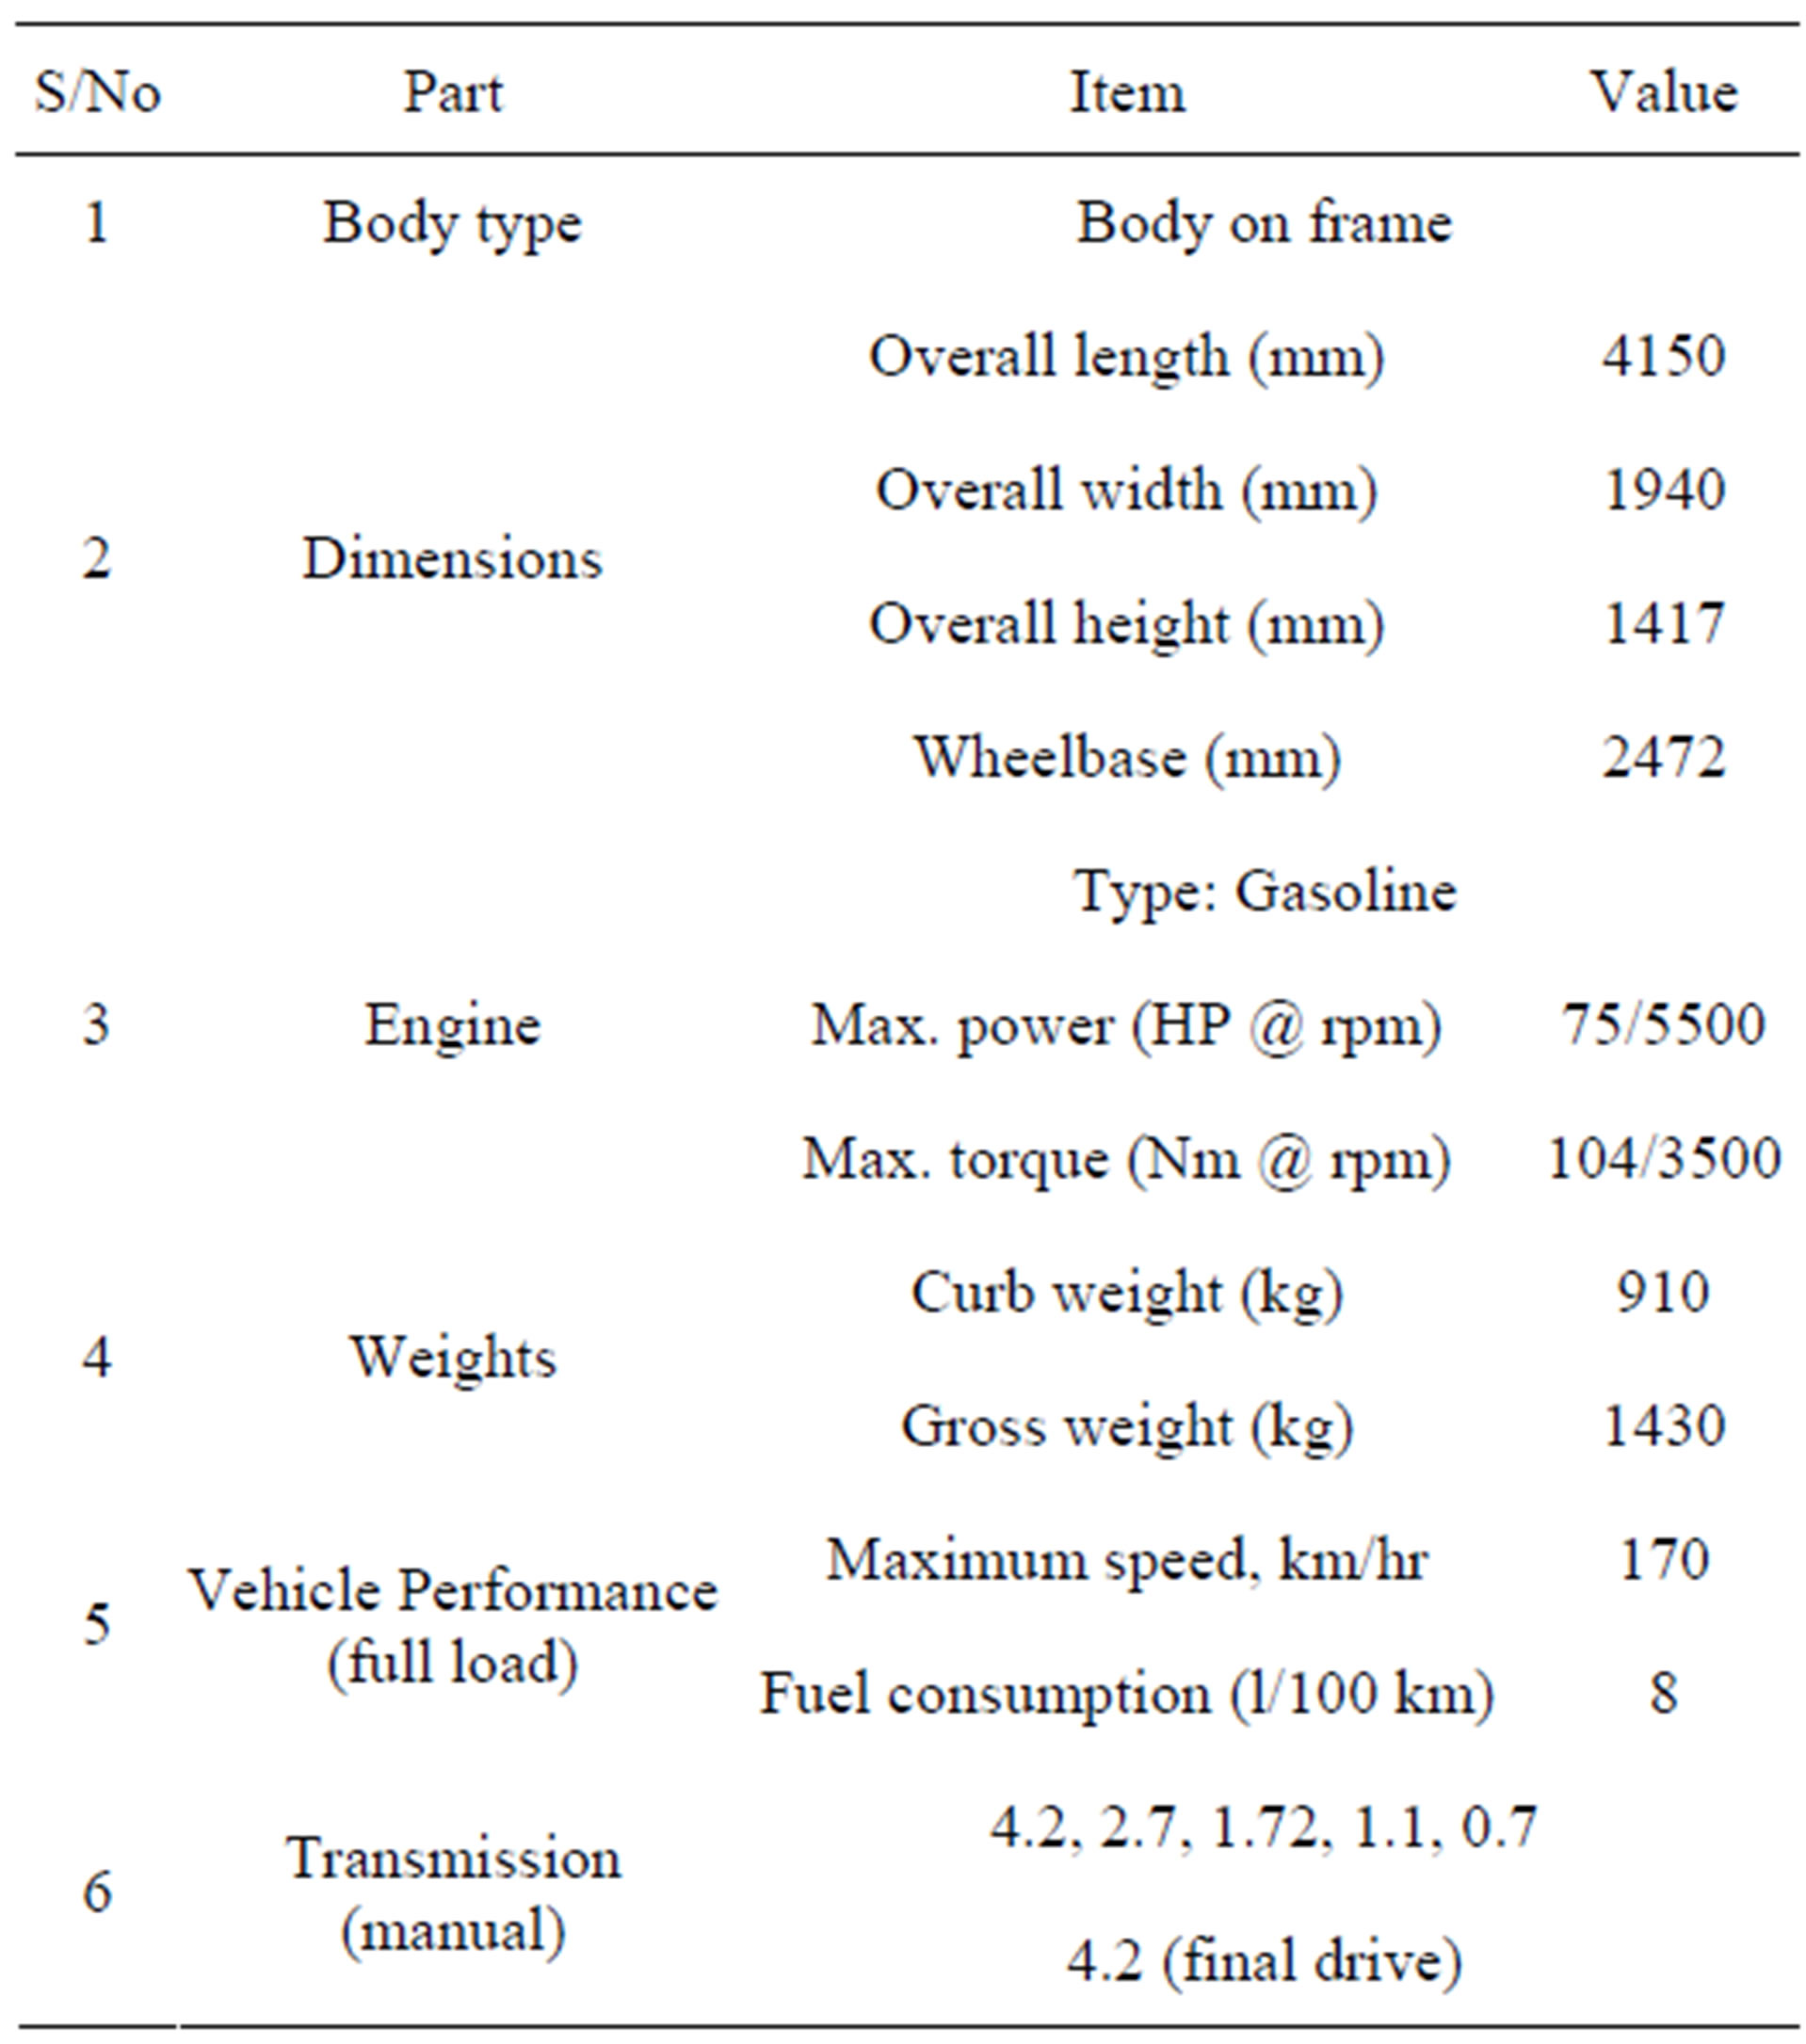
Table 1. Small passenger car technical specifications.
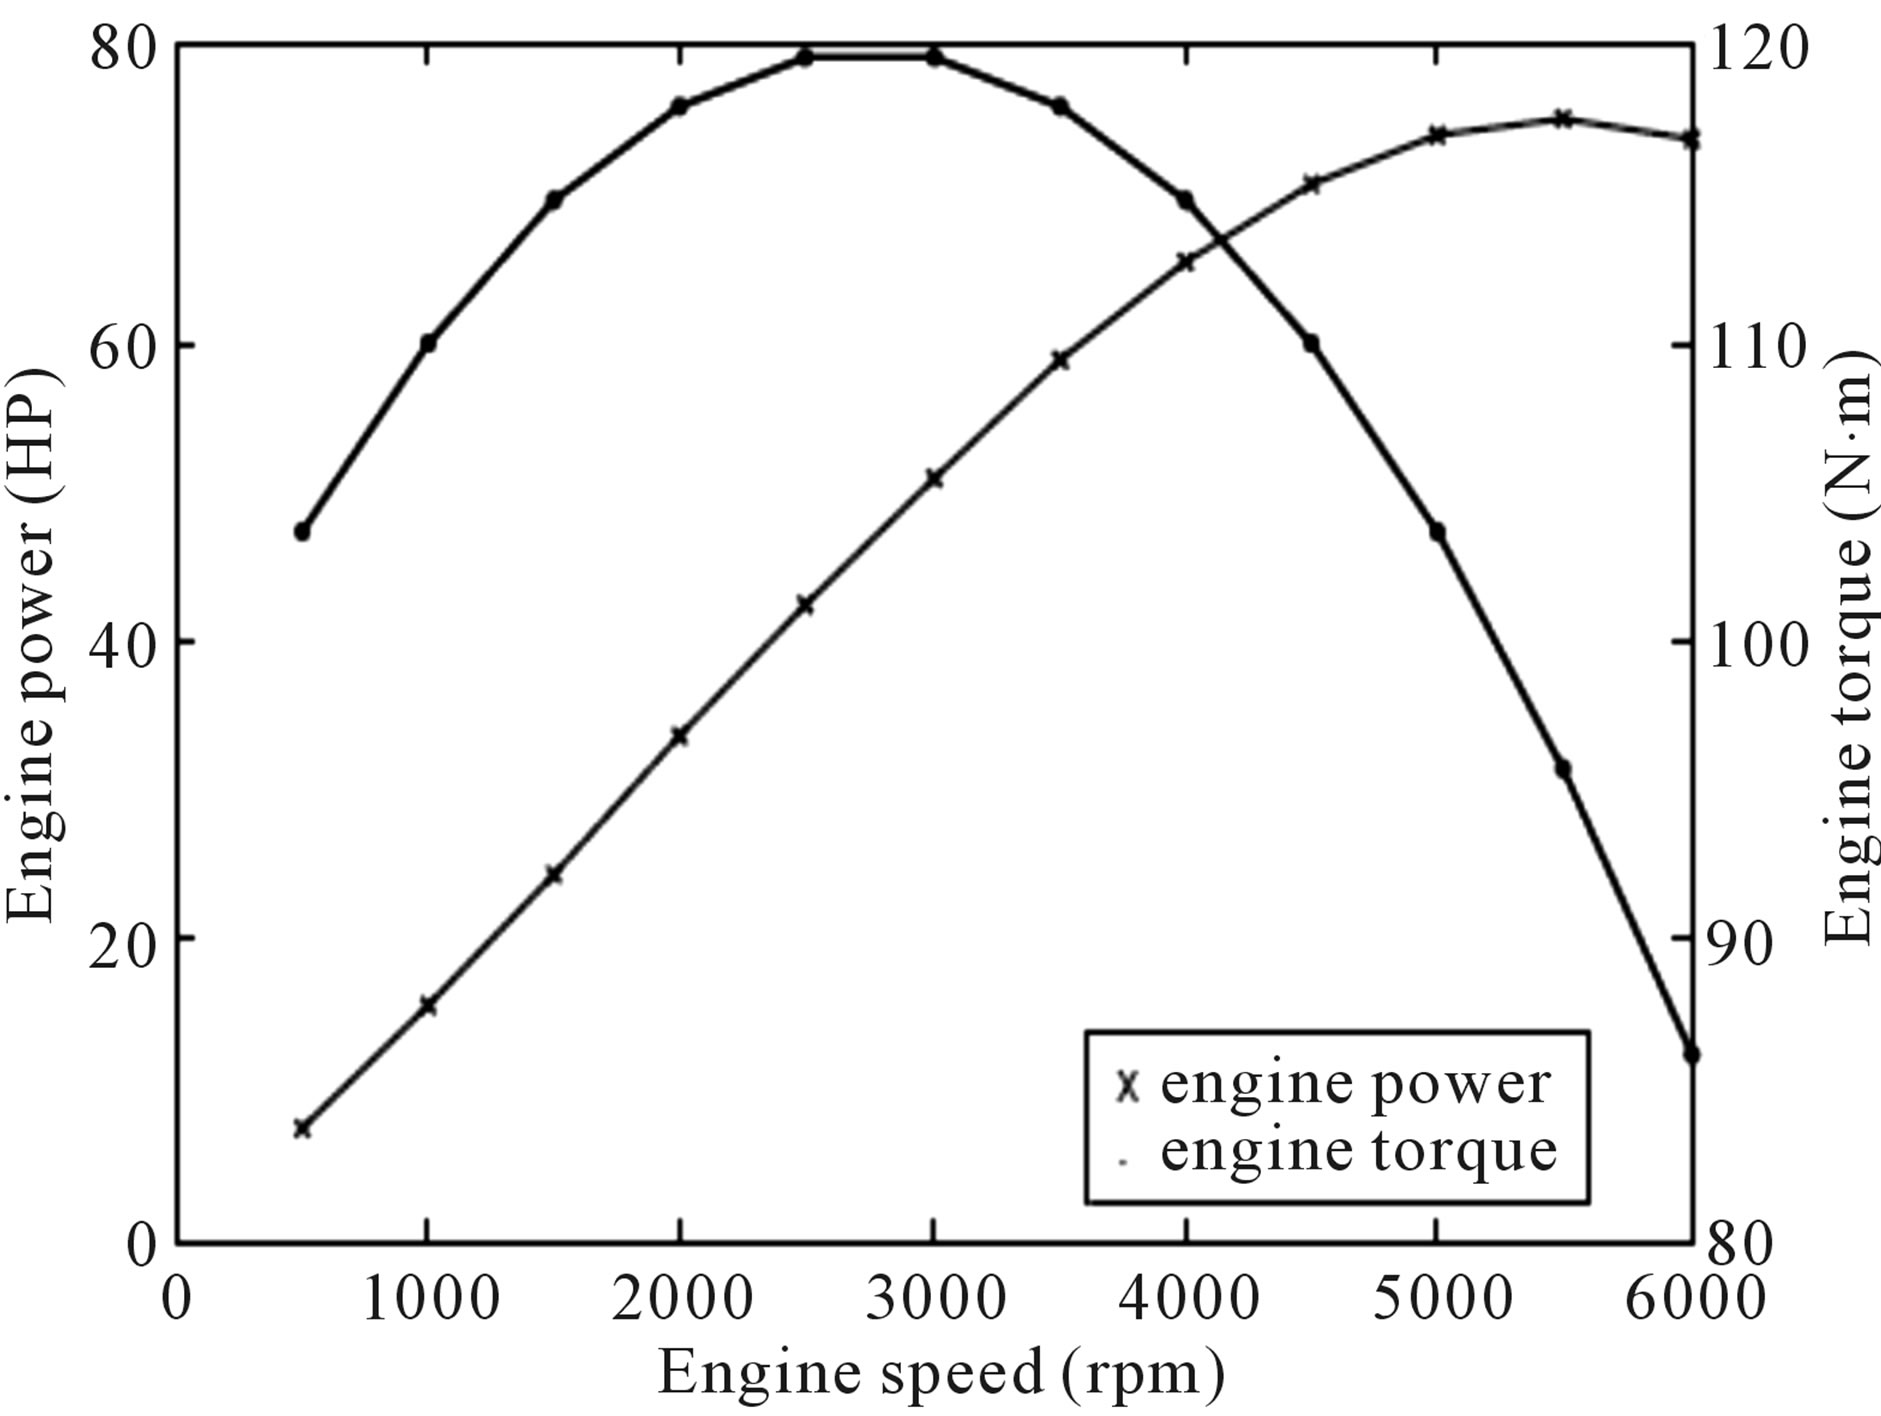
Figure 1. Speed characteristics of the spark ignition engine.
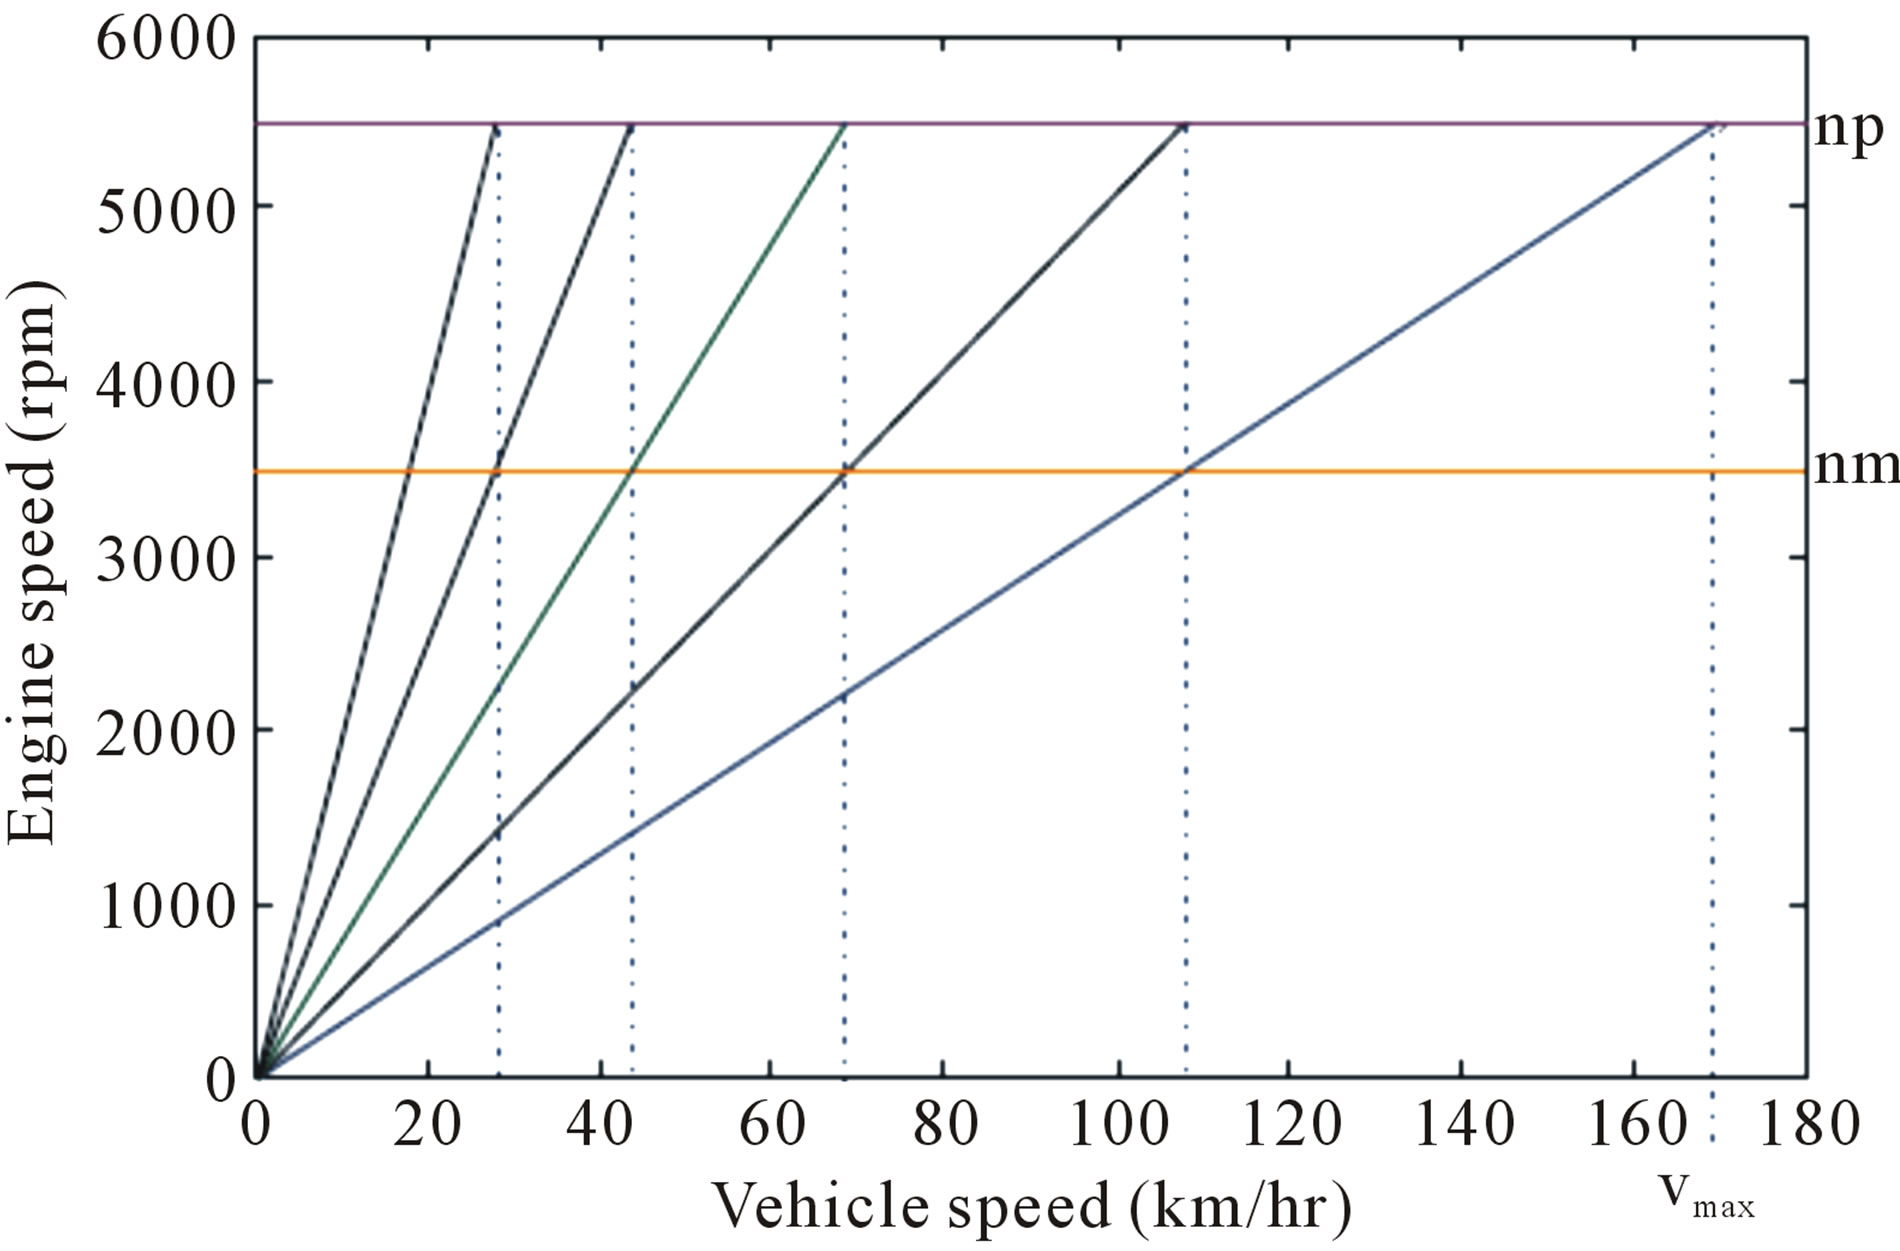
Figure 2. Desirable number of gear changes.
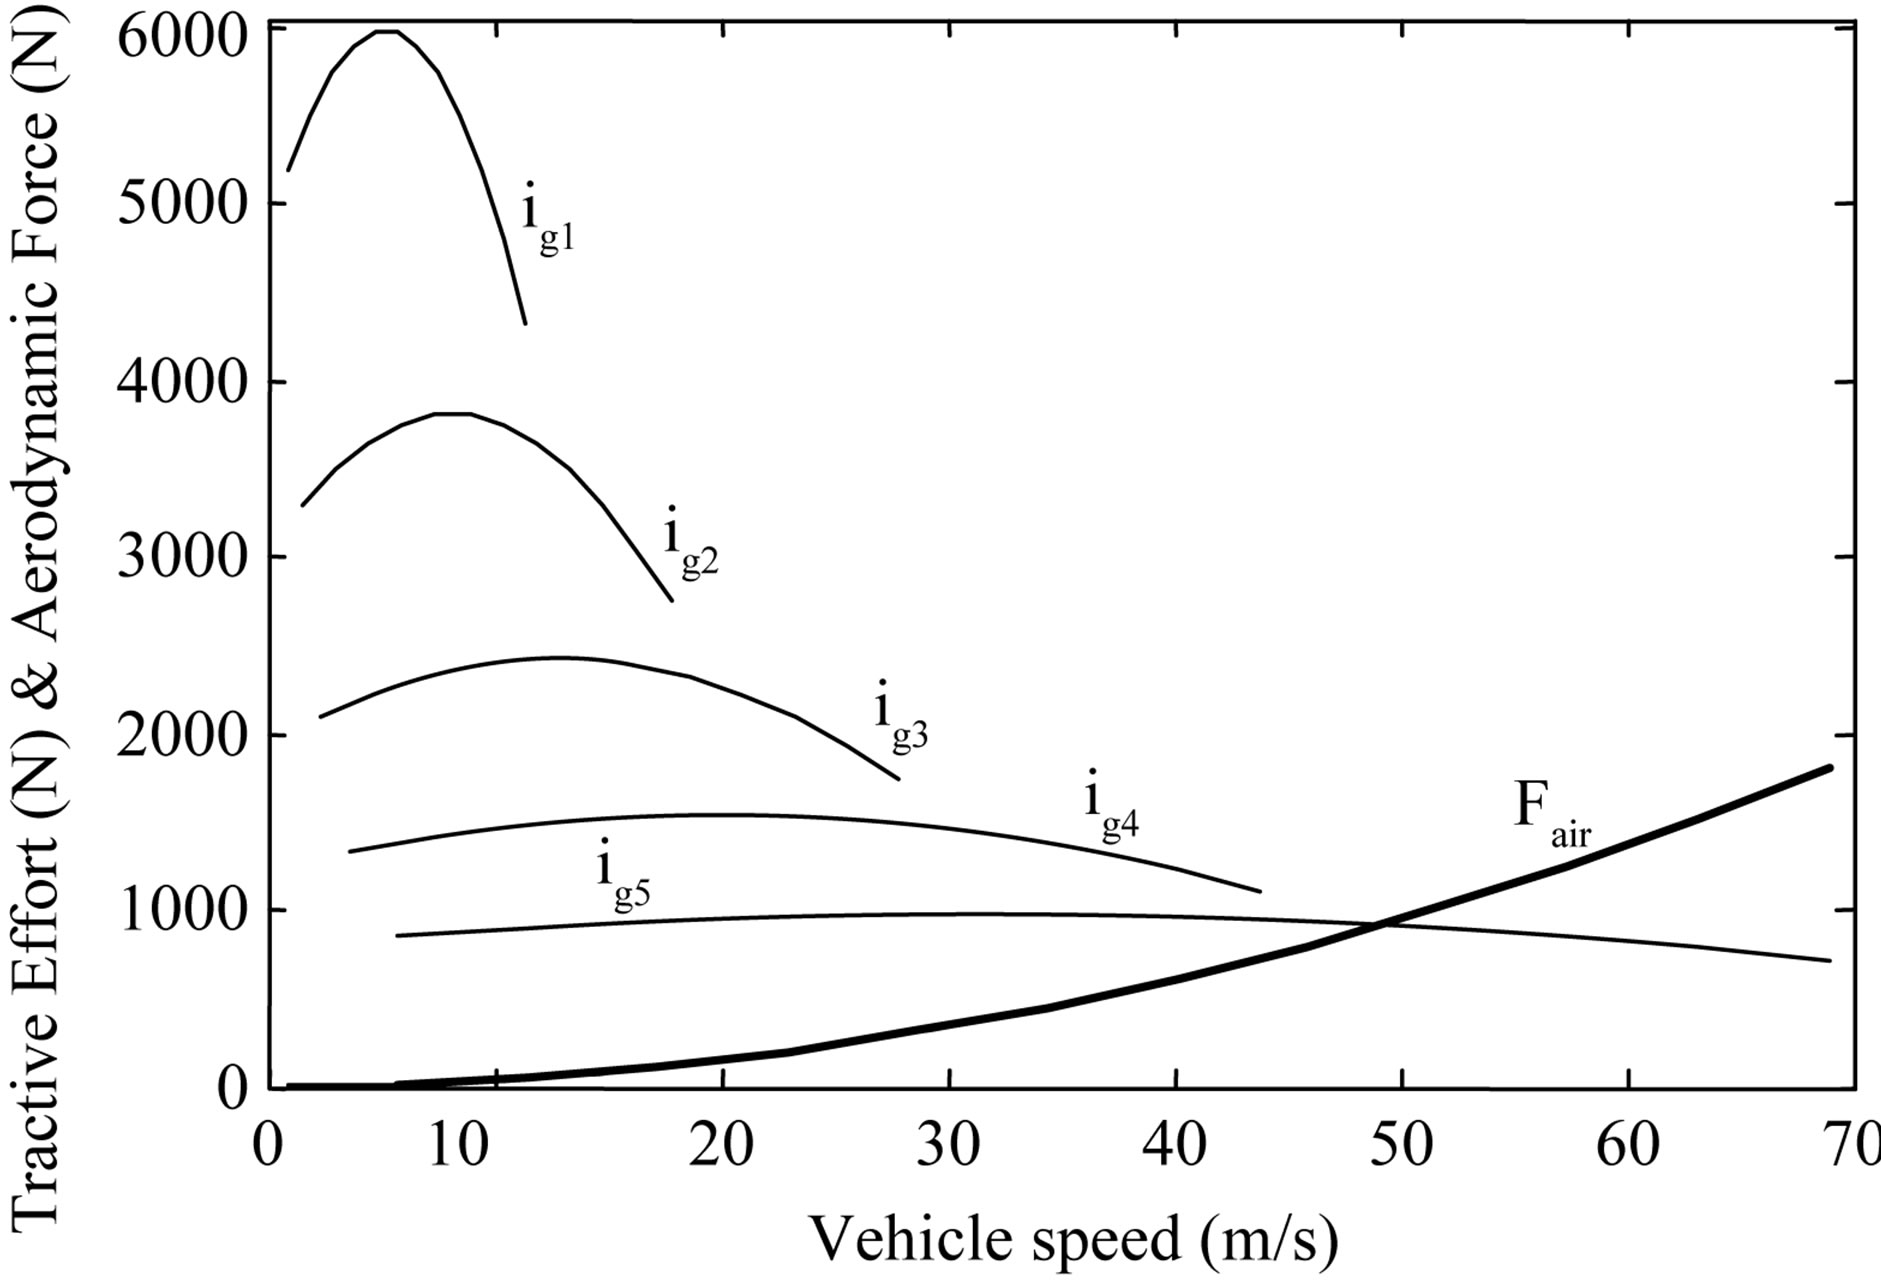
Figure 3. Tractive efforts and resistances versus vehicle speed.
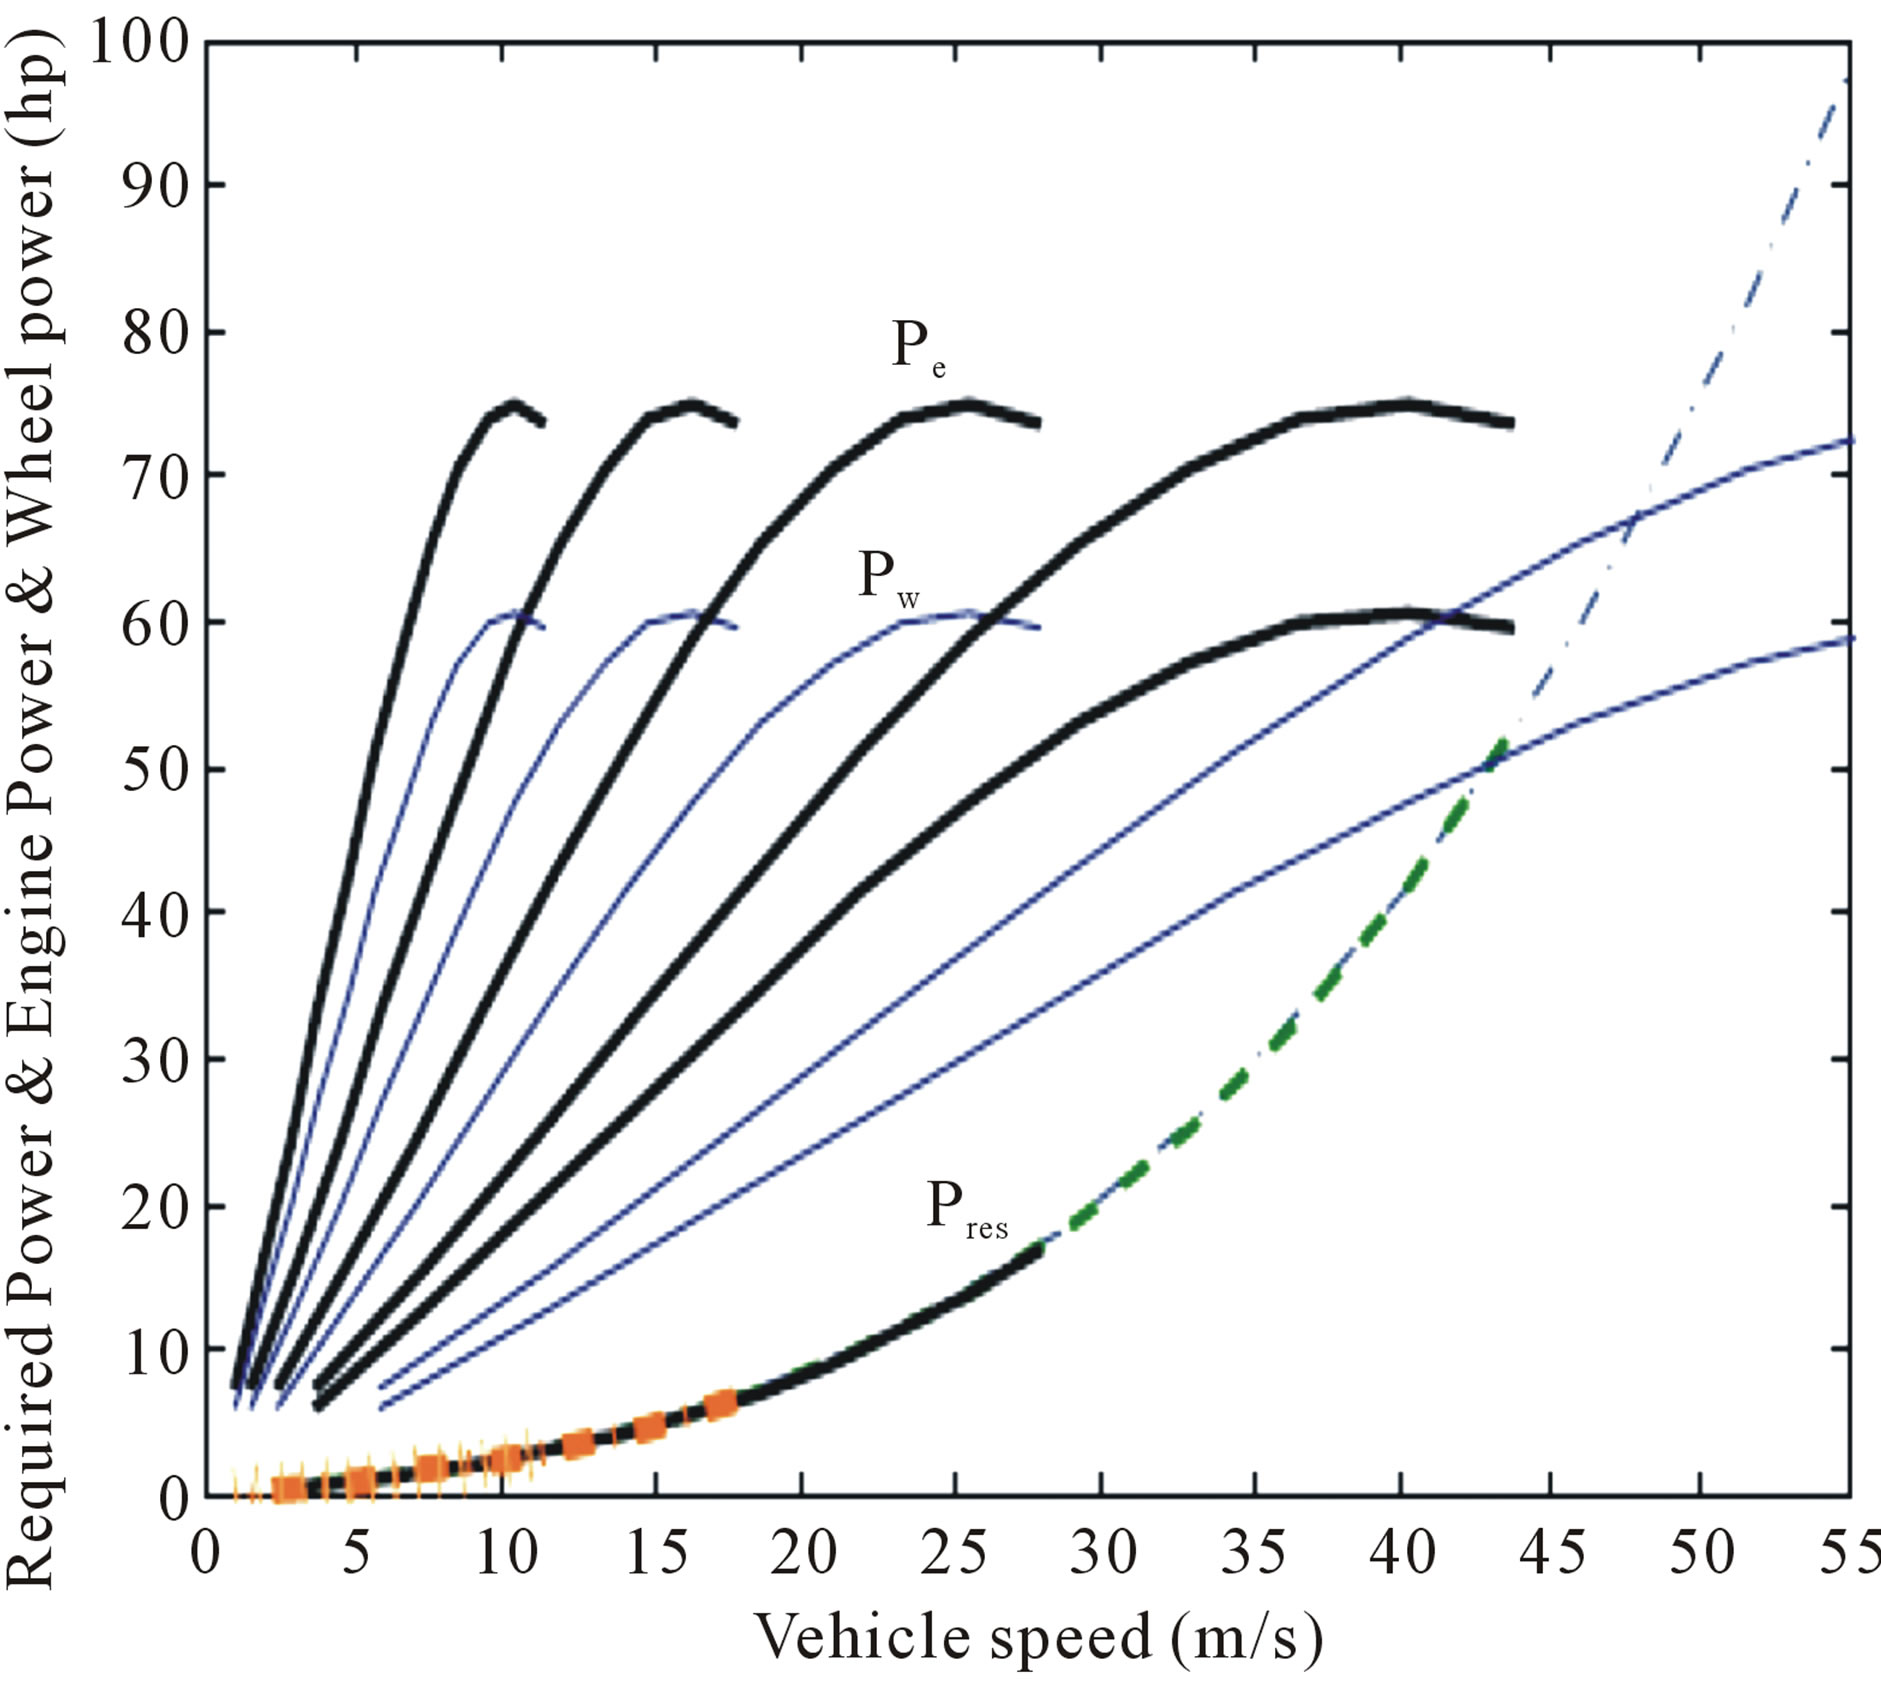
Figure 4. Required, given, and resistance power with vehicle speed.
gear ratios. The high of excess power available in lower speed range of the vehicle means that larger gap in the traction availability.
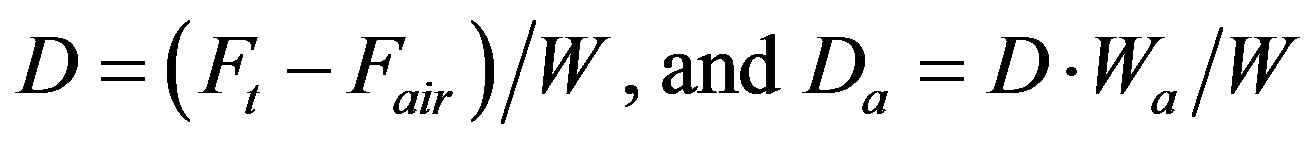
The power available and power required intersect are shown in Figure 4. The difference between the engine given power (Pe) and vehicle wheel sensing power (Pw) is dissipated in the transmission resistance. The graph shows that the required power value is changed according to the vehicle speed range. Fuel consumption is influenced greatly by gear and final ratios specified, and the gearshift point selected shown in Figure 5. With geared transmissions the operating points lie at the intersections of the ratio-dependent driving resistance lines and the line showing engine power available.
In geared transmissions, the most favourable consumption area is usually covered by top gear. When the dynamic factor at full load (D) is companied with its value at unlade vehicle weight (Da); the operation condition, (the coefficient of road rolling-adhesion, the vehicle acceleration, also road gradient) can be defined at any load of the vehicle. This allows the other graphs can be calculated at the definite condition. Figure 5 shows the dynamic factor of the given data with and without load.
4.3. The Proposed AMT
If the vehicle designer wishes for change the manual synchronizer gearbox to automatic manual transmission as shown in Figure 6, in which show that a suggest diagram of clutch and gearbox hydraulic circuit actuators and also the synchronizers motion direction by those actuators. These types of the design give additional advantages compare with conventional automatic gearbox, i.e. planetary gearbox. In the proposed AMT the clutch actuator is controlled by a solenoid intake valve (V2) and two solenoid relief valves. Figure 7 is summarized the

Figure 5. Vehicle dynamic passport in which stand for dynamic factors with different loads and engine fuel consumption at all gear ratios.
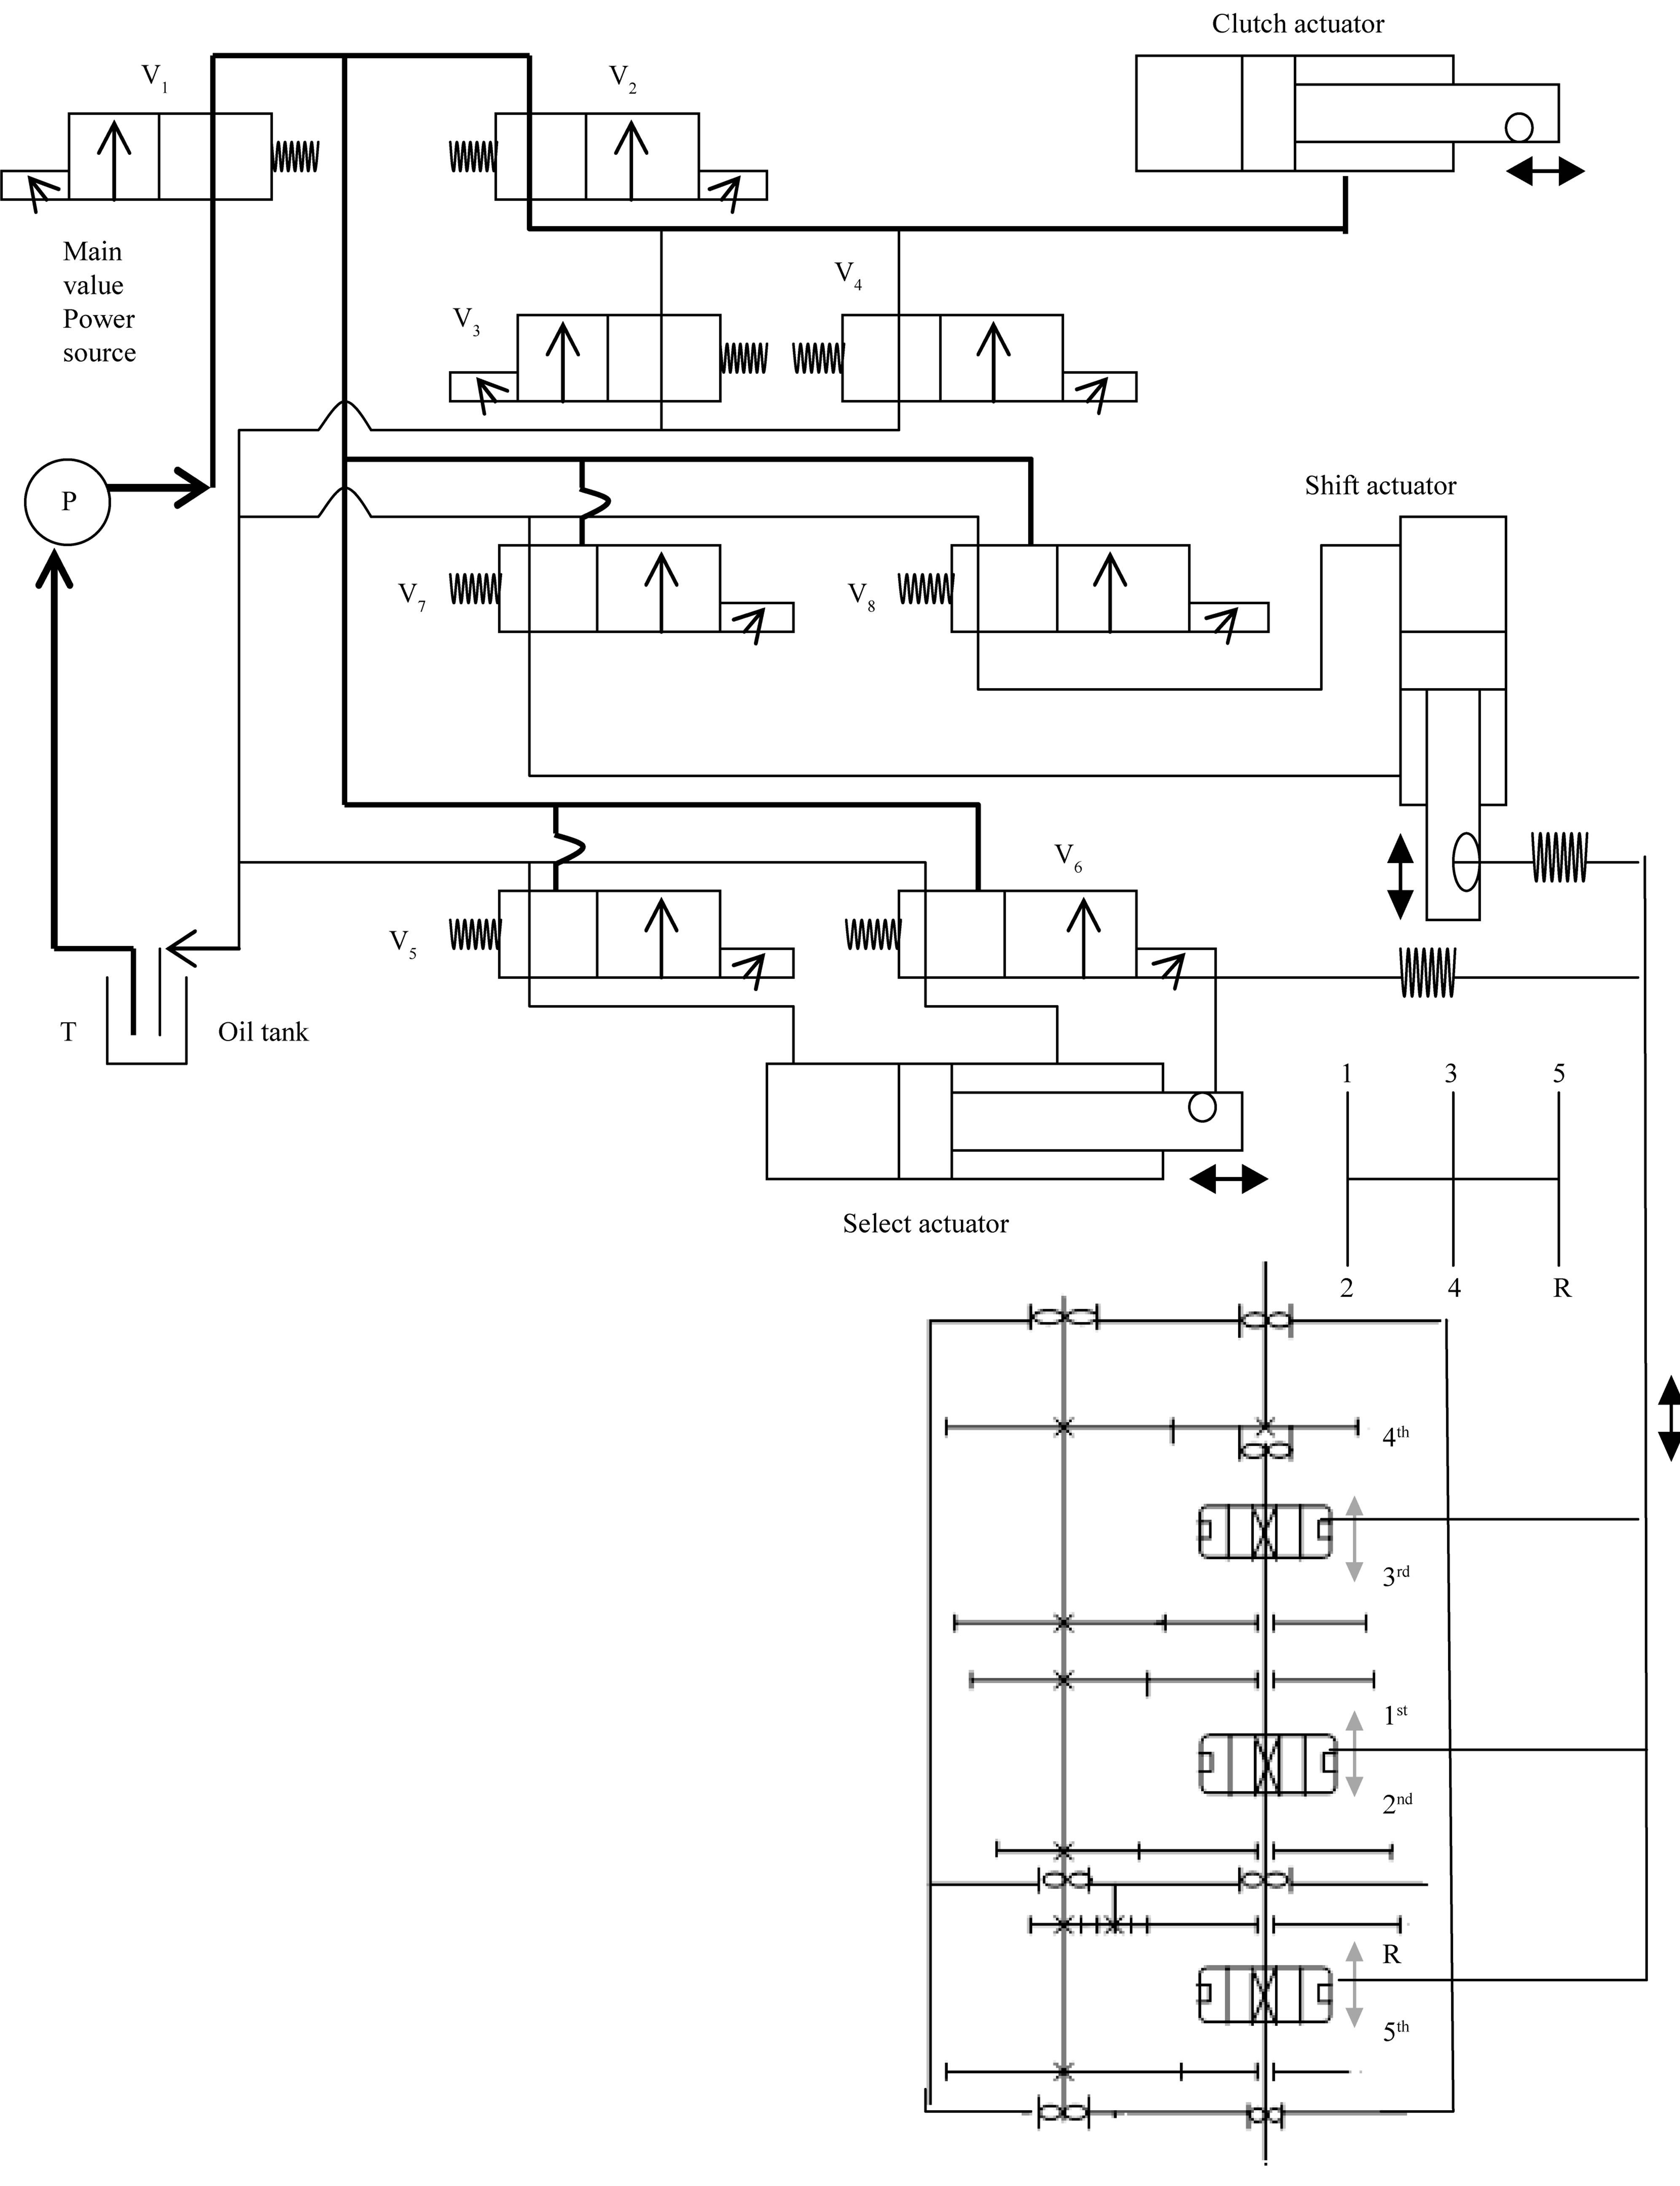
Figure 6. Clutch and gearbox hydraulic circuits, and the actuators with the direction of motion of the synchronizers by the actuators [9,10].
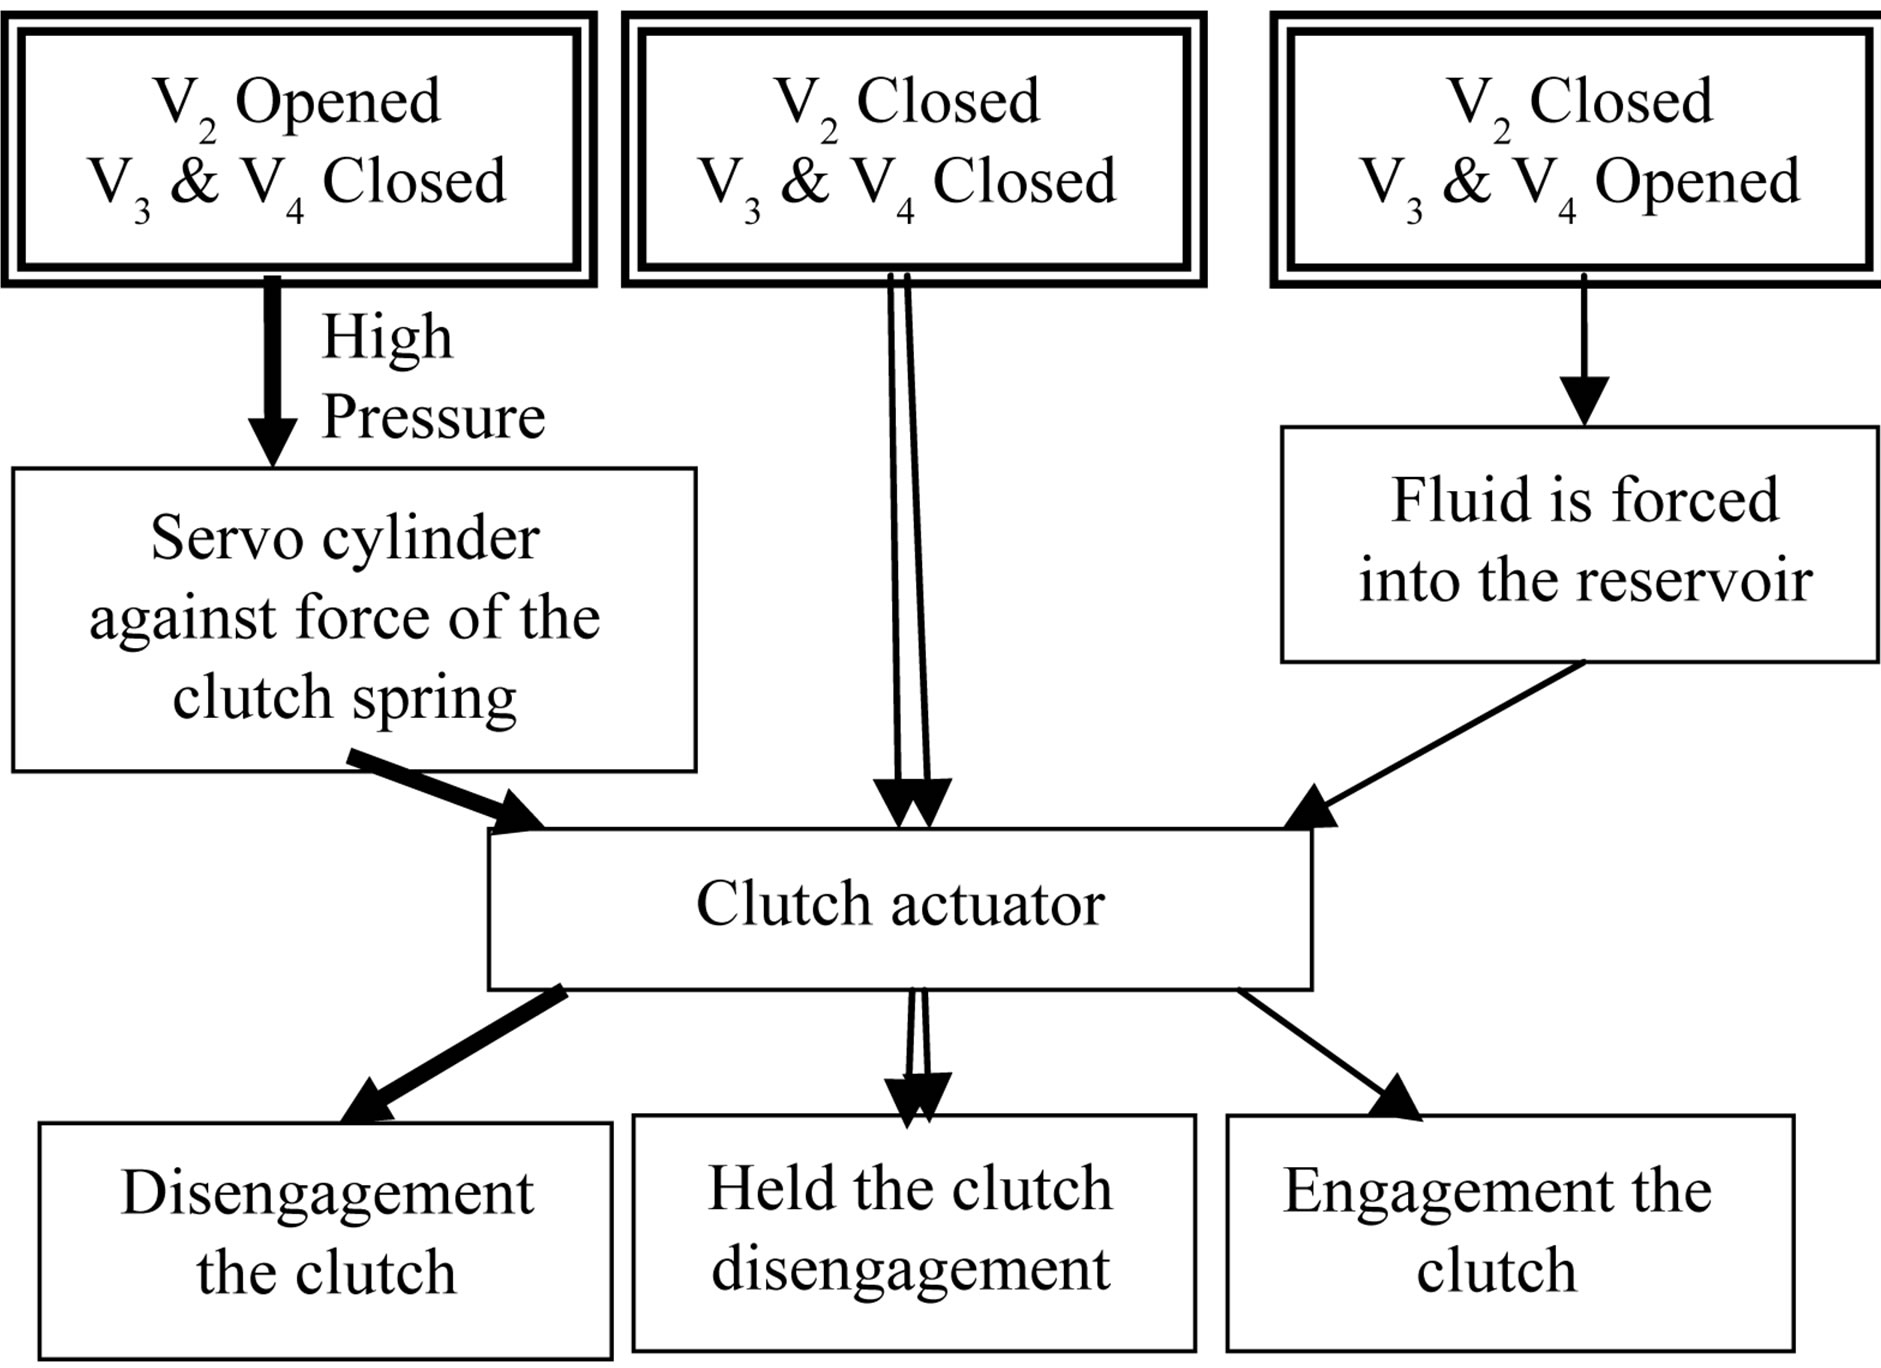
Figure 7. Clutch actuator control [9,10].
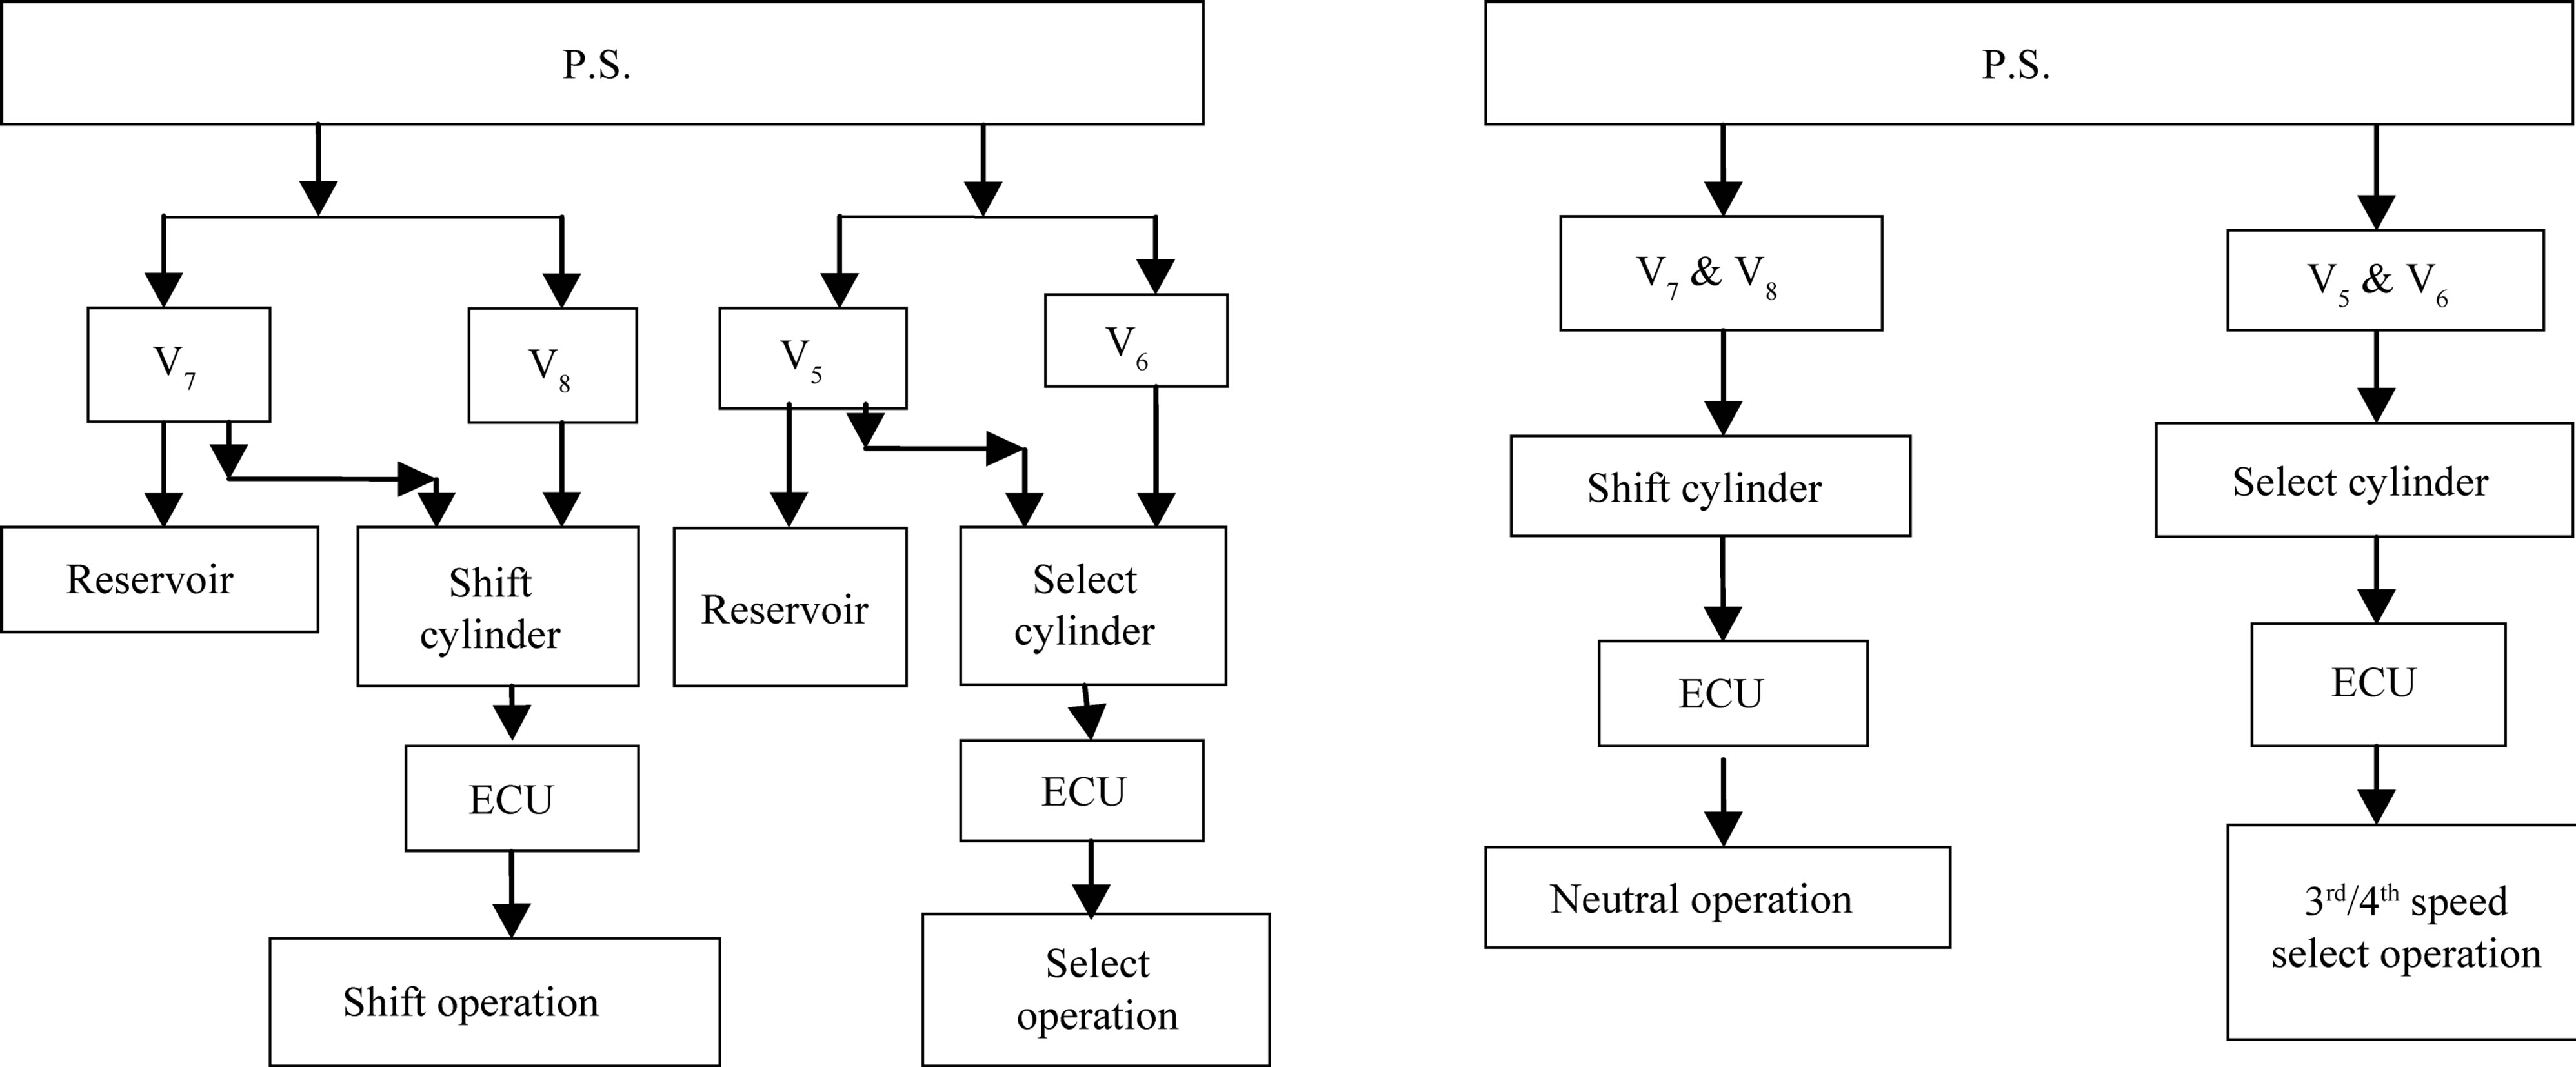
clutch actuator control by the intake and relief valves. Also, Figure 8 is summarized the select and shift actuators control by 3-port solenoid valves. The transmission actuator consists of a shift cylinder and a select cylinder which cross at a right angle. The select cylinder is controlled by the 3-port solenoid valves V5 and V6, while the shift cylinder is controlled by the valves V7 and V8.
4.4. The Proposed Intelligent Control System
Figures 9-11 show that to expand the capability to simulate the road vehicle performance. Figure 9 shows a flow chart diagram of the suggested intelligent control system to an automatic manual transmission, (AMT), development based on discover both the eye-catching of gearshift requests and dreadful conditions measures of AMT,
 (a) (b)
Figure 8. Transmission selection and shift actuators control [9,10]. (a) Shift or select operation; (b) Speed select position 1st/ 2nd or 3rd/4th.
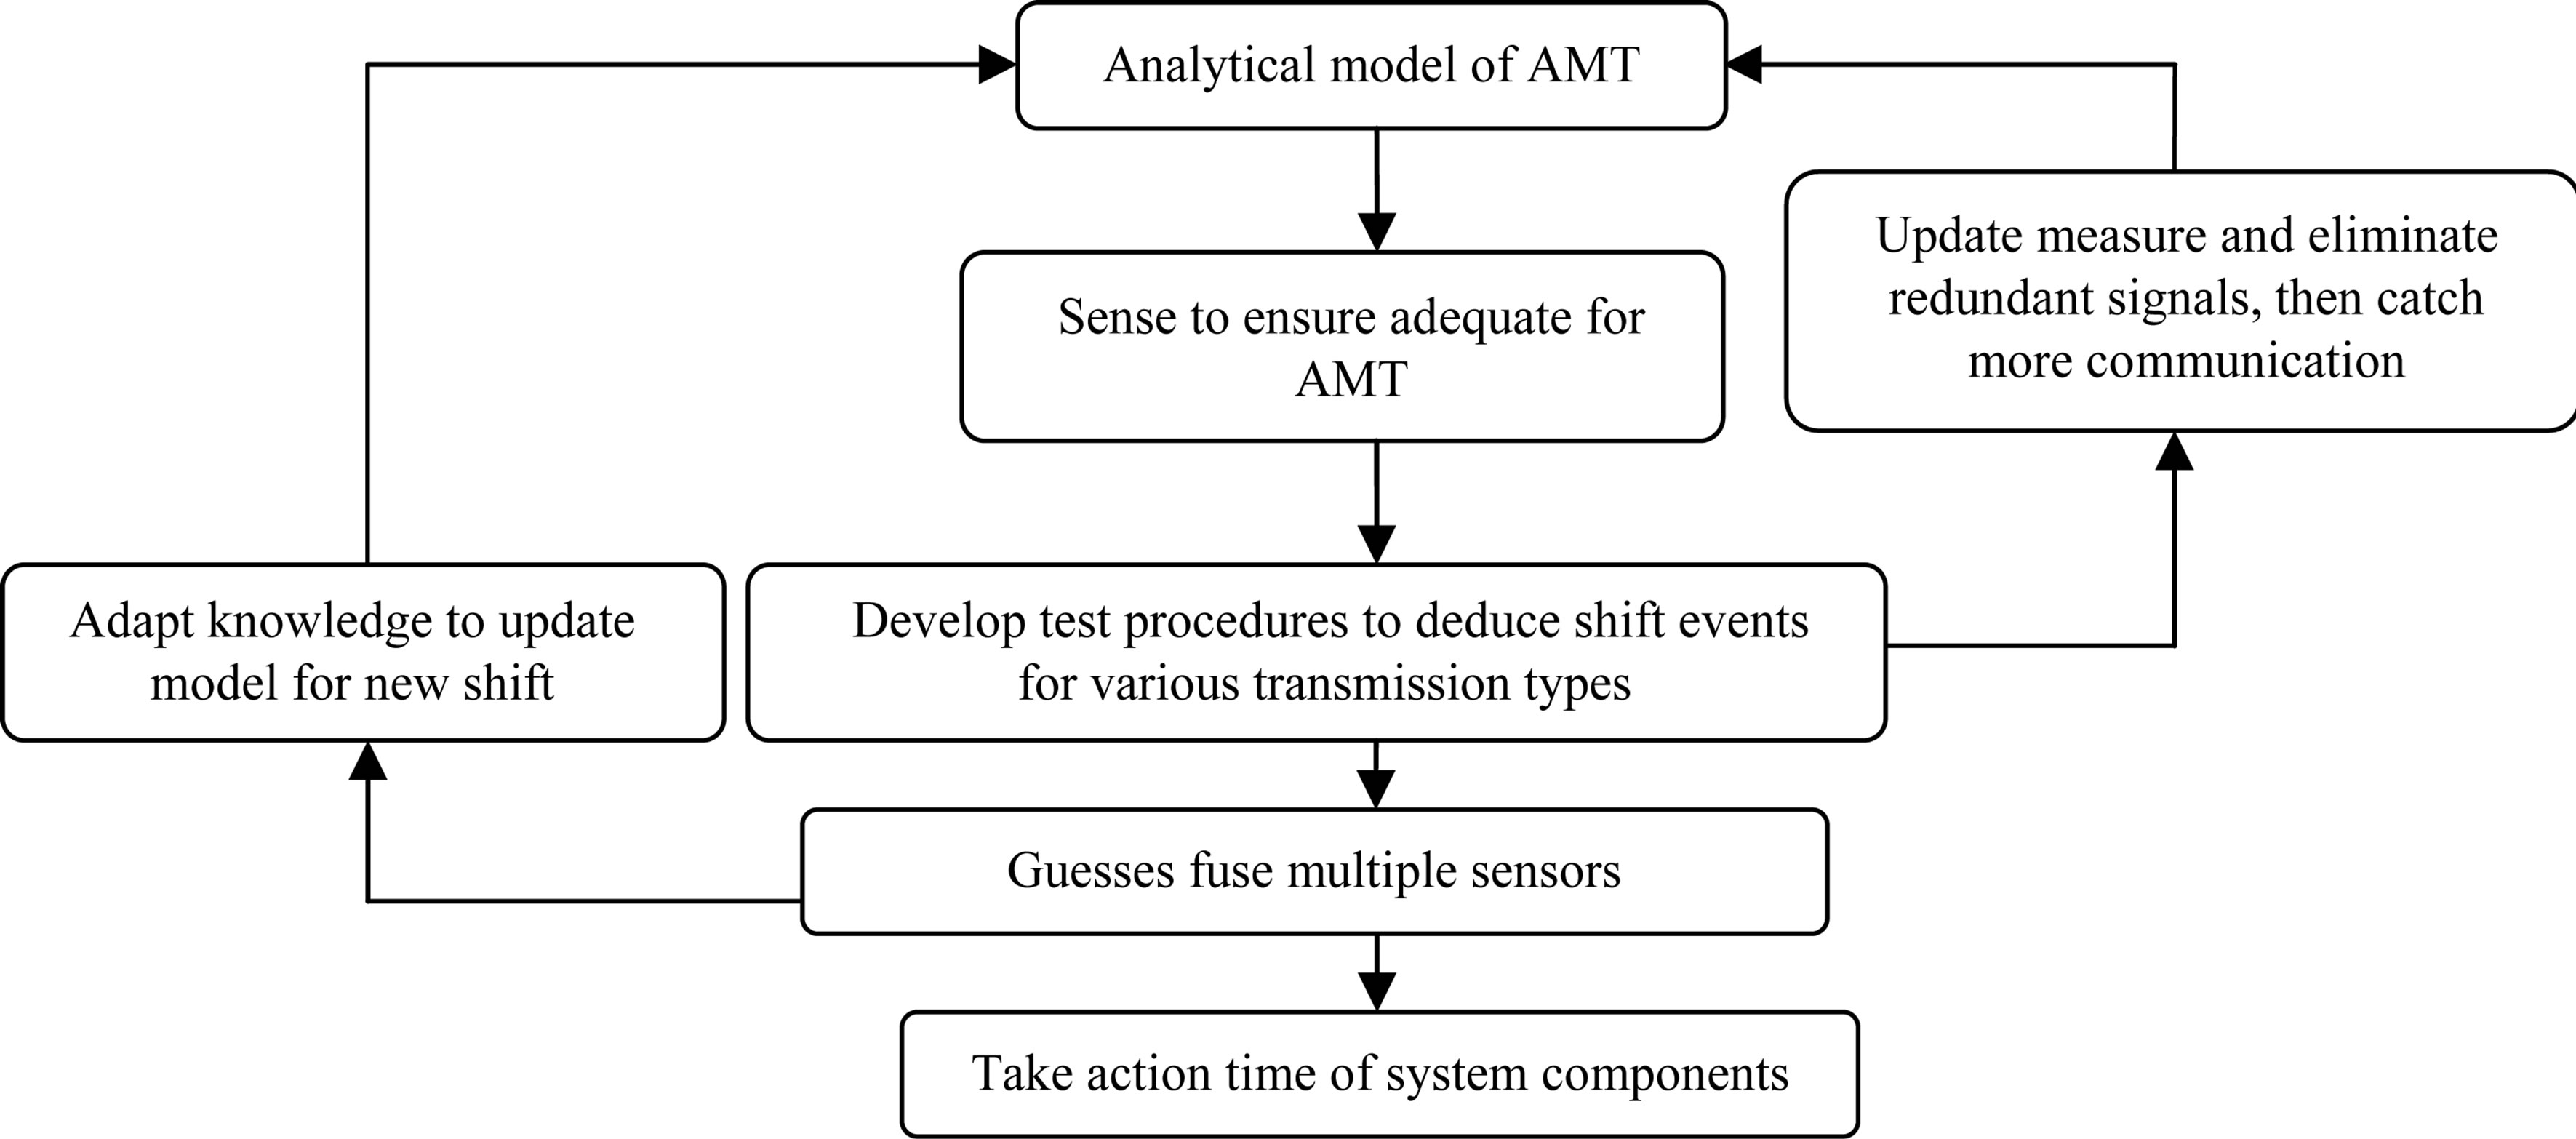
Figure 9. Suggested to an intelligent AMT development [11-18].
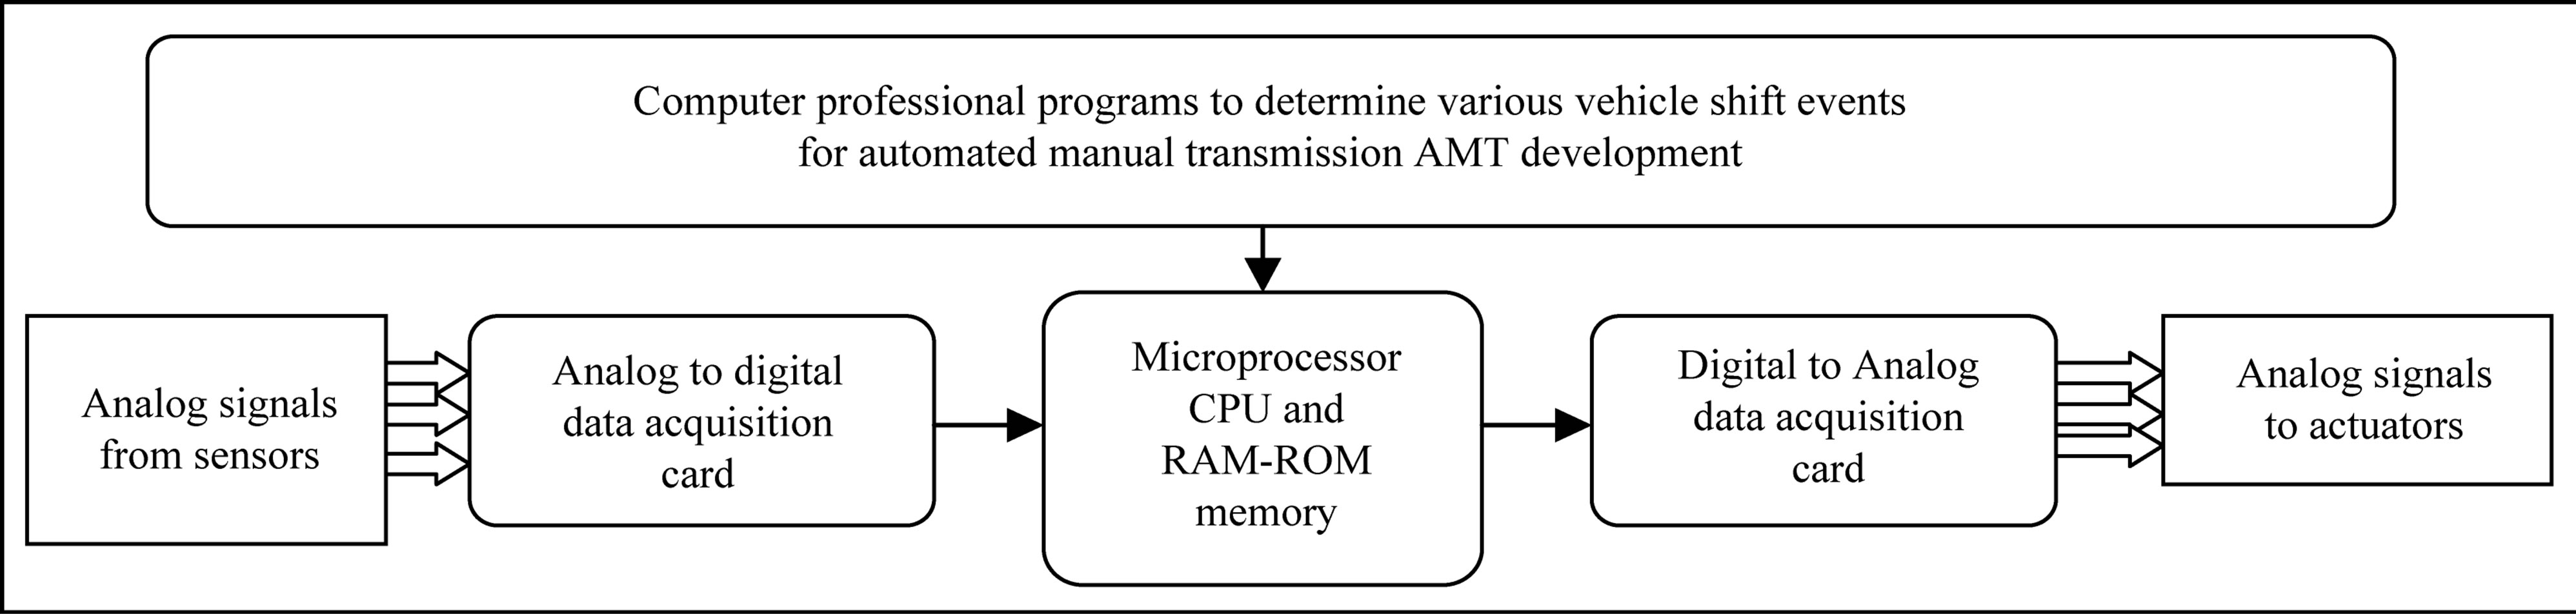
Figure 10. Proposed technologies of program related to AMT system [11-18].
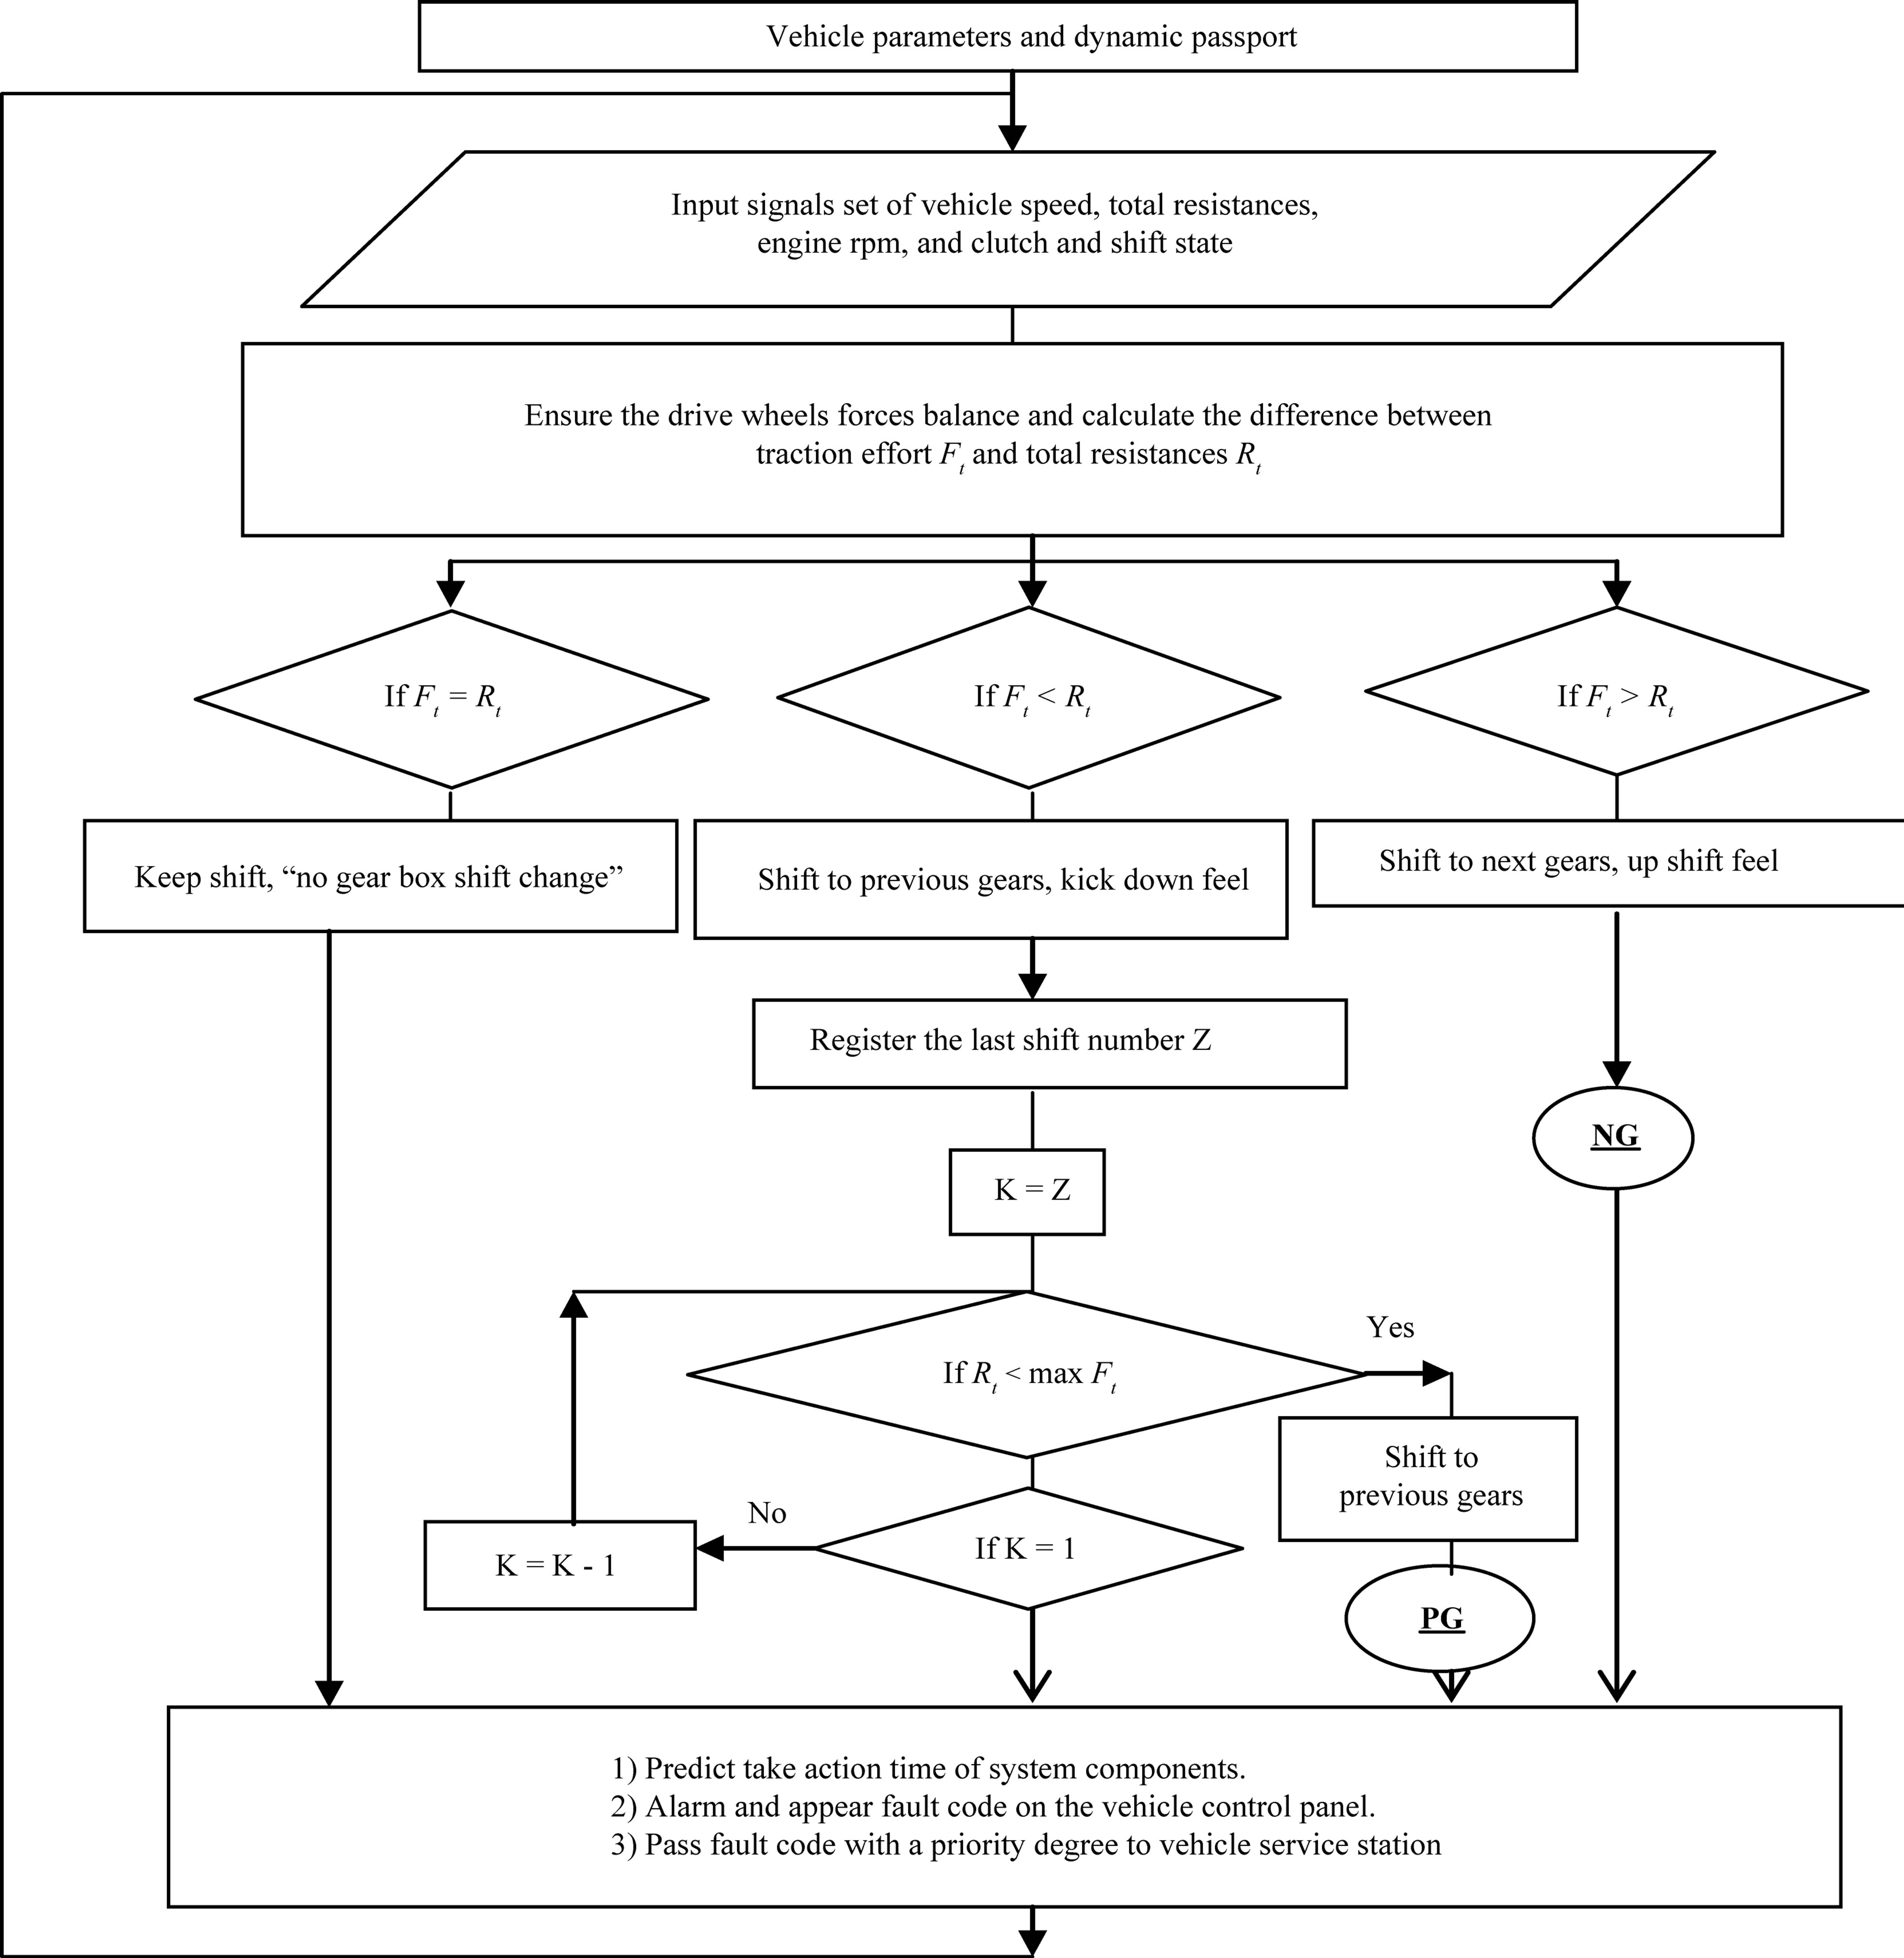
Figure 11. Professional computer program of AMT system [11-18].
those can be deduced from different measures as powertrain supply and whole oppositions.
Figure 10 shows the future technologies of program related to AMT and illustrates the conceptual flow data analysis process that starts with sensors data collection at the process control level. The data is subsequently delivered to the control condition assessment algorithm for the system.
The algorithm determines the state of these; firstly, engine performance related to throttle valve position (as: torque, power and petroleum consumption versus engine rpm) secondly, road resistances (as: rolling, air, gradient and acceleration) thirdly, potential-kinetic energy (when a vehicle go away down or reduce its speed) fourthly, gearshift position and finally what is the driver feels like to do using a combination of sensors signals, actuators and dynamic models that represent the process the elements performs. The control algorithm uses the condition assessment information to update or otherwise estimate in service times for a desirable gearshift needs before any event occurs. Figure 11 shows the flowchart diagram represents suggest a professional computer program of AMT system related to organizer algorithm of attractive gearshift requests. The program ensures the drive wheels forces balance and calculate the difference between traction effort Ft and total resistances Rt in order to keep gear shift, kick down or up shift feel. Also to alarm by near a specific failure or to get back system performances well, a control panel and actuators can be support together with tool that take their signals from suggest intelligent control system.
5. Conclusions
This paper has described theoretical investigation of a different vehicle moving operating condition which can be the basic parameters of the AMT computer designed program. A basis calculation has been done for different mathematical equation. However, the paper introduces a computer simulation program for road vehicle powertrain system based on fuel economy, performance and also for AMT system linked to director algorithm of attractive gearshift requests and foretelling by near a specific failure or to get back system performances well.
It was seen that this calculation need more for formulated the complete dynamic behavior of the vehicle on the road. This formulation can help defining the suitable minute for gear change. Other improvements can also include the complete mathematical models with inclusion of the gear box, the clutch, and the actuators operating gearbox and clutch.
REFERENCES
- M. D. Artamonov, V. A. Ilarionov and M. M. Morin, “Motor Vehicles,” Mi Publishers, Union of Soviet Socialist Rrpublics, 1976.
- J. Y. Wong, “Theory of Ground Vehicles,” John Wley & Sons, New York, 1993.
- P. M. Heldt, “Torque Converters or Transmissions,” Chilton Company, Philadelphia, 1955.
- W. C. Waters, “General Purpose Automotive Vehicle Performance and Economy Simulator,” SAE Paper No. 720043, 1972.
- K. Post, et al., “Vehicle Characterization and Fuel Consumption Prediction Using Maps and Power Demand Models,” International Journal of Vehicle Design, Vol. 6, No. 1, pp. 72-92,1985.
- S. M. Metwalley, “Hybrid Electric Minivan Performance and Emission Pollution Evaluation,” Engineering Research Journal, Zagazig University, 2007
- S. M. Metwalley, “Comparative Study of Energy Requirement for Conventional and Hybrid Electric Vehicles,” Engineering Research Journal, Zagazig University, 2007.
- A. W. Phillips, et al., “Development and Use of Vehicle Power-Train Simulation for Fuel Economy and Performance Studies,” SAE Paper No. 900619, 1990.
- A. Watanabe, et al., “Isuzu’s New Transmission Control System,” International Journal of Vehicle Design, Vol. 6, No. 3, 1985, 362-372.
- J. Horn, et al., “Flatness-Based Clutch Control for Automated Manual Transmissions,” SAE, Paper No. 2004- 01-0866, 2004.
- C. W. Hong, “A PC Based Computer Simulation Package for Spark Ignition Engine System Design,” Proceedings of the IMechE International Conference on Computers in Engine Technology, 1991, pp. 127-134.
- S. Yamashita, et al., “Development of an Analyzing System for Power-Train Performance,” JSAE, Vol. 14, No. 4, 1993, pp. 28-34.
- R. E. Buck, “A Computer Program (HEVSIM) for Heavy Duty Vehicle Fuel Economy and Performance Simulation,” Vol. 2, Users’ Manual, US Department of Transportation Document #DOT-HS-805-911, 1981.
- M. Shibuya and S. Kubota, “Optimum Control Logic for Manual Transmission,” SAE, Paper No. 850297, 1985.
- M. D. Schrock and Y. Liu, “Simulation of Control Schemes for Agricultural Tractor Engines and Transmissions,” American Society of Agricultural Engineers, Vol. 33, No. 6, 1990, 1785-1789.
- A. F. Burke and C. B. Somcah, “Computer-Aided Design of Electric and Hybrid Vehicles,” International Journal of Vehicle Design, 1982, pp. 61-81.
- H. W. He, Z. T. Liu, L. M. Zhu and X. L. Liu, “Dynamic Coordinated Shifting Control of Automated Mechanical Transmissions without a Clutch in a Plug-In Hybrid Electric Vehicle,” Energies, Vol. 5, 2012, pp. 3094-3109. doi:10.3390/en5083094
- Z. T. Liu, S. Y. Shi, H. W. He and W. Q. Li, “Study on Dynamic Shift Schedule of Automated Mechanical Transmission in a Parallel Hybrid Electric Vehicle,” 2nd International Conference on Electronic & Mechanical Engineering and Information Technology (EMEIT), Shenyang, 7-9 September 2012, pp. 1619-1622.
Nomenclature
AMT Automatic Manual Transmission or Automated Manual Transmission A Vehicle frontal area, (m2).
Cd Drag coefficient.
D Dynamic factor at full load.
Da Dynamic factor at no load.
f Coefficient of rolling resistance.
Ft Tractive force, (N).
Fair Air resistance force, (N).
ge Specific effective fuel consumption = 350, (g/kw·hr).
If The total friction inertia moment for all rotating parts, (N·m·s2).
ig Transmission reduction ratio.
Ir The total inertia moment for all wheels, (N·m·s2).
itr Total drive train reduction ratio.
J Acceleration of the wheel centre, (m/s2).
Me Engine torque, (N·m).
nm Engine revelation per minute at maximum moment or torque.
np Engine revelation per minute at maximum power.
Pair Air power resistance, (hp).
Pg Gradient power resistance, (hp).
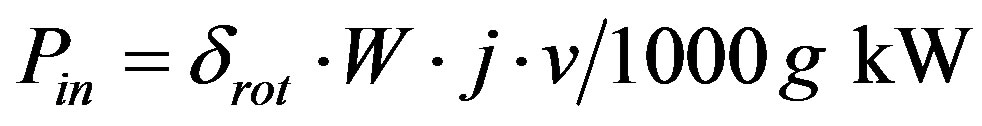
Pin Inertia power, (hp).
Prd Road power resistance, (hp).
Pres Total resistance power, (hp).
Pr Rolling power resistance, (hp).
Ptr Transmission Power, (hp).
Qrun Running fuel consumption, (l/100 km).
Rt Total resistance R Rolling radius of driving wheels, (m).
V Vehicle speed, (m/s).
W Total vehicle weight (N).
Wa Weight of vehicle at a given load, (N).
Wair Streamlining factor, (N·s2/m2).
Z Nmber of gear change or gear reduction ratios.
ωe Angular engine speed, (rad/sec).
ωP Angular engine speed at maximum power, (rad/sec).
ήtr Transmission efficiency.
αrd Steepness of road ascent.
ρair Density of air = 1.226 kg/m3 (at 15˚C and 105 Pa (1 bar) ambient conditions).
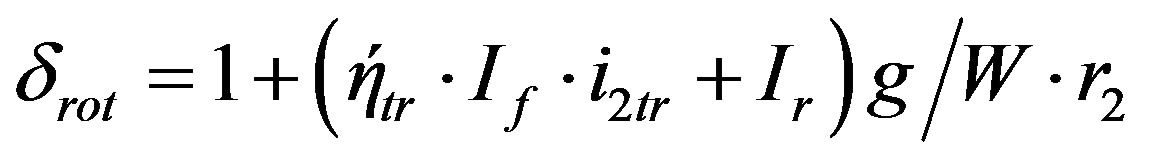
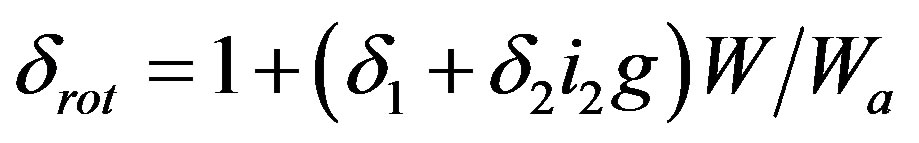
δrot The coefficient accounting for rotating masses.
ρf Fuel density, (kg/m3).
V1 Main valve.
V2 Solenoid intake valve.
V3 & V4 Solenoid relief valves.
V5, V6, V7 & V8 3-Port solenoid valves.
NG Next gear.
PG Previous gear.
K Integer number.