Open Journal of Biophysics
Vol.4 No.2(2014), Article ID:44606,17 pages DOI:10.4236/ojbiphy.2014.42008
Spectroscopic and Calorimetric Approach to Understand the Molecular Basis of Self-Association of Aureolic Acid Antibiotic, Chromomycin A3
Shreyasi Dutta, Shibojyoti Lahiri, Dipak Dasgupta*
Biophysics and Structural Genomics Division, Saha Institute of Nuclear Physics, Kolkata, India
Email: *dipak.dasgupta@saha.ac.in
Copyright © 2014 by authors and Scientific Research Publishing Inc.
This work is licensed under the Creative Commons Attribution International License (CC BY).
http://creativecommons.org/licenses/by/4.0/


Received 19 December 2013; revised 20 January 2014; accepted 27 January 2014
Abstract
Chromomycin A3 (CHR, pKa = 7.0), an aureolic acid group of antitumor antibiotic, undergoes selfassociation in aqueous solution in neutral and anionic forms. Self-association processes of neutral and anionic CHR have been studied in pH 5.0 and pH 9.0, respectively using different spectroscopic methods such as absorbance, fluorescence, CD, NMR and isothermal titration calorimetry (ITC). Results from these studies reveal that at low concentration (<10 µM), CHR exists predominantly in dimeric state for both neutral and anionic forms. With the increase of concentration, dimers further aggregate to form trimer and teramer in the following steps: (CHR)2 + CHR ( (CHR)3 and (CHR)3 + CHR ( (CHR)4. Analysis of NMR spectra of 100 µM and 1 mM CHR indicates that the selfassociation of CHR (neutral and anionic form) is most likely to happen via hydrophobic interaction involving the sugar moieties and surrounding water molecules. Calorimetric studies indicate that self-association of both anionic and neutral CHR is entropy driven. These observations imply that sugar substituents play a major role in their state of aggregation after biosynthesis from a gene cluster. The self-association features of the antibiotic have been compared with those of Mithramycin, an antibiotic of the same group.
Keywords
Oligomer; Neutral; Anionic; Circular Dichroism; Enthalpy; NMR Spectroscopy

1. Introduction
Chromomycin A3 (CHR) is an antitumor antibiotic [1] produced by Streptomyces griseus [2] . It belongs to the aureolic acid family of antibiotics. It was earlier used for the treatment of Paget’s disease of bones and testicular carcinoma under the trade name of toyomycin [3] . Currently the clinical use of CHR is discontinued due to its cytotoxicity [2] . However, it is widely used in karyotyping and painting of the cell nucleus [4] . The antitumor properties of CHR are ascribed to its inhibitory effects on replication and transcription processes during macromolecular biosynthesis [5] . In the presence of bivalent metal ion, like Mg2+, it can bind to minor groove of DNA at GC-rich nucleotide sequence [6] and thereby downregulates the expression of many cancer-related genes that bear GC-rich motifs in their promoter regions, such as the c-myc proto-oncogene [7] . Apart from these antitumor activities, CHR also acts as a potent inhibitor of neuronal apoptosis induced by oxidative stress and can induce erythroid differentiation of K562 cells by binding to the human γ-globin promoter [8] . CHR has also been shown in our laboratory to inhibit the enzyme activity of Zn(II)-containing metalloenzymes [9] .
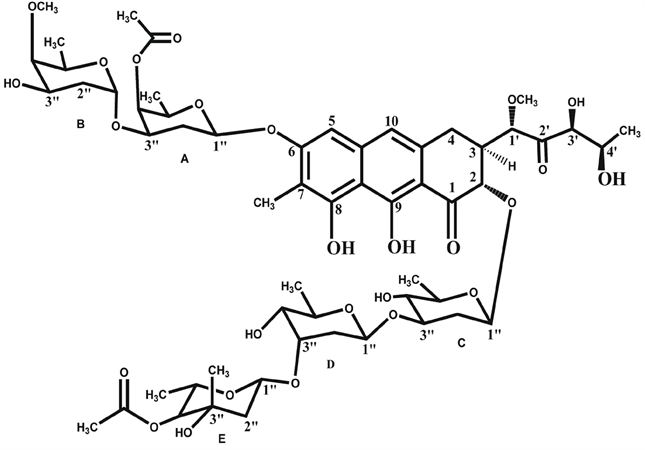
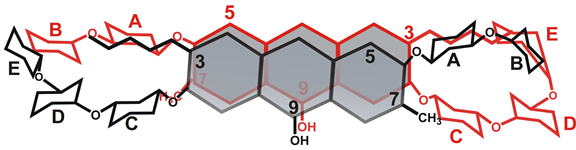
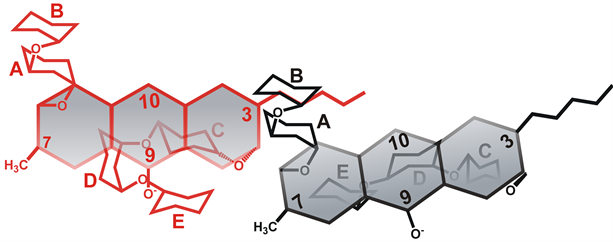
CHR (structure shown in Figure 1(a)) contains a tricyclic aglycone with a β-ketophenol chromophore, which is attached to two aliphatic side chains at C3 and C7 position and different oligosaccharide moieties via O-glycosidic linkages. The disaccharide is attached to C6 position of the anthracine ring whereas the trisaccharide is attached to the C2 position. The trisaccharide unit of CHR consists of D-olivose (sugar C and sugar D) and 4-O-acetyl-L-chromose B (sugar E). The disaccharide unit consists of 4-Oacetyl-D-oliose (sugar A) and 4-O-methyl-D-oliose (sugar B) linked via glycosidic linkages [2] [10] .
Micro-organisms protect themselves from the toxic action of antibiotics; they are produced by developing self-defense mechanisms and they are highly resistant to that specific antibiotic. Therefore, the self-association of these antibiotics would play an important role in its storage outside the bacterial cell wall, biological action and gene expression from Streptomyces griseus. CHR is structurally similar to Mithramycin (MTR) [11] (structure shown in Figure 1(b)), as they have the same aglycone and aliphatic side chain but differ in four out of five sugars attached to the aglycone [12] . Previous reports from our laboratory have shown that anionic form of MTR self-associates extensively [13] . CHR has a pKa of 7.0 [14] . At physiological pH, it therefore, has a mixed population of anionic and neutral forms. Here we have examined the self-association of CHR in aqueous solution both in neutral and anionic forms by means of spectroscopic (absorbance, fluorescence and CD) and calorimetric (ITC) techniques to characterize the self-association property of CHR and provide a molecular basis of the aggregation. Structural analysis of the process of aggregation has been studied by nuclear magnetic resonance (NMR) spectroscopy, which has helped to elucidate the mode of self-association of the CHR molecules in different ionization states.
2. Materials and Methods
2.1. Materials
CHR, Hydrochloric acid (HCl), Tris, Sodium acetate (CH3COONa), Acetic acid (CH3COOH), Disodium hydrogen phosphate (Na2HPO4) and Sodium dihydrogen phosphate (NaH2PO4) were obtained from Sigma Chemical Co., USA. All solutions were prepared in Milli-Q (Synergy, Millipore, and USA) water after filtration through a 0.1 µm filter.
2.2. Buffers
Unless mentioned separately, all spectroscopic and ITC experiments were performed in 20 mM Tris-HCl (pH 9.0) and 20 mM Sodium acetate-acetic acid buffer (pH 5.0). For the NMR experiments, 20 mM phosphate buffer (NaH2PO4-Na2HPO4) at pH 8.0 and 20 mM phosphate buffer (NaH2PO4-Na2HPO4) at pH 6.0 was used.
2.3. Preparation of CHR
CHR was dissolved in Milli-Q water and the concentration was checked from absorbance measurements at 405 nm in 20 mM Tris-HCl (pH 8.0) using the extinction coefficient (ε405) 8800 M−1·cm−1 within the linear range of concentration, 10 - 20 µM.
2.4. Absorption Spectroscopy
All absorbance spectra were recorded in a Cecil 7500 UV-visible spectrophotometer (DataStream CE 7000
 (a)
(a)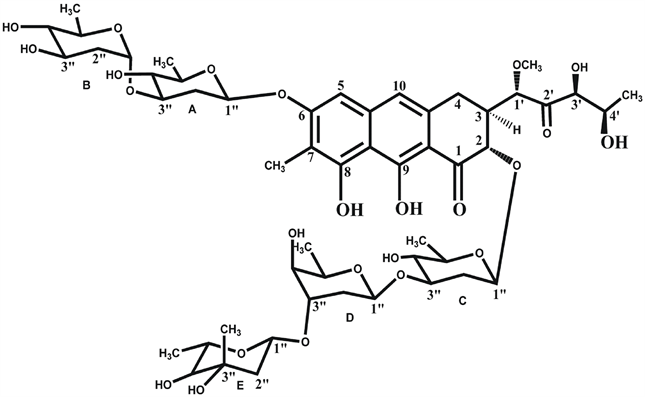 (b)
(b)
Figure 1. Chemical Structures of antibiotics. (a) Structure of Chromomycin A3; (b) Structure of Mithramycin.
Series software) at 25˚C. Absorbance spectra of neutral form of CHR and anionic CHR were taken in 20 mM Sodium acetate-acetic acid buffer (pH 5.0) and 20 mM Tris-HCl (pH 9.0), respectively at 25˚C in quartz cuvettes of 1 cm path length. For comparison, the spectra shown in the results contain normalized absorbance (A/Amax) as a function of wavelength, where A is the absorbance and Amax is the absorbance at the peak.
2.5. Fluorescence Spectroscopy
Fluorescence spectra of CHR at different concentrations and in different pH were recorded in a Perkin-Elmer LS55 luminescence spectrometer with a thermostatted cuvette holder at 25˚C. The excitation wavelength is 470 nm and fluorescence emission intensity has been monitored over the range, 500 nm to 700 nm. Intensity at 540 nm was noted as a function of input concentration to study the self-association. The excitation wavelength of 470 nm was chosen to avoid photochemical degradation of CHR during the fluorescence measurements as mentioned in a previous report from the laboratory [6] . Fluorescence measurements were done in cuvettes of different path length with absorbance upper limit of 0.02 to detect self-association.
2.6. Circular Dichroism Spectroscopy
We have employed CD spectroscopy to monitor the self-association of CHR as a function of its concentration. Circular dichroism spectra were recorded in a Bio-Logic-Science Instruments, France using cuvettes of 1 cm path length for lower concentration and 0.2 cm path length for higher concentration range. Data were analyzed using the inbuilt Bio-Kine 32 V4.49-1 software. The change of ellipticity as a function of concentration has been plotted at different wavelengths, where the changes in CD were most pronounced for the two systems.
2.7. Isothermal Titration Calorimetry
The heat of dilution CHR was measured in a VP-ITC microcalorimeter (MicroCal Inc., USA) using the built-in VP Viewer 2000 software with Origin 7.0. CHR was taken in the syringe (299 µM) and injected into the cell containing 20 mM Tris-HCl (pH 9.0) and 20 mM Sodium acetate-acetic acid buffer (pH 5.0). All experiments were performed at 25˚C with the syringe at a stirring speed of 307 rpm. All solutions were filtered and degassed extensively before each experiment. Corrected enthalpies were calculated after subtracting the enthalpy change due to mixing of the buffers in each case.
2.8. 1H NMR Spectroscopy
1D 1H NMR spectra for 100 µM CHR and 1 mM CHR and 2D 1H NMR (Total Correlation Spectroscopy (TOCSY) and Nuclear Overhauser Effect Spectroscopy (NOESY)) spectra for 1 mM CHR were recorded in a Bruker Spectrospin 500 MHz NMR machine at 25˚C. 10% D2O was used for external locking. The 2D spectra were recorded for ~16 h. A mixing time of 400 ms was used in each case. Samples were prepared in 20 mM phosphate buffer (pH 8.0) and 20 mM phosphate buffer (pH 6.0). Data were analyzed using Bruker TopSpin 3.1 software.
3. Results
3.1. Absorbance Studies for CHR in Neutral and Anionic Form
Figure 2(a) and Figure 2(b) show the absorption spectra of CHR at two different concentrations in pH 5.0 and pH 9.0 buffers respectively. The non overlap of the spectra in both buffers over the concentration range, 2 µM - 60 µM, indicates the aggregation of CHR both in neutral and anionic forms. At pH 5.0 there is a broadening of the spectra of the neutral form at low concentration which become sharper with the increase in concentration. In contrast, the absorption spectra of the anionic CHR at pH 9.0 broadened with the increase in concentration. Such difference could arise from the difference in the geometry of aggregation of the two forms leading to a difference in the relative orientation of the chromophores. We have not noticed any such deviation from linearity for the (CHR)2: Mg2+ complex at pH 9.0 in presence of 10 mM Mg2+ in this concentration range.
 (a) (b)
Figure 2. Absorption studies. (a) Absorption spectra of neutral CHR, 7.7 µM (black) and 59 µM (red) in 20 mM sodium acetate acetic acid buffer pH 5.0; (b) Absorption spectra of anionic CHR, 7 µM (black ) and 59 µM (red), in 20 mM Tris-HCl buffer pH 9.0 at 25˚C.
3.2. Fluorescence Measurements of CHR in Neutral and Anionic Form
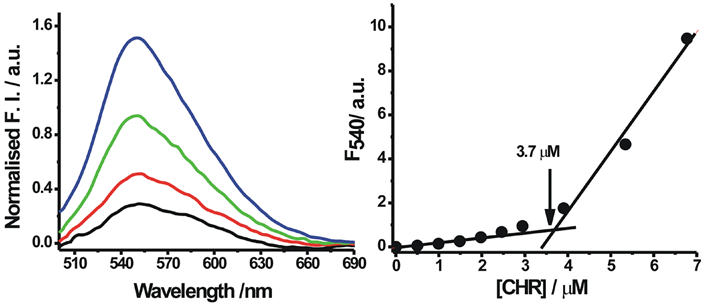
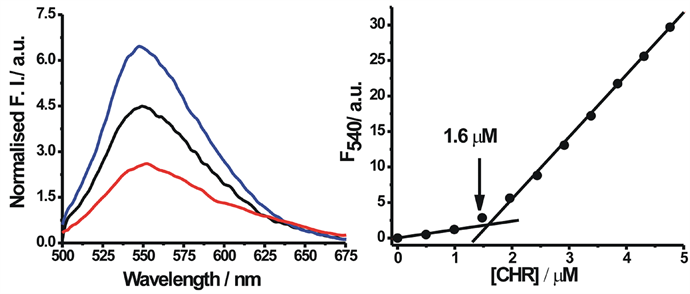
To detect the self-aggregation of neutral and anionic CHR in aqueous buffers of pH 5.0 and pH 9.0 at low concentration range of 1 µM - 7 µM, the fluorescence emission spectra and intensity at peak, 540 nm, were measured as a function of CHR concentration. At this concentration range of CHR there is an increase in the normalized fluorescence spectra in both buffers (pH 5.0 and pH 9.0) (Figure 3(a) and Figure 4(a)). Figure 3(b) and Figure 4(b) show the deviation from linearity of the fluorescence intensity values at 540 nm as a function of CHR concentration. These observations indicate aggregation of the antibiotic in aqueous solution. The difference in the break-points of fluorescence-concentration plots (indicated by arrows in the figures) at two different pH values is also noteworthy. Comparison of the data shown in the Figure 3(b) and Figure 4(b), suggest that aggregation of CHR starts at a lower concentration in case of the anionic antibiotic.
3.3. CD Measurements to Determine the Mechanism of Self-Association Process
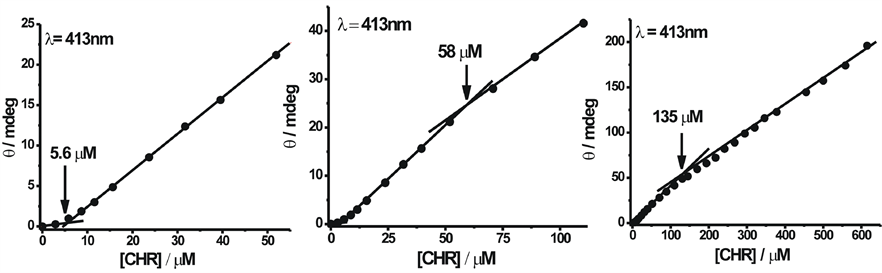
To study the self-association of neutral and anionic CHR, we investigated changes in the chiro-optical properties of CHR in the above buffers of pH 5.0 and 9.0 as a function of input concentration. Figure 5(a) and Figure 5(b) show the CD spectra of CHR in the visible range with the increase in concentration of CHR in 20 mM sodium acetate-acetic acid buffer (pH 5.0) and 20 mM Tris-HCl (pH 9.0) buffer, respectively. The change in spectral shape is observed with the increase in concentration in both cases (Figure 5). At lower concentration broad spectra replace the split into two peaks observed at higher concentrations.
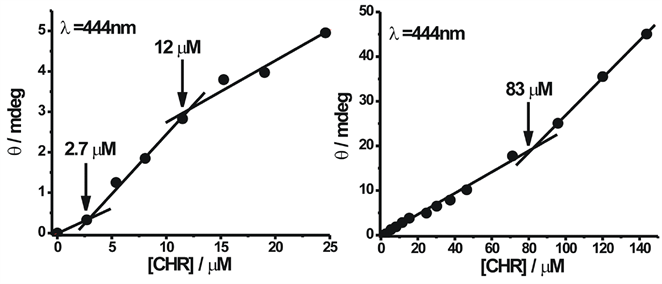
We have plotted the observed ellipticity at 413 nm for the neutral drug and 444 nm for anionic drug as a function of input concentration of CHR (Figure 6 and Figure 7). The resulting plot shows three breaks over the entire concentration range in each case. The choice of wavelength does not alter the nature of the curves with the break points. In case of CD spectroscopic study also, the breakpoints as shown in the Figure 6 and Figure 7 occur at lower concentrations for the anionic antibiotic, thereby suggesting an internal consistency of the results obtained by two different techniques, fluorescence and CD. The results suggest that there are four types of species present over the total concentration range. In analogy to the earlier proposition of a tetrameric model of self-association of MTR, the following multiple equilibria have been proposed to account for the breaks M + M ⇌ M2 association constant = K1
M2 + M ⇌ M3 association constant = K2
M3 + M ⇌ M4 association constant = K3
4M ⇌ M4 association constant = K with three association constants, denoted as K1, K2, and K3 (where K = K1 × K2 × K3). M, M2, M3, and M4 represent the monomer, dimer, trimer, and tetramer of CHR, respectively. The monomer concentration of CHR ([M]) can be expressed in terms of total CHR concentration C0 and association constant K as under
 (a) (b)
Figure 3. Fluorescence studies of neutral form. (a) Fluorescence spectra (normalized per micromolar concentration of CHR) of neutral CHR, 2.5 µM (black), 3.9 µM (red), 5.4 µM (green) and 10 µM (blue) in 20 mM sodium acetate acetic acid buffer pH 5.0 at 25˚C; (b) Fluorescence intensity at 540 nm is plotted against different concentration in 20 mM sodium acetate acetic acid buffer pH 5.0 at 25˚C.
 (a) (b)
Figure 4. Fluorescence studies of anionic form. (a) Fluorescence spectra (normalized per micromolar concentration of CHR) of anionic CHR, 1 µM (red), 2 µM (black), 3.5 µM (blue) in 20 mM Tris-HCl buffer pH 9.0; (b) Fluorescence intensity at 540 nm plotted against different concentration in 20 mM Tris-HCl buffer pH 9.0 at 25˚C.
 (a) (b)
Figure 5. Circular dichroism spectra. (a) CD spectra of CHR, 37 µM (black), 102 µM (red), 241 µM (green) and 378 µM (blue) in 20 mM sodium acetate acetic acid buffer pH 5.0; (b) CD spectra of CHR, 46 µM (black), 120 µM (red), 217 µM (green) and 305 µM (blue) in 20 mM Tris-HCl buffer pH 9.0 at 25˚C.
 (1)
(1)
The molar ellipticity of the monomer and dimer can be connected by the following equation
 (2)
(2)
for the dimerization step. In Equation (2), Δε = apparent molar CD absorption co-efficient, which is defined as the measured CD, divided by total CHR concentration. ΔεM and ΔεD are apparent molar CD absorption co-efficient for the monomer and dimer respectively [15] . Values of Δε, ΔεM and ΔεD were calculated from measured CD values at different concentrations. Apparent molar CD absorption coefficients for the trimerisation and tetramerisation steps were calculated considering higher concentrations in the CD experiments.
Combining Equations (1) and (2) dissociation constants (Kd = 1/association constant) of different aggregation steps have been calculated. For the sake of clarity of comparing the extent of association to form the oligomers, Kd values representing the different orders of aggregation for neutral and anionic CHR are reported in Table 1. The following features characterize the aggregation process. In accordance with the trend mentioned above, the dissociation constant for dimerisation process (![]() ) of anionic CHR is three fold lower than that of neutral CHR. It means the ionization leads to oligomerization of CHR at lower concentration. With increase in concentration,
) of anionic CHR is three fold lower than that of neutral CHR. It means the ionization leads to oligomerization of CHR at lower concentration. With increase in concentration,
 (a) (b) (c)
Figure 6. Change in ellipticity of neutral form: plot of observed ellipticity of CHR at 413 nm as a function of its concentration in 20 mM sodium acetate acetic acid buffer pH 5.0 at 25˚C.
 (a) (b)
Figure 7. Change in ellipticity of anionic form: plot of observed ellipticity of CHR at 444 nm wavelength as a function of its concentration in 20 mM Tris-HCl buffer pH 9.0 at 25˚C.

Table 1. Apparent dissociation constants values for the multiple equilibria of CHR and MTR in both neutral and anionic forms at 25˚C.
[a]values are taken from Lahiri et al. 2008. J. Phys. Chem. B, 112, 3251-3258.
the dimer further associates to form trimer and tetramer for both, neutral as well as anionic CHR. Formation of tetramer from trimer is associated with a relatively lower affinity. In terms of free energy, the formation of dimer is most favorable followed by the trimer to tetramer formation. Table 1 also contains similar data for MTR for comparison. The data in the Table 1 shows that the lower order oligomerization, namely dimerization, is more favorable in case of CHR compared to that in MTR. The difference among the two antibiotics could be ascribed to difference in the sugar residues with its substituents.
3.4. Measurement of Heat of Dilution by Isothermal Titration Calorimetry (ITC) Method
The differences in the dissociation constant for the dimerization process of the two antibiotics originate from the associated free energy difference characterizing the dimerization. From the energetic perspective, enthalpy-entropy compensation would give rise to the difference in the observed free energy. Therefore, ITC has been used as a tool to investigate the thermodynamics of the dimerization of CHR in buffers at pH values to get neutral and anionic antibiotic. In this method molar heat of dilution has been measured at different concentrations corresponding to dimer and trimer formation. Earlier report from our laboratory shows that, molar heat of dilution is constant within the limits of experimental errors for species which does not aggregate at different concentrations [13] . But for the species which self aggregates, molar heat of dilution varies with concentration. Figure 8 shows the isotherms obtained from the calorimetric titration of neutral and anionic CHR at 25˚C. From the isotherms we can see that neutral CHR aggregates at ~10 µM concentration whereas the anionic CHR aggregates at much lower concentrations. The enthalpy change is also opposite in direction for neutral and anionic CHR. It is exothermic in the former case, whereas endothermic in the later. The enthalpy change of self-association of both neutral and anionic CHR is smaller in magnitude than the counterparts in MTR as shown here and in an earlier report [13] . The neutral forms of the two antibiotics show opposite trends in the enthalpy change (Figure 8).
3.5. NMR Spectroscopic Measurements: Anionic CHR
While fluorescence, CD and calorimetry throw light on molecular process of self-association, in-depth site specific structural information of the aggregation process can be obtained from NMR spectroscopy. Here we have addressed the following questions. Is the aromatic planar moiety involved in the aggregation via stacking interaction? What is the role of the aglycone moieties? Finally, is there any evidence that the sugars play role in the process, as indirectly suggested from the other methods? To answer these questions we have identified some protons (listed in Table 2) as the markers to procure information about the above structural moieties. From the NMR spectroscopic studies we have also endeavored to propose a geometric orientation of the monomeric units in the dimer and higher order aggregation. The concentration range used in the NMR studies provides an overall process of aggregation instead of specific information at dimer or tetramer levels. Since the NMR spectra of anionic CHR have been reported earlier [16] -[19] in the literature we have discussed this case followed by neutral CHR.
Chemical shift values of anionic CHR (at pH 8.0) have been assigned using 1D and 2D (through bond connectivity-TOCSY and through space connectivity-NOESY) NMR spectra (Table 2). They were then further compared with the reported values for chemical shifts of different protons in the molecule [16] -[19] . In order to understand the mode of self-association, different parts of the CHR molecule was examined for their possible orientation in the aggregated state.
Chemical shift values of C5-H and C10-H do not show any NOESY contacts apart from those arising from the protons of the same molecule (Figure 1, Table 3). Involvement of the aromatic region and therefore, role of stacking interactions in the process of aggregation of anionic CHR appears a remote possibility, because there is
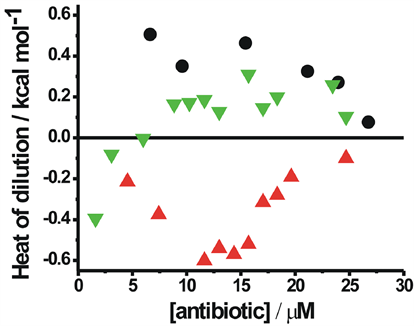
Figure 8. Calorimetric studies: calorimetric titration of anionic CHR in 20 mM Tris-HCl, pH 9.0 (▼), neutral CHR in 20 mM sodium acetate acetic acid buffer pH 5.0 (▲) and neutral MTR in 20 mM Citric acid citrate buffer at pH 3.0 (●) at 25˚C. The final concentration in the cell ranges from 1 µM to 30 µM.
Table 2. Chemical shift values of protons of anionic CHR (100 µM and 1 mM) in 20 mM Phosphate Buffer, pH 8.0 at 25˚C.
Table 3. NOESY contacts of protons of anionic CHR (1 mM) in 20 mM Phosphate Buffer, pH 8.0 at 25˚C.
no concentration dependent upfield shift of the aromatic protons (Table 2). Only a single NOESY contact between C10-H (δ = 6.058) and C4'-H (δ = 3.087) is observed (Figure 9(a)), which could be ascribed to an altered orientation of CHR molecule as discussed later. Involvement of the aliphatic region of the CHR molecule can be determined from the NOESY contacts of different C-atoms of the aliphatic side chain at C3. An examination of Table 3 shows that C1'-OCH3 (δ = 3.218) develops NOESY contacts with both C5"-CH3 (δ = 1.196) and A-ring acetyl group protons (δ = 2.035) (Figure 9(b)). C3'-H (δ = 3.785) builds NOESY contacts with C1˝-H (A-ring) (δ = 5.473) as well as A-ring acetyl group protons (δ = 2.035) (Figure 9(c)) and C4'-CH3 is spatially close to many sugar atoms (Table 3). These NOESY contacts between the protons could not arise from the same molecule as that would involve a severe steric hindrance and conformational stress (Figure 1). Therefore the anionic CHR molecules are mutually oriented in such a way that the disaccharide moiety of one molecule lies over the aliphatic side chain at C3. To minimize the electrostatic repulsion arising from two anionic molecules aliphatic
 (a)
(a)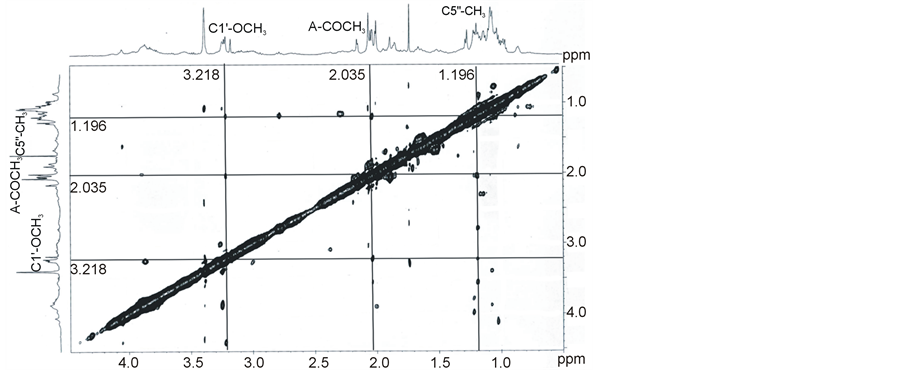 (b)
(b) (c)
(c)
Figure 9. 2D NMR of anionic form: NOESY spectra of CHR (1 mM) in 20 mM phosphate buffer, pH 8.0 at 25˚C showing the cross-peak between (a) C10-H and C4'-H (6.058, 3.087), (b) C1'-OCH3 and C5"-CH3 (3.218, 1.196) and C1'-OCH3 and A-ring-COCH3 (3.218, 2.035), (c) C3'-H and A C1"-H (3.785, 5.473) and C3'-H and A-ring-COCH3 (3.785, 2.035).
chain of one molecule comes close to the aglycone of another molecule. This is probably reflected in the NOESY contact between C10-H and C4'-H (Figure 9(a)).
3.6. NMR Spectroscopic Measurements: Neutral CHR
Chemical shift values for protons in neutral CHR molecule (at pH 6.0) are assigned from 1D and 2D (through bond connectivity-TOCSY and through space connectivity-NOESY) NMR spectra. The peak assignments were then confirmed by a comparison with those of the anionic CHR molecule. The chemical shift values for the protons in the neutral state are not significantly different from those in the anionic state (Table 4).
Similar to that in the anionic form, C5-H and C10-H of the neutral molecule do not develop any NOESY cross peaks apart from those arising due to intramolecular contacts. Here also we do not notice concentration dependent upfield shift of the aromatic protons, thereby ruling out the possibility of aromatic ring stacking mediated association (Table 4).
The aliphatic side chain develops NOESY contacts with a number of protons of the di-saccharide moiety as is exemplified by NOE cross peaks between C1'-OCH3 (δ = 3.221) and A-ring acetyl group protons (δ = 2.039) (Figure 10(a), Table 5). In contrast to anionic form of CHR, aliphatic side chain of neutral CHR does not form any NOE contacts with the aglycone. C1'-OCH3 aliphatic side chain also develops NOE contacts with B-ring C3"-H (δ = 3.763) (Figure 10(b)) and B-ring C5"-CH3 (δ = 1.198) (Figure 10(c)), which is possible if two neutral CHR molecule arrange themselves so that aliphatic side chain of one molecule lies over the disaccharide moiety of another (Scheme 1).
Table 4. Chemical shift values of protons of neutral CHR (100 µM and 1 mM) in 20 mM Phosphate Buffer, pH 6.0 at 25˚C.
Table 5. NOESY contacts of protons of neutral CHR (1 mM) in 20 mM Phosphate Buffer pH 6.0 at 25˚C.
 (a)
(a) (b)
(b) (c)
(c)
Figure 10. 2D NMR of neutral form: NOESY spectra of CHR (1 mM) in 20 mM phosphate buffer, pH 6.0 at 25˚C showing the cross-peak between (a) C1'-OCH3 and A-ring-COCH3 (3.221, 2.039), (b) C1'-OCH3 and B-ring C3"-H (3.221, 3.763), (c) C1'-OCH3 and B-ring C5"-H (3.221, 1.198).
Scheme 1. Association of neutral CHR molecules.
4. Discussion
Self-association of several antibiotics like CS-088, amithramycin, actinomycin D and amphotericin with diverse biological activities as human medicine has been reported earlier [20] -[24] . Our present report has gone in depth to characterize the aggregation behavior of CHR. Previous report on the related antibiotic MTR has been confined to anionic form at which it exists at physiological pH [13] . On the other hand at physiological pH, CHR (pKa = 7.0) is a mixture of anionic and neutral forms. Therefore, in this report, we have employed various spectroscopic and calorimetric techniques to understand the molecular basis of self-association of the antibiotic CHR in its neutral form as well as the anionic form. For comparison among the two antibiotics we have also studied in part the hitherto unreported aggregation of neutral form of MTR. Spectroscopic studies, such as absorbance, fluorescence and circular dichroism, provide evidences for the existence of different molecular species present in wide concentration range. Due to the formation of aggregates, an increase in normalized fluorescence intensity is observed for both neutral and anionic CHR (Figure 3 and Figure 4), which would otherwise have been unchanged. The aggregation also leads to blue shift of the peak position of the emission spectra, the values being 2 nm and 5 nm for aggregation of neutral and anionic CHR, respectively. These features suggest that the chromophore portion of the molecule enters into an enhanced hydrophobic environment. The self-association process becomes apparent in CD spectroscopy, when the effect of coupling between transition dipoles (n→π*) of chromophores in aggregates gives rise to the splitting of bands in the visible region at higher concentration (Figure 5). The concentration dependence of ellipticity values has helped to evaluate the dissociation constant for the three equilibria present over the concentration range reported here. Figure 6 and Figure 7 show there are three breaks in the plots of ellipticity versus concentration for neutral and anionic CHR in this concentration range. The multiple equilibria as mentioned above to account for the aggregation suggest the formation of a tetramer at the highest concentration.
For neutral CHR the trimer to tetramer transition occurs at ~135 µM and for anionic CHR at ~83 µM. No further self-association is observed beyond these concentrations. Among the neutral and anionic forms of CHR, the anionic form has higher association constant in the case of CHR. Quantitative analysis of the CD data (Table 1) shows that dimerisation is the predominant process followed by weaker association of CHR molecules over the total concentration range. Similar trend in association is also reported for neutral (present study) and anionic MTR from our laboratory [13] . However, a comparative analysis shows that dimer formation is free energy wise most favorable for CHR in contrast to MTR, where tetramer formation is the most favorable process. The overall association constant for the equilibrium: 4M ⇌ M4 is also significantly higher (by a factor of 104) for both forms of MTR (Table 1). These results emphasize the role of sugars in the oligomerization process. It also suggests that the state of ionization does not modulate the aggregation property of the antibiotics.
For a molecular species molar heat of dilution depends on its interaction with solvent, which should be independent of its concentration in the solution, if it has not undergone any change during dilution [13] . In this study we have seen a concentration dependent change in molar heat of dilution for neutral CHR (at pH 5.0) and anionic CHR (at pH 9.0), which is possible if CHR molecules self associate among themselves. But the molar heat of dilution of anionic MTR, which is reported from our laboratory, is greater than the same for neutral and anionic CHR [13] . On the other hand, in case of neutral MTR the enthalpy change is comparable to neutral CHR. Anionic form of MTR has higher free energy of association, as obtained from quantitative analysis of CD data (Table 1). The results indicate that self-association process of anionic CHR is mostly entropy driven whereas for anionic MTR it is enthalpy driven. This striking difference between the two molecules with similar structure shows that CHR might form hydrophobic clusters. Such hydrophobic clusters may also characterize the self-association for neutral MTR, because its association is entropy driven as indicated from low value of enthalpy of dissociation. The repulsion of large number of surrounding solvent molecules is a plausible factor contributing to the total entropy of the system.
The mode of self-association is further characterized by NMR spectroscopy. Features suggesting against stacking interactions include absence of upfield chemical shift of the aromatic protons (Table 2) and any intermolecular NOE contacts in the aromatic region (C5-H and C10-H) in both neutral and anionic CHR. Analysis of the NOE spectra of anionic CHR reveals a conformation in which the di-saccharide unit of one molecule of anionic CHR lies above the aliphatic side chain at C3 of another molecule (Scheme 2). On the other hand, similar analysis of the NOE spectra of neutral CHR reveals an aggregated conformation, where two CHR molecules are probably in a mutually trans-orientation (Scheme 1). Distinct NOE contacts between the disaccharide moiety of one molecule and the aliphatic side chain of another molecule as well as NOE contacts of C7-CH3 with different sugar protons provide support to our hypothesis. A priori one might assume a similar molecular arrangement for the anionic molecule, due to similar NOE contacts. NOE data shows that there is no significant NOE cross peaks for C7-CH3 in the anionic CHR, which could therefore rule out such an orientation of the CHR molecules. This altered conformation in case of anionic CHR could be ascribed to the charge repulsion at C9-O, which would be predominant in the trans orientation (Scheme 2). Similar charge repulsion is not present in the neutral form and hence it can adopt the trans orientation (Scheme 2). Therefore, it is observed that CHR aggregates both in the neutral as well as in the anionic form with different modes of relative molecular arrangement of the monomer species.
MTR and CHR have different sugar moieties attached to the identical aglycone [10] [11] . NMR data analysis had earlier shown that self aggregation of anionic MTR in aqueous media is mediated by sugar moieties [13] . NMR studies in the present report have demonstrated that the self-association process in CHR is also sugar mediated; aggregated CHR differ in the structural arrangement from MTR. However, in both cases aromatic moieties do not play a significant role in the stabilization of the aggregates. Sugars are amphiphilic in nature as they have hydrophobic (CH) and hydrophilic (OH) faces [25] -[27] . Sugars in CHR has more CH-surface compared to MTR, which gives rise to enhanced hydrophobic interaction between CHR molecules in aqueous solvents, which leads to entropy driven self-association for CHR. But in case of MTR due to presence of some extra -OH group there is a possibility of formation of H-bonds between MTR and solvent water molecules, which may be the reason for higher enthalpy change in case of dilution of anionic MTR.
The difference between the two antibiotics can be traced back to the organization of their respective gene clusters, which also suggests different regulatory mechanisms for MTR and CHR in the producer organisms [2] . Apart from other differences in chemical properties observed earlier (e.g. acidity, cytotoxicity, etc.), difference in chemical constitution of MTR and CHR, also leads to different characteristics of self-association. CHR aggregates at a much lower concentration (3 µM - 5 µM) as compared to anionic MTR, which starts aggregating at around 20 µM. This inherent tendency of CHR to dimerize is also reflected in the very low Kd values of the dimerization process. Although the relative conformations of CHR molecules differ according to the ionization state of the molecule, both forms start to aggregate at relatively lower concentrations. The entropy driven association of CHR also indicates the pre-disposition of the antibiotic to form clusters even at low concentrations, which might therefore lead to altered bioactivity of CHR both in the producer organism as well as an antibiotic.
MTR and CHR have difference in cytotoxicity towards cell lines from different species [28] [29] . This suggests that MTR and CHR have differences in cellular uptake and retention rising from the differences present in the structure of these two antibiotics. Different sugar moieties with substituents, present in MTR and CHR, may alter the specific interaction between receptors present on the cell surface and the antibiotics. So, self aggregation
Scheme 2. Association of anionic CHR molecule.
property of these antibiotics plays a role in cellular transportation. Two oligosaccharide moieties and the acetyl-groups which are associated with the sugars (A and E) are major structural contributors to the biological activity of CHR [30] , because it has been established that elimination of acetyl groups leads to the generation of a derivative with significantly decreased antitumor activity [2] [10] . The antibiotics are comparably effective to inhibit DNA dependent RNA synthesis via reversible association of the dimer: metal ion complex with DNA [28] . However, in an earlier study we have demonstrated the role of sugars in the association of the antibiotics with DNA and the oligonucleotide fragment [31] .
5. Conclusion
Current study has characterized the oligomerisation (n = 2 to 4) of neutral and anionic CHR in buffers of pH 5 and 9. Though apparently akin to the earlier reported process of self-association of the related antibiotic Mithramycin (MTR), there are notable differences as observed both in terms of the quantitative binding parameters and associated thermodynamics. Dimerisation of CHR’s both neutral and anionic forms, which is the predominant process, starts at much lower concentration (<10 µM) compared to MTR, whereas tetramerisation is the predominant process for MTR in both neutral and anionic forms. 1H NMR studies have revealed that, sugar moieties attached to their aglycone part in CHR and MTR play key roles in the self-association process. The difference in the sugar substituents present in CHR and MTR gives rise to the alteration of self-aggregation pattern in aqueous solution though in both processes hydrophobic interaction is important. Finally, the most important feature emerging from the present study and the earlier one from our laboratory show that the different carbohydrate moieties present in the same class of antibiotics might give rise to a difference in intracellular state of molecular forms (monomer or aggregate) and hence biological activity and possibly cytotoxicity.
Acknowledgements
This work was funded from the intramural grant (MMDDA and BARD project) from the Department of Atomic Energy (DAE, Govt. of India). The authors thank Prof. Gautam Basu of Bose Institute, Kolkata for the permission to use the 500 MHz NMR in central facility. We also thank Mr. Barun Majumder of Bose Institute, Kolkata for his technical assistance with NMR experiments. S.D thanks Council of Scientific and Industrial Research (CSIR), Govt. of India for the award of research fellowship. We thank Ms. Saptaparni Ghosh, SRF, Saha Institute of Nuclear Physics (SINP) for helping with the ITC experiments.
References
- Calabresi, P., Chabner, B.A., Hardman, J.G. and Limbard, L.E. (1991) Goodman and Gilman’s “The Pharmacological Basis of Therapeutics: Chemotherapy of Neoplastic Diseases”. Macmillan, New York, 1225-1269.
- Lombo, F., Menendez, N., Salas, J.A. and Mendez, C. (2006) The Aureolic Acid Family of Antitumor Compounds: Structure, Mode of Action, Biosynthesis, and Novel Derivatives. Applied Microbiology and Biotechnology, 73, 1-14. http://dx.doi.org/10.1007/s00253-006-0511-6
- Reynolds, R.D., Fisher, J.I., Jensen, P.A., Pajak, T.F. and Bateman, J.R. (1976) Phase I Alternate-Day Dose Study of Chromomycin A3. Cancer Treatment Reports, 60, 1251-1255.
- Sahar, E. and Latt, S.A. (1978) Enhancement of Banding Patterns in Human Metaphase Chromosomes by Energy Transfer. Proceedings of the National Academy of Sciences USA, 75, 5650-5654. http://dx.doi.org/10.1073/pnas.75.11.5650
- Goldberg, I.H. and Friedman, P. (1971) Antibiotics and Nucleic Acids. Annual Review of Biochemistry, 40, 775-810. http://dx.doi.org/10.1146/annurev.bi.40.070171.004015
- Aich, P., Sen, R. and Dasgupta, D. (1992) Role of Magnesium Ion in the Interaction between Chromomycin A3 and DNA: Binding of Chromomycin A3-Mg2+ Complexes with DNA. Biochemistry, 31, 2988-2997. http://dx.doi.org/10.1021/bi00126a021
- Snyder, R.C., Ray, R., Blume, S. and Miller, D.M. (1991) Mithramycin Blocks Transcriptional Initiation of the c-myc P1 and P2 Promoters. Biochemistry, 30, 4290-4297. http://dx.doi.org/10.1021/bi00231a027
- Fibach, E., Bianchi, N., Borgatti, M., Prus, E. and Gambari, R. (2003) Mithramycin Induces Fetal Hemoglobin Production in Normal and Thalassemic Human Erythroid Precursor Cells. Blood, 102, 1276-1281. http://dx.doi.org/10.1182/blood-2002-10-3096
- Devi, P.G., Chakraborty, P.K. and Dasgupta, D. (2009) Inhibition of a Zn (II)-Containing Enzyme, Alcohol Dehydrogenase, by Anticancer Antibiotics, Mithramycin and Chromomycin A3. Journal of Biological Inorganic Chemistry, 14, 347- 359. http://dx.doi.org/10.1007/s00775-008-0451-y
- Menendez, N., Nur-e-Alam, M., Brana, A.F., Rohr, J.A. and Mendez, C. (2004) Tailoring Modification of Deoxysugars during Biosynthesis of the Antitumour Drug Chromomycin A3 by Streptomyces griseus ssp. Griseus. Molecular Microbiology, 53, 903-915. http://dx.doi.org/10.1111/j.1365-2958.2004.04166.x
- Bosserman, M.A., Florez, A.B., Shaaban, K.A., Brana, A.F., Salas, J.A., Mendez, C. and Rohr, J. (2011) Characterization of the Terminal Activation Step Catalyzed by Oxygenase CmmOIV of the Chromomycin Biosynthetic Pathway from Streptomyces griseus. Biochemistry, 50, 1421-1428. http://dx.doi.org/10.1021/bi1016205
- Beam, M.P., Bosserman, M.A., Noinaj, N., Wehenkel, M. and Rohr, J. (2009) Crystal Structure of Baeyer-Villiger Monooxygenase MtmOIV, the Key Enzyme of the Mithramycin Biosynthetic Pathway. Biochemistry, 48, 4476-4487. http://dx.doi.org/10.1021/bi8023509
- Lahiri, S., Devi, P.G., Majumder, P., Das, S. and Dasgupta, D. (2008) Self-Association of the Anionic Form of the DNA-Binding Anticancer Drug Mithramycin. The Journal of Physical Chemistry B, 112, 3251-3258. http://dx.doi.org/10.1021/jp710503g
- Nayak, R., Sirsi, M. and Podder, S.K. (1975) Mode of Action of Antitumour Antibiotics: Spectrophotometric Studies on the Interaction of Chromomycin A3 with DNA and Chromatin of Normal and Neoplastic Tissue. Biochimica et Biophysica Acta (BBA)-Nucleic Acids and Protein Synthesis, 378, 195-204.
- Martin, S.R. (1980) Absorption and Circular Dichroic Spectral Studies on the Self-Association of Daunorubicin. Biopolymers, 19, 713-721. http://dx.doi.org/10.1002/bip.1980.360190318
- Gao, X. and Patel, D.J. (1989) Solution Structure of the Chromomycin-DNA Complex. Biochemistry, 28, 751-762. http://dx.doi.org/10.1021/bi00428a051
- Gao, X. and Patel, D.J. (1990) Chromomycin Dimer-DNA Oligomer Complexes. Sequence Selectivity and Divalent Cation Specificity. Biochemistry, 29, 10940-10956. http://dx.doi.org/10.1021/bi00501a012
- Devi, P.G., Pal, S., Banerjee, R. and Dasgupta, D. (2007) Association of Antitumor Antibiotics, Mithramycin and Chromomycin, with Zn(II). Journal of Inorganic Biochemistry, 101, 127-137. http://dx.doi.org/10.1016/j.jinorgbio.2006.08.018
- Lahiri, S., Takao, T., Devi, P.G., Ghosh, S., Ghosh, A., Dasgupta, A. and Dasgupta, D. (2012) Association of Aureolic Acid Antibiotic, Chromomycin A3 with Cu2+ and Its Negative Effect upon DNA Binding Property of the Antibiotic. Biometals, 25, 435-450. http://dx.doi.org/10.1007/s10534-011-9516-4
- Chaires, J.B., Dattagupta, N. and Crothers, D.M. (1982) Self-Association of Daunomycin. Biochemistry, 21, 3927- 3932. http://dx.doi.org/10.1021/bi00260a004
- Kikuchi, T., Ito, N., Suzuki, M., Kusai, A., Iseki, K. and Sasaki, H. (2005) Self-Association Properties of 4-[1- Hydroxy-1-Methylethyl]-2-Propyl-1-[4-[2-[Tetrazole-5-yl]Phenyl]Phenyl] Methylimidazole-5-Carboxylic Acid Monohydrate (CS-088), an Antiglaucoma Ophthalmic Agent. International Journal of Pharmaceutics, 299, 100-106. http://dx.doi.org/10.1016/j.ijpharm.2005.04.035
- Lewis, R.J., Hughes, R.A., Alcaraz, L., Thompson, S.P. and Moody, C.J. (2006) Solution Structures of Thiopeptide Antibiotics. Chemical Communications, 40, 4215-4217. http://dx.doi.org/10.1039/b609282a
- Grijalba, M.T., Cheron, M., Borowski, E., Bolard, J. and Schreier, S. (2006) Modulation of Polyene Antibiotics SelfAssociation by Ions from the Hofmeister Series. Biochimica et Biophysica Acta (BBA)—General Subjects, 1760, 973- 979. http://dx.doi.org/10.1016/j.bbagen.2006.02.004
- Veselkov, D., Lantushenko, A., Davies, D. and Veselkov, A. (2002) The Self-Association of Antibiotic Actinocyl-Bis (3-Dimethylaminopropylamine) in Aqueous Solution: A 1 H NMR Analysis. Russian Journal of Bioorganic Chemistry, 28, 342-347. http://dx.doi.org/10.1023/A:1019556211221
- Patel, T.R., Harding, S.E., Ebringerova, A., Deszczynski, M., Hromadkova, Z., Togola, A., Paulsen, B.S., Morris, G.A. and Rowe, A.J. (2007) Weak Self-Association in a Carbohydrate System. Biophys Journal, 93, 741-749. http://dx.doi.org/10.1529/biophysj.106.100891
- Santacroce, P.V. and Basu, A. (2004) Studies of the Carbohydrate-Carbohydrate Interaction between Lactose and GM3 Using Langmuir Monolayers and Glycolipid Micelles. Glycoconjugate Journal, 21, 89-95. http://dx.doi.org/10.1023/B:GLYC.0000044841.12706.12
- Yano, Y., Tanaka, K., Doi, Y. and Janado, M. (1988) The Polystyrene Affinity of Methylglycosides, Deoxysugars and Glucooligosaccharides. Journal of Solution Chemistry, 17, 347-358. http://dx.doi.org/10.1007/BF00650415
- Singh, B. And Gupta, R.S. (1985) Species-Specific Differences in the Toxicity and Mutagenicity of the Anticancer Drugs Mithramycin, Chromomycin A3, and Olivomycin. Cancer Research, 45, 2813-2820.
- Chan, J., Khan, S.N., Harvey, I., Merrick, W. and Pelletier, J. (2004) Eukaryotic Protein Synthesis Inhibitors Identified by Comparison of Cytotoxicity Profiles. RNA Society, 10, 528-543. http://dx.doi.org/10.1261/rna.5200204
- Chakrabarti, S., Bhattacharyya, D. and Dasgupta, D. (2001) Structural Basis of DNA Recognition by Anticancer Antibiotics, Chromomycin A3, and Mithramycin: Roles of Minor Groove Width and Ligand Flexibility. Biopolymers, 56, 85-95. http://dx.doi.org/10.1002/1097-0282(2000)56:2<85::AID-BIP1054>3.0.CO;2-7
NOTES

*Corresponding author.