Open Journal of Biophysics
Vol.3 No.1(2013), Article ID:27492,11 pages DOI:10.4236/ojbiphy.2013.31003
Techniques to Quantify the Size of Protein Colloids in Amyloid Fiber Formation
1Florida Institute of Technology, Melbourne, USA
2NASA Kennedy Space Center, Cape Canaveral, USA
Email: jonling2012@gmail.com
Received November 19, 2012; revised December 27, 2012; accepted January 7, 2013
Keywords: Colloid; Atomic Force Microscopy; Nanoparticles; Gold; Surface Plasmon Resonance; Amyloid; Spectrophotometry
ABSTRACT
A new method for the analysis of protein colloidal diameter has been developed using three existing protein concentration quantification techniques, absorption at 280 nm, colloidal gold assay, and DC protein assay. Protein colloids are formed in the process of aggregation and are thought to be intermediates in protein self-assembly and formation of amyloid fiber. Deposition of the protein fibers in tissues leads to numerous human diseases including Alzheimer’s. Lysozyme was incubated at pH 2.0, 55˚C, an environment conducive to amyloid fiber formation. The protein colloids present in the supernatant of the samples after centrifugation were studied over a time course of 30 days. The OD 280 assay detects total protein concentration based on absorption of radiation in the near UV. The colloidal gold assay and DC protein assay only measure colloidal sphere surface protein concentration. Due to the surface plasmon resonance, the light absorption spectrum changes when proteins bind to colloidal gold particles. Using the measured protein concentration on the surface of protein colloids along with the total measured protein concentration in the entire protein colloidal spheres, an interior protein concentration for all colloids is obtained. The protein colloidal sphere size can be calculated by using the ratio between the interior protein concentration and total protein concentration. Results indicate that the colloidal gold assay, DC protein assay, and OD 280 assay can be used to quantify the size of the protein colloids. The colloidal gold assay and DC protein assay are both independently effective in analysis of surface protein concentration in protein colloids. The DC protein assay was found to be much quicker in data production as it only requires 15 minutes of incubation time. The DC protein assay was also more reliable than the colloidal gold assay in accuracy and precision of results.
1. Introduction
A wide range of diseases, which include Alzheimer’s disease, Parkinson’s disease, type 2 diabetes, systemic amyloidosis, and prion-related diseases were associated with the presence of amyloid aggregates in various parts of the body. Normally, there exist two main steps for amyloid fiber formation. Firstly, amyloidogenic protein monomers aggregate to form spherical particles commonly referred to as protein colloids, which further assemble into linear fibers [1]. Although the clinical and biochemical characteristics are distinct, the common feature implicated in the pathogenesis of amyloid-related diseases is self-assembly of normally soluble proteins into amyloid aggregates (dimers, colloids, fibers). This insoluble amyloid fiber cannot be removed from the human body. This phenomenon can exist in tissue, especially in the brain, leading to synaptic dysfunction and cognitive deficits. Therefore, colloids appear in the early stage of amyloid fiber formation and play an important role in amyloid fiber formation. A way to quantify the diameter of colloids is quite helpful in the understanding of amyloid fiber formation.
Three existing methods for protein concentration quantification were employed to characterize the protein colloids involved in amyloid fiber formation, namely OD 280, colloidal gold assay, and DC protein assay. As these methods interact with protein differently, this allows an estimation of the amount of proteins on the surface and interior of the colloids. Total protein concentration in solution can be analyzed by OD 280, which is based on absorption of photons by aromatic amino acids, and is less affected by protein aggregation. The colloidal gold assay as well as the DC assay are based on interaction of the reagents with proteins and thus can only report protein quantity on the surface of protein colloids as the interior is not accessible.
Colloidal gold nanoparticles possess unique abilities that allow for many useful applications in science and technology. Gold nanoparticle conjugated biomolecules can be used effectively for drug delivery, gene transfer, bioprobes in cell and tissue analysis, and study of biological processes at the nanoscale [2]. They can be thermally excited through the use of radio frequency waves as well, which will be essential in future biomedical treatments [3]. Nanoparticles are used in many fields for several different applications due to their unique optical and electrical properties. There has been an explosion of interest by scientists in the surface plasmon resonance phenomenon unique to nanoparticles [4]. Localized surface plasmon resonance (LSPR) is an optical phenomenon resulting from collective oscillations of the electron gas in metal nanoparticles submerged by a dielectric environment. Most nanoparticles, particularly gold nanoparticles, possess strong absorption in the UV-visible region due to LSPR. Whenever a binding event occurs with a target molecule, there is a local refractive index change induced which can be seen through an LSPR peak shift [4]. This feature has been instrumental in the success of bio-sensing assays. As a result, the new bio-sensing techniques developed have allowed for several discoveries in biomedical research.
The localized surface plasmon resonance property of gold nanoparticles is used in several optical sensor arrangements which includes solution-based bioassays, paper-based colorimetric detection, and surface-confined nanoparticle film/array-based sensing [5]. Currently, there is a lack of spectrophotometry methods to properly measure the diameter of a protein colloidal aggregate. Here, we present a new solution-based bioassay to measure the diameter of a colloidal sphere, which is composed of aggregated lysozyme protein.
The DC protein assay has been used as well as a substitute for the colloidal gold assay. The DC protein assay, a modified Lowry or Folin-Ciocalteu assay [6], is based on imido groups to form chelation complex with Cu2+ in solution, requires the peptide groups to be accessible to the dication. Thus, the DC protein assay reports total surface protein concentration of the protein colloids. It is very efficient at measuring lysozyme colloid surface protein concentration. The DC protein assay is even more effective in measuring colloidal sphere size due to its accuracy and precision.
The experiments conducted relied heavily on egg white Lysozyme. This is an excellent model protein, well studied, inexpensive, and high quality for the study of the mechanism of the fiber formation process under a specific condition, including temperature, pH, and shaking [7]. In this paper, 1) We applied the three protein concentration analysis methods, OD 280, colloidal gold assay, and DC assay and analyzed protein colloids in solution; 2) Based on the difference in the total amount of protein detected for the same solution by the three methods, we quantified the amount of protein on the surface and in the interior of the protein colloids; and 3) Based on a math model we provided, we were able to determine the diameter of the protein colloids.
2. Materials and Methods
2.1. Amyloid Fiber Synthesis
In order to study amyloid fiber formation in a timely fashion, lysozyme protein was incubated in denaturing conditions, pH 2.0, 55˚C. These conditions were selected in order to lower the activation energy barrier to protein aggregation. Additionally, plastic Eppendorf tubes were used instead of glass tubes due to their demonstrated faster amyloid fiber generation rate.
Lyophilized chicken egg white lysozyme, product number L6876, was obtained from Sigma Aldrich (St. Louis, MO). 10 mg/ml, 20 mg/ml, 40 mg/ml, and 60 mg/ml solutions were prepared. A pH 2.0 buffer was created for the incubation of lysozyme by using 0.01 N HCl while monitoring the pH change. Upon dissolution of the lysozyme, the solution was immediately placed into an Isotemp isothermal heat block for incubation at 55˚C. Upon incubation completion, the samples were either analyzed immediately or stored at −20˚C for future analysis. After 2, 9, 18, 29 and 30 days, collections of samples were accomplished by centrifugation and subsequent removal of the supernatant.
2.2. Colloidal Gold Solution Synthesis and Use
The colloidal gold was synthesized using the Turkevich method [8,9]. A 20 nm colloidal gold aqueous solution was prepared by mixing 1% chloroauric acid (2.5 ml solution containing 25 mg gold) with 2.5 ml sodium citrate. This was transferred to an Erlenmeyer conical flask with 250 ml of boiling distilled water which was stirred on a heater. When its temperature reached 90˚C, 6 ml of 0.05 M sodium citrate solution and 12 ml 1% glucose solution were quickly added. A blue color immediately changed to the typical red wine color of colloidal gold solution. The solution was stored at 4˚C. The colloidal gold solution used in Figure 1 was purchased from Sigma Aldrich.
2.3. UV Absorbance at OD 280
A standard curve of known protein concentrations was created to determine supernatant protein concentrations of the samples after centrifugation. The protein solution was diluted in the buffer to a concentration that was well within the accurate range of the instrument. To create the standard curve, six different lysozyme concentrations were made, which include 0.2, 0.4, 0.6, 0.8, 1.0 and 1.2 mg/ml. The starting concentration that was used before
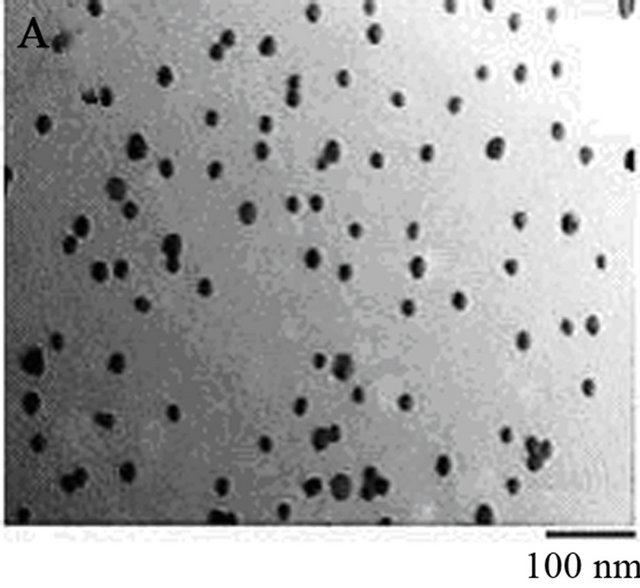
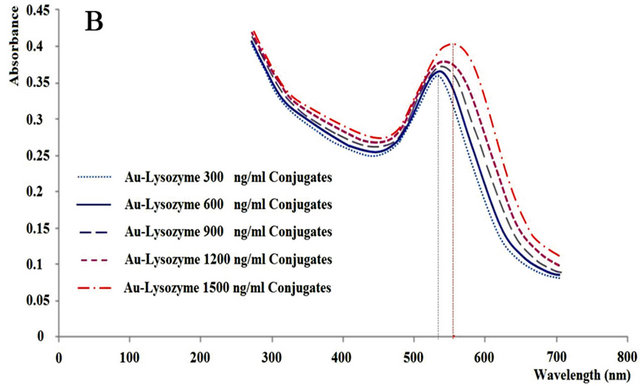

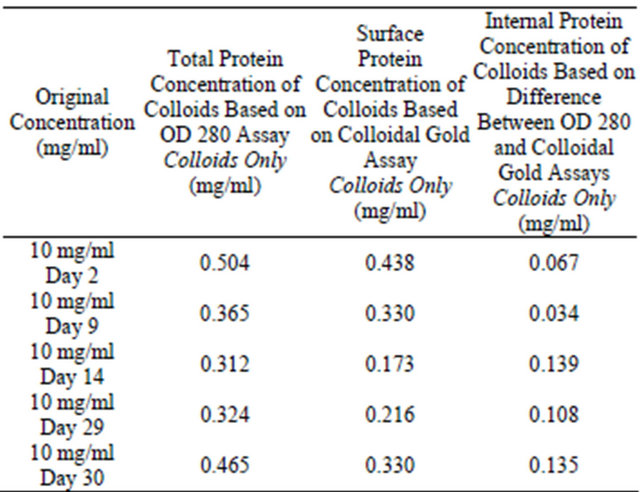
Figure 1. (A) TEM image of homogeneous gold colloids. Colloidal gold particles used in this assay are analyzed for the size homogeneity and mono-dispersion. Colloidal gold solution 0.92 mg/ml was prepared following the methods described in materials and methods. 3 µl of 0.092 mg/ml colloidal gold solution were applied to a 3 mm copper TEM grid. Samples were air dried for 10 minutes before images were taken using TEM. The image reveals an average colloidal diameter of 22 nm ± 3 nm with 4 particles/cm2. (B) Absorption spectrum of colloidal gold and lysozyme monomer complex. Lysozyme monomer at various concentrations from 300 to 1800 ng/ml were incubated with 20 nm gold colloids, in 20 mM citrate, 0.005% Tween 20, pH 3.0. A red shift is observed and wavelength amplitude increases as protein concentration increases due to changes in the localized plasmon resonance of the gold nanoparticles. (C) Protein concentrations of supernatants of 10 mg/ml pH 2.0 lysozyme samples at various phases of incubation. Calibration curves can be viewed to the right. Solutions were measured via OD 280 and surface plasmon protein concentration assay using pH 3 buffer described in materials and methods. Surface and total protein concentration of protein colloids is implicated from this graph. The initial difference between the two assays remains low until an abrupt change at Day 14 of incubation. The aggregation kinetics of the proteins thereafter give rise to a difference between the assays that remains relatively the same until Day 29.
the dilutions with citrate buffer, pH 3.0, consisted of a 2.5 mg/ml lysozyme-DI water solution. OD 280 effectively measures total protein concentration of the lysozyme protein colloidal spheres. The citrate buffer was prepared by mixing 20 mM citric acid solution with 20 mM sodium citrate solution until the proper pH was reached. Tween 20, final concentration 0.25%, was added to the citrate buffer.
2.4. Gold Colloidal Assay
The same pH 3.0 buffer used in the OD 280 assay was used for the colloidal gold assay. The protein concentration of the extracted supernatant of the samples was determined with reference to a calibration curve. In order to create the calibration curve, six different concentrations of 300, 600, 900, 1200, 1500 and 1800 ng/ml from 2.5 mg/ml of lysozyme were created. Using a UV Plate with 96 wells from Constar, 80 µl of protein solution and 200 µl colloidal gold solution were added and allowed to react for 30 minutes before being tested at 595 nm on the micro-plate reader. The absorption values were obtained and the standard curve that was created allowed for the measurement of the surface protein concentration of the lysozyme protein colloidal spheres of each sample.
2.5. DC Protein Assay
The assay is based on the reaction of protein with an alkaline copper tartrate solution and Folin reagent. Proteins cause a reduction of the Folin reagent thereby producing one or more of several possible reduced species which have a characteristic blue color with maximum absorbance at 750 nm and minimum absorbance at 405 nm [10].
Six different concentrations, which include 0.2, 0.4, 0.6, 0.8, 1.0 and 1.2 mg/ml from 2.5 mg/ml of lysozyme were created for the calibration curve. Dilutions were made using the same pH 3.0 buffer. Next, 5 µl of each sample supernatant was added to a micro-plate well including 25 µl of reagent A and 200 µl of reagent B. Reagents A and B were purchased from Bio Rad. The lysozyme reacted with the protein reagent for 15 minutes and was placed in the micro-plate reader and tested at 750 nm; the protein concentration was determined with reference to a calibration curve. The absorption values were obtained using the lysozyme concentration diagram. The standard curve was used to determine the protein concentration of each sample, which indicated surface protein concentration of the protein colloids.
2.6. TEM Analysis
The TEM study was performed using a Zeiss model EM900 powered at 80 kV. The synthesized colloidal gold solution was poured on the top of a TEM 3 mm diameter copper grid. Excess liquid was removed by using Kimwipe. The grid was allowed to dry before performing TEM.
2.7. Size Exclusion Chromatography
Size exclusion chromatography (SEC) experimentation was conducted using FPLC supplied by Pharmacia. A Sephadex G-75 column (1.5 cm × 30 cm) in 5 mM ammonium acetate pH 3.0 buffer was prepared. 1.2 ml of 20 mg/ml incubated lysozyme amyloid fiber reaction solution was extracted, centrifuged for 10 minutes at 12,000 RPM, and the supernatant was applied to the column. Fractions from FPLC were collected and made ready for AFM observation.
2.8. AFM Slide Preparation
Sample supernatant was extracted and diluted 10,000 fold using DI water. The slides were rinsed with 10 µl 0.1 N NaOH. 10 µl of sample was administered to surface of AFM slide. The slide was then washed with 1 ml of deionized water after a short period of time and then dried.
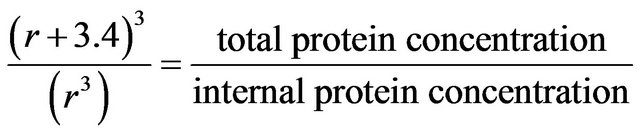
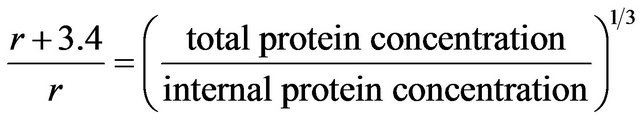
2.9. Colloidal Sphere Radius Calculations
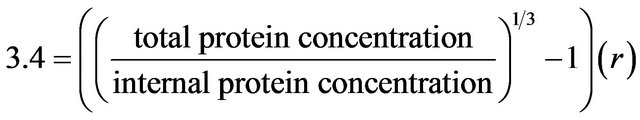
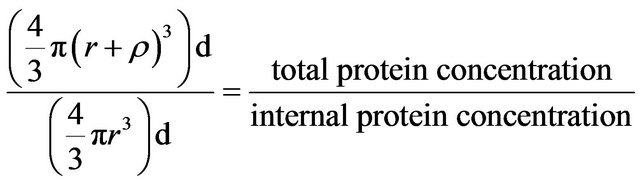 (1)
(1)
where  = surface penetration detection limit = 3.4 nm, d = density, and r = radius of smaller internal sphere, r +
 = radius of larger sphere.
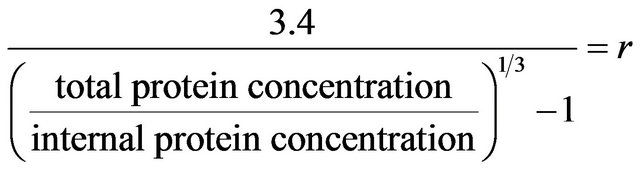
The colloidal gold assay detects surface proteins, but to a depth that is currently unknown for lysozyme protein colloidal spheres. We assume that the colloidal gold assay detects only the surface monolayer of lysozyme, i.e., a depth of 3.4 nm. Additionally, this value was obtained using somewhat of a top down approach that considers the radius of a lysozyme protein colloid obtained via TEM and AFM imaging, which has been measured to be 11 nm previously. This information is quite useful in conjunction with the above equation in obtaining a reasonable value for the surface penetration detection limit. With this assumption of surface penetration detection distance, the protein colloidal size or radius can be calculated via the ratio of the total protein concentration measured by OD 280 and internal protein concentration which is the difference between OD 280 and gold assay. See the equation.
Firstly, it is assumed that the exact penetration distance is equal to the diameter of a protein. This is critical in this equation because whatever is measured on the right side of the equation should be properly represented on the left side. If the colloidal gold assay detects protein material 3.4 nm deep inside of a colloidal sphere, it is important to include that within the equation for accuracy of results. It is a constant to represent the measured outer layer distance by the colloidal gold assay. In other words, if 7 mg/ml is detected on the surface, it is important to know how deep the colloidal gold assay is detecting the protein material. Hence, this is why there is a need for this constant. Additionally, the colloids measured are also assumed to have uniformity and the distribution of the proteins on the colloidal spheres is assumed to be uniform as well.
Upon referral to the Equation (1), by using a ratio of total protein concentration to interior protein concentration of the colloids suspended within the supernatant, the scope of the values measured will dramatically be reduced, enabling the focus to be drawn to smaller entities. This ratio helps to envision a relative size relationship. The protein colloidal sphere can be visually and mathematically envisioned as a comparison between a smaller internal protein colloidal sphere and a larger total protein colloidal sphere. To illustrate the principle of this equation, imagine an internal protein colloidal sphere and a larger protein colloidal sphere which contains the internal protein colloidal sphere. If total proteins in this sphere are known, and internal protein number is known, and there exists a known measureable difference in size (which is closely related with surface penetration detection limit), a definitive size for the larger sphere can be obtained. It is important to note that the DC protein assay detects surface proteins as well, but to a depth of roughly half that of the colloidal gold assay (1.7 nm). The calculations used for the DC protein assay used 1.7 nm as the constant, .
.
Secondly, the radius of a lysozyme protein has been calculated. The colloidal gold assay, or surface plasmon concentration assay, is assumed to detect roughly 3.4 nm into the surface of a colloid. If lysozyme protein were assumed to be spherical, the radius would also be 3.4 nm. The dimensions of a lysozyme protein are 3.0 × 3.0 × 4.5 nm [11].
The following equation was used to calculate lysozyme colloid sphere size:

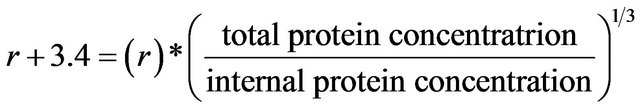
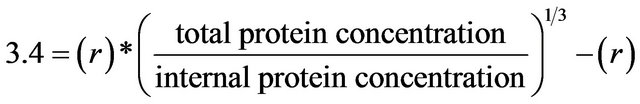
where r + ρ = radius of larger sphere.
The chemical and physical properties of matter are usually determined by the type of motion that the electrons are allowed to execute. The motion of the electrons is heavily dependent on the type of material as well as the space accessible to the electrons associated with the material. Generally, new properties and characteristics of nanoparticles emerge due to restrictions that are imparted on the electronic motion of the nanoparticles [12].
Well separated metallic nanoparticles with dimensions significantly smaller than the wavelength of the exciting light give rise to a broad, intense absorption band in the visible range of the spectrum. The peak height, bandwidth, and position of the absorption maximum depend on the size, size distribution, surface state, surface coverage, and surrounding environment of the given nanoparticles [13].
As the size of a noble metal decreases, new properties manifest along with the existence of a unique phenomenon known as plasmon resonance. When a metallic nanoparticle is illuminated via an incident wavelength, localized electrons in the nanoparticle oscillate. As a result, strong surface waves are generated. The curvature of the nanoparticle generates a restoring force on the conduction electrons giving rise to plasmon resonance. Effective field enhancement results in the near field zone. This resonance is referred to as LSPR, or localized surface plasmon resonance [14]. When the wavelength of the photon is equal to the resonance wavelength of the gold nanoparticle, the photon will couple to the surface inducing the electrons in the surface to move as a single entity known as a plasmon [15]. Sometimes, a photon with a similar resonant wave will become confined to the nanoparticle and mimic the same oscillation as the electrons in the plasmon resonance band. Gold nanoparticles that are very small appear ruby red due to their strong absorption of green light at roughly 520 nm, which is the frequency at which plasmon resonance occurs with the gold [16].
The high sensitivity of SPR particles is a result of the high dependence on the coupling coefficients on minute refractive index changes which are induced by biomolecular interactions at the metal/dielectric interface [17]. When molecules bind to the surface of the gold nanoparticles, they perturb the plasmon and change the resonance wavelength Figure 2. These shifts are indicative of minute refractive index changes on the surface of the gold nanoparticle [15]. Figure 2 shows an absorbance energy reduction once the molecule binds to the gold nanoparticle.
Figure 1(B) clearly demonstrates that as more lysozyme is added to each of the consecutive micro-plate wells, more lysozyme particles bind to the gold nanoparticles causing a change in the refractive index at the metal/dielectric interface. This causes a shift in the observed absorption band of the LSP. This allowed for the creation of a Beers Law calibration curve to estimate surface protein concentration of the lysozyme protein colloidal spheres.
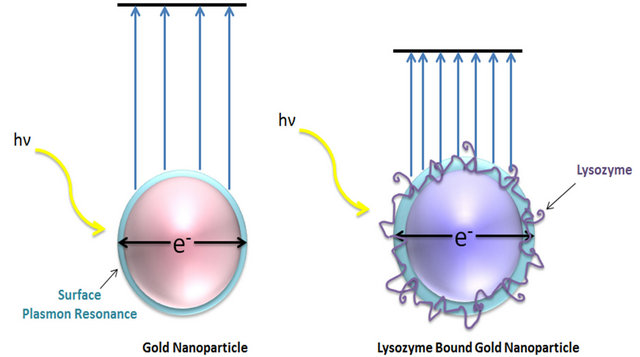
Figure 2. The localized surface plasmon resonance is an oscillation of conduction band electrons. Plasmonic confinement of an incident photon results in an increase in the degree of light absorption, fluorescence, and scattering. Particles bound to the gold colloids strongly influence resonance behavior.
Lysozyme colloidal spheres are large biomolecular structures with an average diameter of 22 nm. The colloidal gold used for the colloidal gold assay is 20 nm. The sizes of the most detected molecules and particles by the SPR peak-shift method are much smaller than the noble metal nanoparticles used for detection because localized surface plasmonic effects rapidly decay in distance [18]. It is assumed that the colloidal gold assay only detects the surface monolayer of proteins of the colloidal spheres as a result. This assumption is also based on research that suggests that the colloidal gold nanoparticles are most sensitive closer to their surface [5].
3. Results
3.1. Spectroscopic Analysis of Colloids
Protein colloids are an important intermediate in amyloid fiber formation. A spectroscopic method for a fast and quantitative analysis of the diameter of the colloids is developed. This method is based upon two different protein concentration assays, namely surface protein plasmon concentration assay (colloidal gold assay) and OD 280. The OD 280 absorption assay was conducted to measure the total protein concentration of the solution. The surface plasmon protein concentration assay measures the surface protein concentration of the colloids in solution. The difference between the protein concentrations determined by the two methods allows for the analysis of the internal protein concentration of the protein colloids. Using this information, the average radius of the colloidal spheres was extracted mathematically. Alternatively, the DC protein assay can be used instead of the colloidal gold assay to obtain the surface protein concentration of the protein colloids within the supernatant as well.
3.2. Importance of Size of Colloidal Gold and Sensitivity of Assay
The colloidal gold nanoparticles that were synthesized from bulk material are shown in Figure 1(A). The size of the gold nanoparticles is roughly 20 nm in diameter. It is important to use colloidal gold solution without aggregation, so colloidal gold nanoparticles bind to lysozyme particles in solution at pH 3.0. The sizes of the gold nanoparticles are of particular importance for the success of the quantification technique. Quantitative analysis has shown that labeling density is inversely proportional to the size of the gold nanoparticles. Protein-gold probes with small gold particles have high sensitivity [19]. Therefore, larger spherical nanoparticles may result in less sensitivity of the assay. This can be quite useful because only surface proteins are of interest when conducting this assay. Protein colloidal form is not significantly influenced when colloidal gold interacts with the protein colloids.
3.3. Colloidal Gold and Changes in Localized Surface Plasmon Resonance
Colloidal gold absorbs photons with a maximum absorbance at 595 nm. Binding of protein to the colloidal gold causes a shift of the peak by roughly 10 nm per 300 ng/ml. The absorbance is also proportional to the amount of protein added to the assay. In a pH 3.0 of acidic solution, proteins carry positive charges and facilitate binding to the negatively charged colloids.
Figure 1(B) demonstrates the successful spectrum shift induced by various binding events between several monomeric lysozyme proteins and colloidal gold nanoparticles as LSPR is altered. This shows a different perspective of the typical calibration curve often seen containing absorbance versus concentration of proteins. There is noticeable peak shift and amplitude increase as more lysozyme sample is added. A linear function can be extracted using the observable differences in light absorbance. This linear function of absorbance versus concentration of proteins is of most importance when measuring protein concentrations of various samples. It is imperative to obtain a calibration curve that is as linear as possible for more reliable protein concentration measurement results.
3.4. Difference between Two Assays Reveals Internal Proteins
Five lysozyme samples were prepared Figure 1(C) at 10 mg/ml, 0.01 N HCl, pH = 2.0, 55˚C, were incubated for 2, 9, 14, 29 and 30 days and the supernatant protein concentrations tested using absorbance OD 280 and colloidal gold assays. The protein concentration difference measured in these two assays reflects the average internal protein concentration of the colloidal spheres within the supernatant. Additionally, the OD 280 and DC protein assays were conducted on Day 30 samples. The average internal protein concentration was determined through the difference between these two assays as well.
3.5. Formation of Nucleation Units and Fibers
During amyloid fiber formation Figure 3(B), proteins misbehave and begin to form clusters known as nucleation units. This is due to due to the surface energy minimization process of protein aggregation. Eventually, fibers are formed due to integrative dipole moments [1]. The accelerated conditions of amyloid fiber formation are the result of the pH 2.0 and 55˚C conditions.
3.6. TEM of Lysozyme Fibers
The lysozyme nucleation units form the fibers seen in
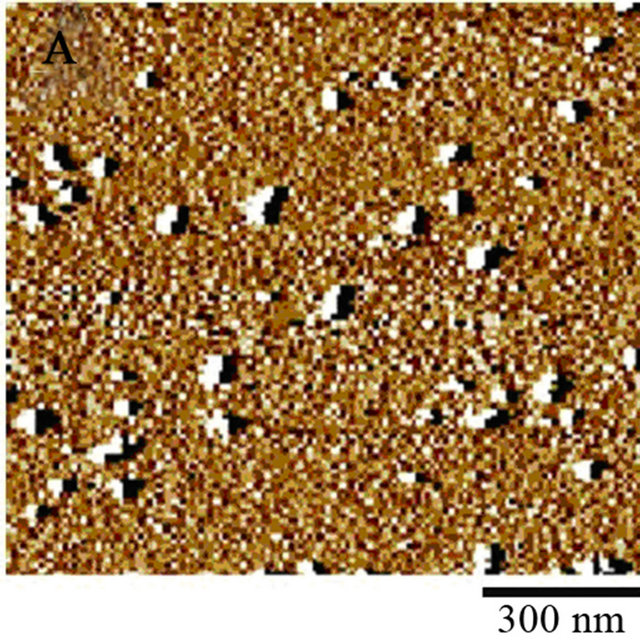
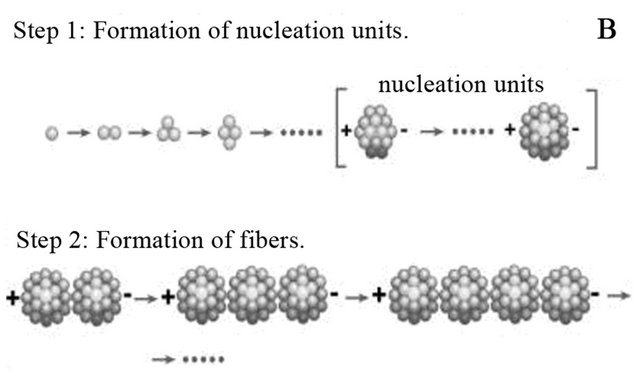
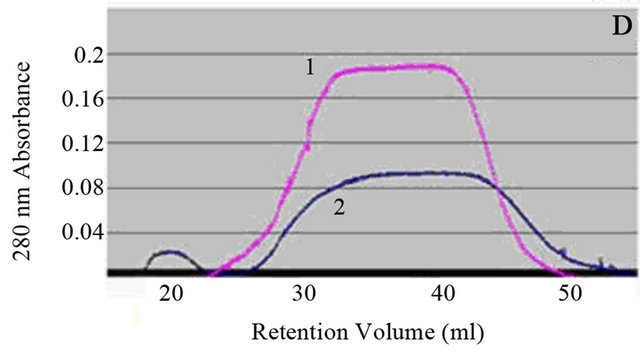
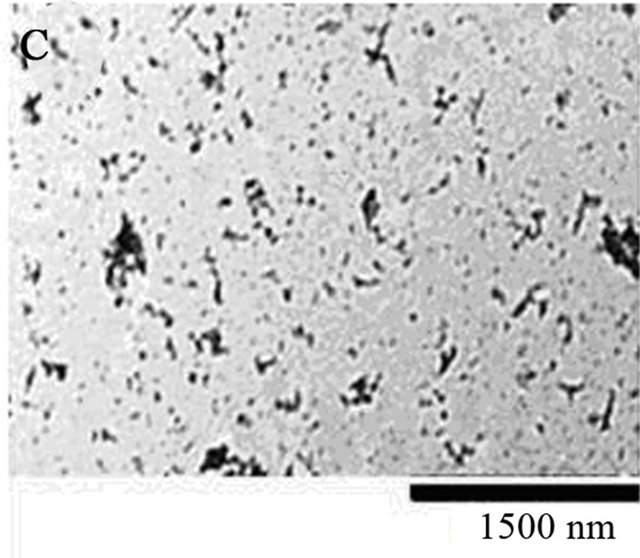
Figure 3. (A) Image of supernatant of fiber reaction of Day 14, 10 mg/ml, pH 2.0. Sample was diluted 10,000 fold from 10 mg/ml using DI water. 10 µl of sample was administered to a mica surface that had been rinsed with 10 µl 0.1 N NaOH. The slide was rinsed with 1 ml of water and allowed to dry overnight. Large and small spheres are identified from supernatant post centrifugation. Generally, there is an overwhelming presence of colloidal spheres. Colloids are 30 nm in width. (B) Model for fiber formation. Driven by surface energy minimization, proteins aggregate to form colloidal spheres, which in turn can aggregate further. The presence of an intrinsic dipole moment in the spheres alters the preferred aggregation pattern of the colloids from fractal (branched chain) patterns or amorphous clusters to linear chains [13]. (C) 10 µl of 30 days incubated lysozyme at initial concentration of 20 mg/ml was placed on a copper TEM grid. Fibrous material is present within the supernatant as a result of the amyloid fiber formation process. (D) Size exclusion chromatography for separation of lysozyme aggregates. The pink peak shows 0 day incubation of 20 mg/ml lysozyme, which means only lysozyme monomers exist in the original solution. The blue peaks represent 15 days of incubated 20 mg/ml lysozyme sample. Mostly homogenous protein colloids came out from the column first, creating the first peak; monomers occupied the second peak.
Figure 3(C). The process of amyloid fiber formation can be quite rapid or quite slow, depending on the environmental conditions such as solution pH, chemical constituents, and temperature. After 30 days, there is a measurable amount of fibers formed via the aggregation process. The denaturing conditions used to expedite the aggregation process worked quite well.
3.7. Protein Colloids Detected in Supernatant
The fibrous material created through the denaturing process was centrifuged for supernatant extraction. Atomic force microscopy of the supernatant of incubated lysozyme reveals colloids free from fibrous influence Figure 3(A), as most of the fibers migrated to the bottom of the micro-centrifuge tube. Apparent protein colloidal width is 30 nm for the 10 mg/ml Day 14 sample. This is in agreement with the protein colloidal radius displayed in Table 3 for Day 14. It is important to reduce the amount of compression of your sample when conducting AFM imaging [20].
3.8. FPLC of Supernatant to Determine Free Monomers
Proteins are suspended within the supernatant as well. This has been addressed through the use of FPLC to determine a mathematical value for the number of free noncolloidal proteins within the supernatant after a period of incubation. From the graph in Figure 3(D), it is possible to determine roughly how many free proteins there are in the supernatant. This consideration allows for a more accurate understanding of the true internal protein concentration within the lysozyme protein colloidal spheres. As a result, it is assumed that 5% of the proteins detected within the supernatant are in colloidal form.
3.9. Analysis of Colloidal Sphere Radius
The noticeable difference in protein concentrations between the OD 280 assay and colloidal gold assay indicate that one of the assays is not detecting all of the proteins within the colloids. Specifically, the colloidal gold assay, because the protein concentration values are always low-
Table 1. Colloidal gold assay and OD 280 assay for analysis of colloidal sphere radius. Lysozyme samples were prepared at 10 mg/ml, 0.01 N HCl, pH = 2.0, 55˚C, were incubated for 2, 9, 14, 29 and 30 days. The supernatant protein concentrations were tested using absorbance OD 280 and colloidal gold assays. Protein concentrations in the supernatant were determined using OD 280 and colloidal gold assay for reactions with different starting lysozyme concentrations. This allows the calculation for the amount of proteins interior and on the surface of the protein colloids and then the calculation of the radius of the colloids. Table 1 displays monomer and colloidal protein concentrations discovered within the supernatant.
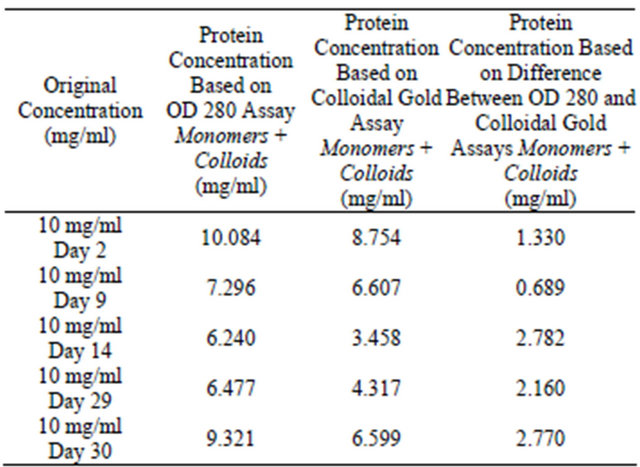
Table 2. Colloidal gold assay and OD 280 assay for analysis of colloidal sphere radius. 95% of monomers have been mathematically removed from the supernatant.
er than OD 280 protein concentration values.
In Tables 1 and 2, the total protein concentration detected for the 10 mg/ml samples appears to suddenly increase after Day 14. This is quite common as aggregation kinetics are vastly different between each Eppendorf tube.
As seen in Tables 1-3, after 2, 9, 14, 29 and 30 days of incubation, protein concentrations in the supernatant were determined using the OD 280 and colloidal gold
Table 3. Colloidal gold assay and OD 280 assay for analysis of colloidal sphere radius. After inputting the data from Table 2 into the colloidal sphere radius equation, the radius of the protein colloids was calculated.
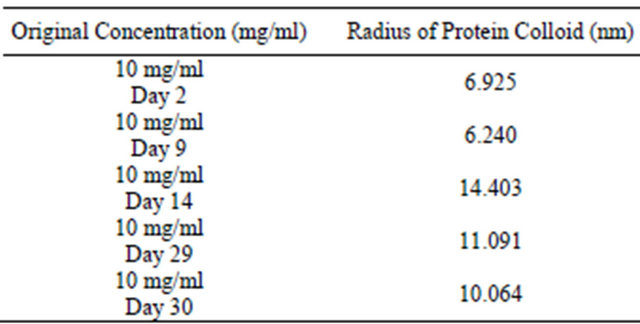
assay from initial starting concentrations of 10 mg/ml. The amount of proteins interior and on the surface of the protein colloids were determined allowing for the calculation of the radius of the colloids. Upon referral to Table 3, the protein colloidal diameter is notably small until an abrupt change at Day 14. After Day 14, colloidal diameter remains relatively large. An apparent transition time exists from when lysozyme monomers aggregate into larger lysozyme protein colloids. Lysozyme diameter is roughly 3.4 nm, therefore, a 6.5 nm average radius is practical during the initial aggregation process.
Tables 4-6 demonstrate that the same method can be performed using different initial starting concentrations. The amount of lysozyme does not have an effect on protein colloidal sphere radius. Additional data, as seen in Tables 7-9, was collected by substituting the colloidal gold assay with the DC protein assay. Surprisingly, the DC protein assay was highly efficient in measuring surface protein concentration. Only Day 30 supernatant protein concentrations were analyzed using the DC protein assay.
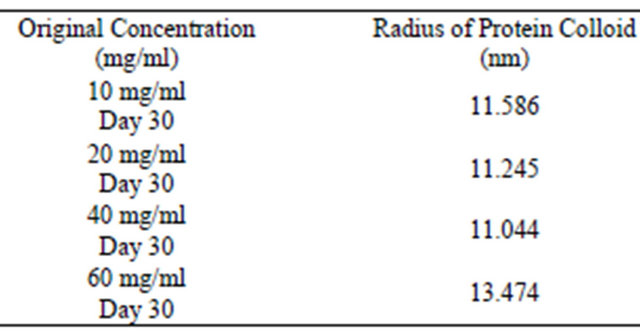
Table 9 demonstrates that the method to calculate colloidal sphere radius using the DC protein assay is extremely effective. All of the data collected using this assay had very little variability in that most of the calculations yielded radius values very close to 11.8 nm. Different protein concentrations did not have any effect on the resulting radius calculations.
Colloidal sphere radius has been determined to range from 6.5 nm to 14 nm using the colloidal gold assay. Generally, the average radius is 11.5 nm for 30 day samples.
3.10. Using Lower Protein Concentrations
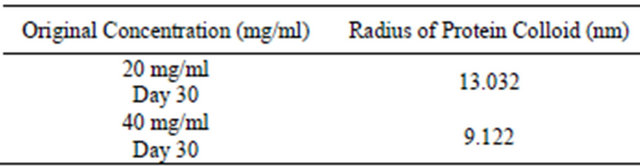
It is also important to note that the turbidity increases with increasing protein concentrations [21]. Conducting these assays using higher concentrations requires more attention to detail in dilution preparation. It is advisable to use lower concentrations such as 10 mg/ml for colloidTable 4. Colloidal gold assay and OD 280 assay for analysis of colloidal sphere radius. Two lysozyme samples were prepared at 20 mg/ml, 40 mg/ml, 0.01 N HCl, pH = 2.0, 55˚C, were incubated for 30 days and the supernatant protein concentrations tested using absorbance OD 280 and colloidal gold assays. Table 4 displays monomer and colloidal protein concentrations discovered within supernatant.
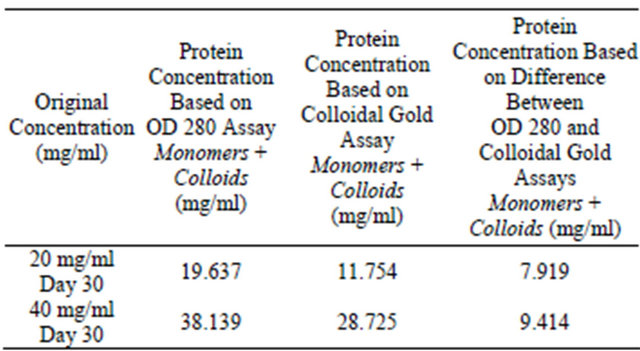
Table 5. Colloidal gold assay and OD 280 assay for analysis of colloidal sphere radius. Two lysozyme samples were prepared at 20 mg/ml, 40 mg/ml, 0.01 N HCl, pH = 2.0, 55˚C, were incubated for 30 days and the supernatant protein concentrations tested using absorbance OD 280 and colloidal gold assays. 95% of monomers have been mathematically removed from the supernatant.
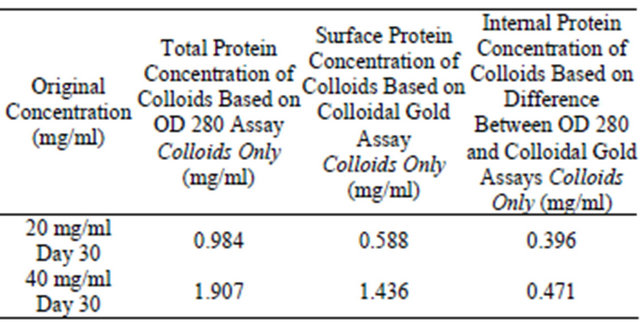
Table 6. Colloidal gold assay and OD 280 assay for analysis of colloidal sphere radius. After inputting the data from Table 5 into the colloidal sphere radius equation, the radius of the protein colloids is determined.
dal sphere analysis for increased accuracy and precision of results.
4. Discussion
The unique optical properties of colloidal gold nanoparticles have allowed for a new method to determine protein colloidal diameter. SPR peak shifts were measured when the gold probes adhered to the surface of the lysozyme colloids. These peak shifts labeled the surface
Table 7. DC protein assay and OD 280 assay for analysis of colloidal sphere radius. Four lysozyme samples were prepared at 10 mg/ml, 20 mg/ml, 40 mg/ml, and 60 mg/ml, 0.01 N HCl, pH = 2.0, 55˚C, were incubated for 30 days and the supernatant protein concentrations tested using absorbance OD 280 and DC protein assays. Table 7 displays monomer and colloidal protein concentrations discovered within the supernatant.
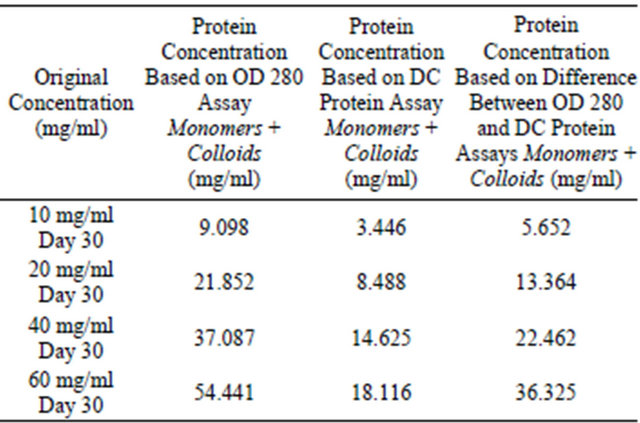
Table 8. DC protein assay and OD 280 assay for analysis of colloidal sphere radius. Four lysozyme samples were prepared at 10 mg/ml, 20 mg/ml, 40 mg/ml, and 60 mg/ml, 0.01 N HCl, pH = 2.0, 55˚C, were incubated for 30 days and the supernatant protein concentrations tested using absorbance OD 280 and DC protein assays. 95% of the monomers have been mathematically removed from the supernatant.
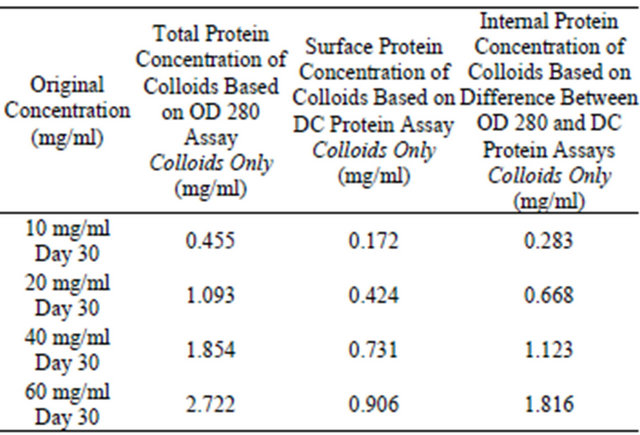
Table 9. DC protein assay and OD 280 assay for analysis of colloidal sphere radius. After inputting the data from Table 8 into the colloidal sphere radius equation, the radius of the protein colloids is determined as well using the DC protein assay instead of the colloidal gold assay.
 protein concentration of the protein colloids within the supernatant. The total protein concentration of the supernatant was measured using OD 280. Using the resulting information, internal protein concentration was conceived and an equation suitable was developed to calculate the average radius of colloids.
Average radius of the colloids was measured and calculated yielding 11.5 nm for the colloidal gold assay and 11.8 nm for the DC protein assay. This is in agreement with previous analysis of lysozyme colloidal spheres formed via the amyloid fiber formation process. The exact mechanism for direct measurement of surface protein concentration using the colloidal gold assay can perhaps be attributed to the size of the gold nanoparticles in relation to the large size of the lysozyme colloids and the inherent nature of the exponentially diminishing quality of gold nanoprobe sensitivity from their surface. The interior proteins of the lysozyme colloids do not interact with the first few layers of colloidal gold nanoparticles in the same manner as the surface proteins adhered to the metal surface of the nanoparticles. If the lysozyme protiens are in non-colloidal form, they mostly adhere to the surface of the colloidal gold nanoparticles generating large perturbations in the LSPR resulting in observable peak shifts. The sensitivity diminishes exponentially away from the nanoparticle. This can lead to an underrepresentation of interior protein mass of the colloidal spheres. Additionally, sensitivity of nanostructures decreases as mass bound to the surface increases [22].
Another important consideration is the spacing between the surfaces of the metallic nanoparticles. At such small gaps, strong electromagnetic coupling has been found to account for many interesting optical phenomena, including tight light confinement at the junctions of nanoparticles [23]. As a nanoparticle is brought closer to the surface of a nanoparticle, strong optical fields are induced inside of the gap causing a red peak shift and a field enhancement. This field enhancement exhibits a power law dependence on particle-nanostructure gaps, which is an effect related to the Casimir effect and not well understood [23]. Controlled lateral spacing between GNP on a sensor surface, ie, mesospacing, plays a vital role for precise control of the sensor performance. Interparticle spacing affects the sensitivity and the electric field distribution around the nanoparticles [5]. When this is taken into consideration, it is not well understood how these gaps change when using large colloidal spheres as opposed to small proteins.
The colloidal gold assay, DC protein assay, and OD 280 assay can be used to quantify the size of the protein colloids. The colloidal gold assay is effective in analysis of surface protein concentration in protein colloids. The DC protein assay is even more effective in analysis of surface protein concentration in that the results are more precise. This assay could simply have worked more efficiently due to the size of the copper nanoparticles being used.
New bio-sensing methods have been developed to effectively measure the diameter of lysozyme colloidal spheres formed through lysozyme protein aggregation. These bioassays have the potential to give rise to a wealth of useful applications in several fields of science and technology. The colloidal gold assay, DC protein assay, and OD 280 assay allow for large scale data analysis of lysozyme colloidal sphere size.
5. Acknowledgements
This research was supported by NASA, IHA, and the Community Foundation for Brevard. We owe our sincere thanks to Daniel Woodard, M. D. (NASA Kennedy Space Center) for his instruction on AFM techniques, FPLC, and the behavior of colloidal particles.
REFERENCES
- S. Xu, “Aggregation Drives ‘Misfolding’ in Protein Amyloid Fiber Formation,” Amyloid, Vol. 14, No. 2, 2007, pp. 119-131. doi:10.1080/13506120701260059
- T. H. L. Nghiem, T. H. La, X. H. Vu, V. H. Chu, T. H. Nguyen, Q. H. Le, E. Fort, Q. H. Do and H. N. Tran, “Synthesis, Capping and Binding of Colloidal Gold Nanoparticles to Proteins,” Advances in Natural Sciences: Nanoscience and Nanotechnology, Vol. 1, No. 2, 2010, Article ID: 025009.
- J. Cardinal, J. R. Klune, E. Chory, G. Jeyabalan, J. S. Kanzius, M. Nalesnik and D. A. Geller, “Noninvasive Radiofrequency Ablation of Cancer Targeted by Gold Nanoparticles,” Surgery, Vol. 144, No. 2, 2008, pp. 125- 132. doi:10.1016/j.surg.2008.03.036
- T. Lai, Q. Hou, H. Yang, X. Luo and M. Xi, “Clinical Application of a Novel Silver Nanoparticles Biosensor Based on Localized Surface Plasmon Resonance for Dentecting the Microalbuminuria,” Acta Biochimica et Biophysica Sinica, Vol. 42, No. 11, 2010, pp. 787-792. doi:10.1093/abbs/gmq085
- J. Satija, R. Bharadwaj, V. V. R. Sai, et al., “Emerging Use of Nanostructure Films Containing Capped Gold Nano particles in Biosensors,” Nanotechnology, Science and Applications, Vol. 2010, No. 3, 2010, pp. 171-188.
- O. Lowry, N. J. Rosebrough, A. L. Farr and R. J. Randall, “Protein Measurement with the Folin Phenol Reagent,” Journal of Biological Chemistry, Vol. 193, No. 1, 1951, pp. 265-275.
- J. Bradley, “Amyloid Fiber Formation in Hen Lysozyme,” Dissertation, University College Dublin, Dublin, 2007.
- S. Eustis and M. A. El-Say, “Why Gold Nanoparticles Are More Precious than Pretty Gold: Noble Metal Surface Plasmon Resonance and Its Enhancement of the Radiative and Nonradiative Properties of Nanocrystals of Different Shapes,” Chemical Society Reviews, Vol. 35, No. 3, 2006, pp. 209-217. doi:10.1039/b514191e
- L. H. Haber, S. J. J. Kwok, M. Semeraro and K. B. Eisenthal, “Probing the Colloidal Gold Nanoparticle/Aqueous Interface with Second Harmonic Generation,” Chemical Physical Letters, Vol. 506, No. 1-3, 2011, pp. 11-14. doi:10.1016/j.cplett.2011.03.042
- Bio-Rad, “DC Protein Assay Instruction Manual”. http://www.biorad.com/LifeScience/pdf/Bulletin_9005.pdf
- R. Cegielska-Radziejewska, G. Lesnierowski and J. Kijowski, “Properties and Application of Egg White Lysozyme and Its Modified Preparations—A Review,” Polish Journal of Food and Nutrition Sciences, Vol. 58, No. 1, 2008, pp. 5-10.
- X. Huang, S. Neretina and M. A. El-Sayed, “Gold Nanorods: From Synthesis and Properties to Biological and Biomedical Applications,” Advanced Materials, Vol. 21, No. 48, 2009, pp. 4880-4910. doi:10.1002/adma.200802789
- E. Hutter and J. H. Fendler, “Exploitation of Localized Surface Plasmon Resonance,” Advanced Materials, Vol. 16, No. 19, 2004, pp. 1605-1706. doi:10.1002/adma.200400271
- T. Chung, S. Lee, E. Y. Song, H. Chun and B. Lee, “Plasmonic Nanostructures for Nano-Scale Bio-Sensing,” Sensors, Vol. 11, No. 11, 2011, pp. 10907-10929. doi:10.3390/s111110907
- J. Mitchell, “Small Molecule Immunosensing Using Surface Plasmon Resonance,” Sensors, Vol. 10, No. 8, 2010, pp. 7323-7346. doi:10.3390/s100807323
- S. Ghosh and T. Pal, “Interparticle Coupling Effect on the Surface Plasmon Resonance of Gold Nanoparticles: From Theory to Applications,” Chemical Reviews, Vol. 107, No. 11, 2007, pp. 4797-4862. doi:10.1021/cr0680282
- M. Nakkach, P. Lecaruyer, F. Bardin, J. Sakly, Z. B. Lakhdar and M. Canva, “Absorption and Related Optical Dispersion Effects on the Spectral Response of a Surface Plasmon Resonance Sensor,” Applied Optics, Vol. 47, No. 33, 2008, pp. 6177-6182. doi:10.1364/AO.47.006177
- Q. Li, Z. Zhang, S. Haque, M. Zhang and L. Xia, “Localized Surface Plasmon Resonance Effects by Naturally Occurring Chinese Yam Particles,” Journal of Applied Physics, Vol. 108, No. 12, 2010. doi:10.1063/1.3520667
- S. Yakota, “Effect of Particle Size on Labeling Density for Catalase in Protein A-Gold Immunocytochemistry,” Journal of Histochemistry and Cytochemistry, Vol. 36. No. 1, 1988, pp. 107-109. doi:10.1177/36.1.3335766
- S. Xu and M. F. Arnsdorf, “Calibration of the Scanning Atomic Force Microscope with Gold Particles,” Journal of Microscopy, Vol. 173, No. 3, 1994, pp. 199-210.
- W. Wang and C. J. Roberts, “Aggregation of Therapeutic Proteins,” John Wiley & Sons, Inc., Hoboken, 2010. doi:10.1002/9780470769829
- B. Brian, B. Sepulveda, Y. Alaverdyan, L. M. Lechuga and M. Kall, “Sensitivity Enhancement of Nanoplasmonic Sensors in Low Refractive Index Substrates,” Optics Express, Vol. 17, No. 3, 2015, pp. 2015-2023.
- F. M. Huan, D. Wilding, J. D. Speed, A. E. Russell, P. N. Bartlett and J. J. Baumbe, “Dressing Plasmons in Particle-in-Cavity Architechtures,” Nano Letters, Vol. 11, No. 3, 2010, pp. 1221-1226.