Open Journal of Metal
Vol.3 No.3(2013), Article ID:37033,5 pages DOI:10.4236/ojmetal.2013.33007
Transport Properties of Ni-Nb-Zr Glassy Alloys and Hydrogen Absorbed Alloys
1Institute for Materials Research, Tohoku University, Sendai, Japan
2Research Institute for Electromagnetic Materials, Sendai, Japan
3Institute for Nanoscience & Nanotechnology, Waseda University, Tokyo, Japan
Email: rieume@imr.tohoku.ac.jp, h-yoshida@bd.wakwak.com, fukuhara@cd.wakwak.com, yamaura@imr.tohoku.ac.jp, t.sasaki3@kurenai.waseda.jp, t-sekiguchi@waseda.jp, mikiko@waseda.jp, mizuno@waseda.jp, kawarada@waseda.jp
Copyright © 2013 Rie Y. Umetsu et al. This is an open access article distributed under the Creative Commons Attribution License, which permits unrestricted use, distribution, and reproduction in any medium, provided the original work is properly cited.
Received July 12, 2013; revised August 12, 2013; accepted August 20, 2013
Keywords: Electrical resistivity; Amorphous alloy ribbon; Hydrogen absorption
ABSTRACT
The electrical transport properties of (Ni0.8Nb0.2)100−xZrx (x = 30, 40 and 50) amorphous ribbons and hydrogen charged specimens were investigated. The amorphous ribbons indicated a negative coefficient in the temperature dependence of their electrical resistivity as well as the typical transport properties of the amorphous alloys with comparatively high values of electrical resistivity, ρ. The normalized temperature coefficient of the resistivity (TCR ≡ 1/ρ300K∙dρ/dT) tended to increase with increasing x in the temperature range of 100 - 300 K. These behaviors would suggest that the transport properties of the present amorphous ribbons were governed by temperature variation of the Debye-Waller factor, not by electron-phonon scattering. The hydrogen charged ribbons obtained by an electrochemical method also showed similar electrical resistivity behaviors as a function of the temperature. However, TCR of x = 40 with hydrogen charged ribbon, in which the amount of absorbed hydrogen was about 14 at%, increased about three times more than that of the pre-charged amorphous ribbon.
1. Introduction
Ni-Nb-Zr ternary alloys have been known to form a glassy or amorphous phase over a wide concentration region [1], that is, amorphous alloys can be obtained in the composition range of 20 to 75 at% Ni, 0 to 60 at% Nb and 0 to 80 at% Zr. Glassy alloys are also fabricated in a certain composition range, i.e., 50 to 70 at% Ni, 5 to 35 at% Nb and 5 to 45 at% Zr, and it has been reported that the largest value of the supercooled liquid region is about 50 K for Ni60Nb20Zr20 [1]. Yamaura et al. have reported that melt-spun amorphous (Ni0.6Nb0.4)70Zr30 alloy exhibits excellent hydrogen permeability of about 1.3 × 10⁻⁸ mol/m-s-Pa1/2 at 673 K [2]. The influence of hydrogen charging on mechanical properties of these ribbons has also been investigated, and it has been reported that the Vickers hardness gradually increases with increasing hydrogen content up to about 27 at% [3]. Recently, Fukuhara et al. have found interesting electrical transport properties in hydrogen absorbed [(Ni0.6Nb0.4)1−x/100Zrx/100]100−yHy (30 < x < 50, 0 < y < 20) amorphous ribbons such as superconductivity, electron avalanche behavior and the Coulomb-blockade oscillations [4,5]. They stressed that localization effect of the hydrogen in the outside and inside space of the distorted icosahedral Zr5Ni5Nb3 clusters plays important roles in their various electrical transport properties. In the present study, we fabricated (Ni0.8Nb0.2)100−xZrx (x = 30, 40 and 50) amorphous alloys, in which the ratio between the Ni and Nb was different from that in the literature [4,5] and their hydrogen absorbed specimens by an electrochemical method. Furthermore, temperature dependence of the electrical resistivity was measured in temperature range of 6 - 300 K.
2. Experimental Procedure
Master ingots were prepared by arc melting in an argon atmosphere with appropriate amounts of Ni, Nb and Zr elements. Amorphous ribbons were made by a single roller melt-spinning technique in an argon atmosphere, in which the surface velocity of the copper wheel was about 50 m/s and the thickness and the width of the fabricated ribbons were about 25 μm and 1 mm, respectively. Hydrogen absorbed specimens were made by electrochemical charging in 0.5 M H2SO4 + 1.4 g/L thiourea (CH4N2S) at room temperature with a current density of about 40 A/m2 for 2 hours and the use of a Pt electrode. The amount of absorbed hydrogen was measured by an inert gas carrier melting-thermal conductivity method. The structure was examined by an X-ray diffractometer, XRD, with Cu-Κα radiation. Differential scanning calorimetry, DSC, measurements were performed at a heating rate of 20 K/min. Electrical resistivity was measured by the conventional four-probe method in the temperature region of 6 - 300 K at cooling and heating rates of about 1 K/min.
3. Results and Discussion
Figures 1(a) and (b) indicate XRD patterns for mother alloys and melt-spun ribbons, respectively, for (Ni0.8Nb0.2)100−xZrx (x = 30, 40 and 50) alloys. The peaks for x = 30, 40 and 50 in Figure 1(a) can be indexed as almost a single phase of the Zr7Ni10-type structure, a mixed phase of Zr7Ni10-type and ZrNi-type structures, and also a mixed phase of ZrNi-type and Zr2Ni-type structures, respectively, corresponding with the reported ternary phase diagram [6]. The patterns of x = 30, 40 and 50 in Figure 1(b) show halo-type, indicating an amorphous structure. The position of the largest peaks observed around 2 theta = 40 degree tends to shift to a smaller angle with increasing x, due to the increase of the Zr composition with an atomic radius larger than that of Ni.
The differential scanning calorimetry (DSC) heating curves of the melt-spun ribbons for x = 30, 40 and 50 in (Ni0.8Nb0.2)100−xZrx (x = 30, 40 and 50) are indicated in Figure 2. It is shown that the all three exhibit a glass transition below the crystallized temperature, TX, as indicated by closed arrows. The glass transition temperatures, Tg, for x = 30, 40 and 50 are about 807, 806 and 735 K, respectively, in good agreement with the results reported in the literature [1,2]. Although both Tg and TX for x = 50 are comparatively lower than that for x = 30 and 40, it should be noted that the constituent structures of the mother alloys are different from each other as shown in Figure 1(a), suggesting that the short-range order of the clusters may be different. In addition, x = 50 is located at the edge of the existing composition range of the glassy alloys in the nonequilibrium phase diagram [1], indicating that the stability of the glassy state will be low. The stability of the glassy state is often discussed by means of the difference between TX and Tg, ΔT = TX − Tg. The value of ΔT for x = 50 is smallest and that for x = 40 is largest among the three.
Figure 3 shows temperature dependence of the normalized electrical resistivity, ρ/ρ300K, for pre-charged

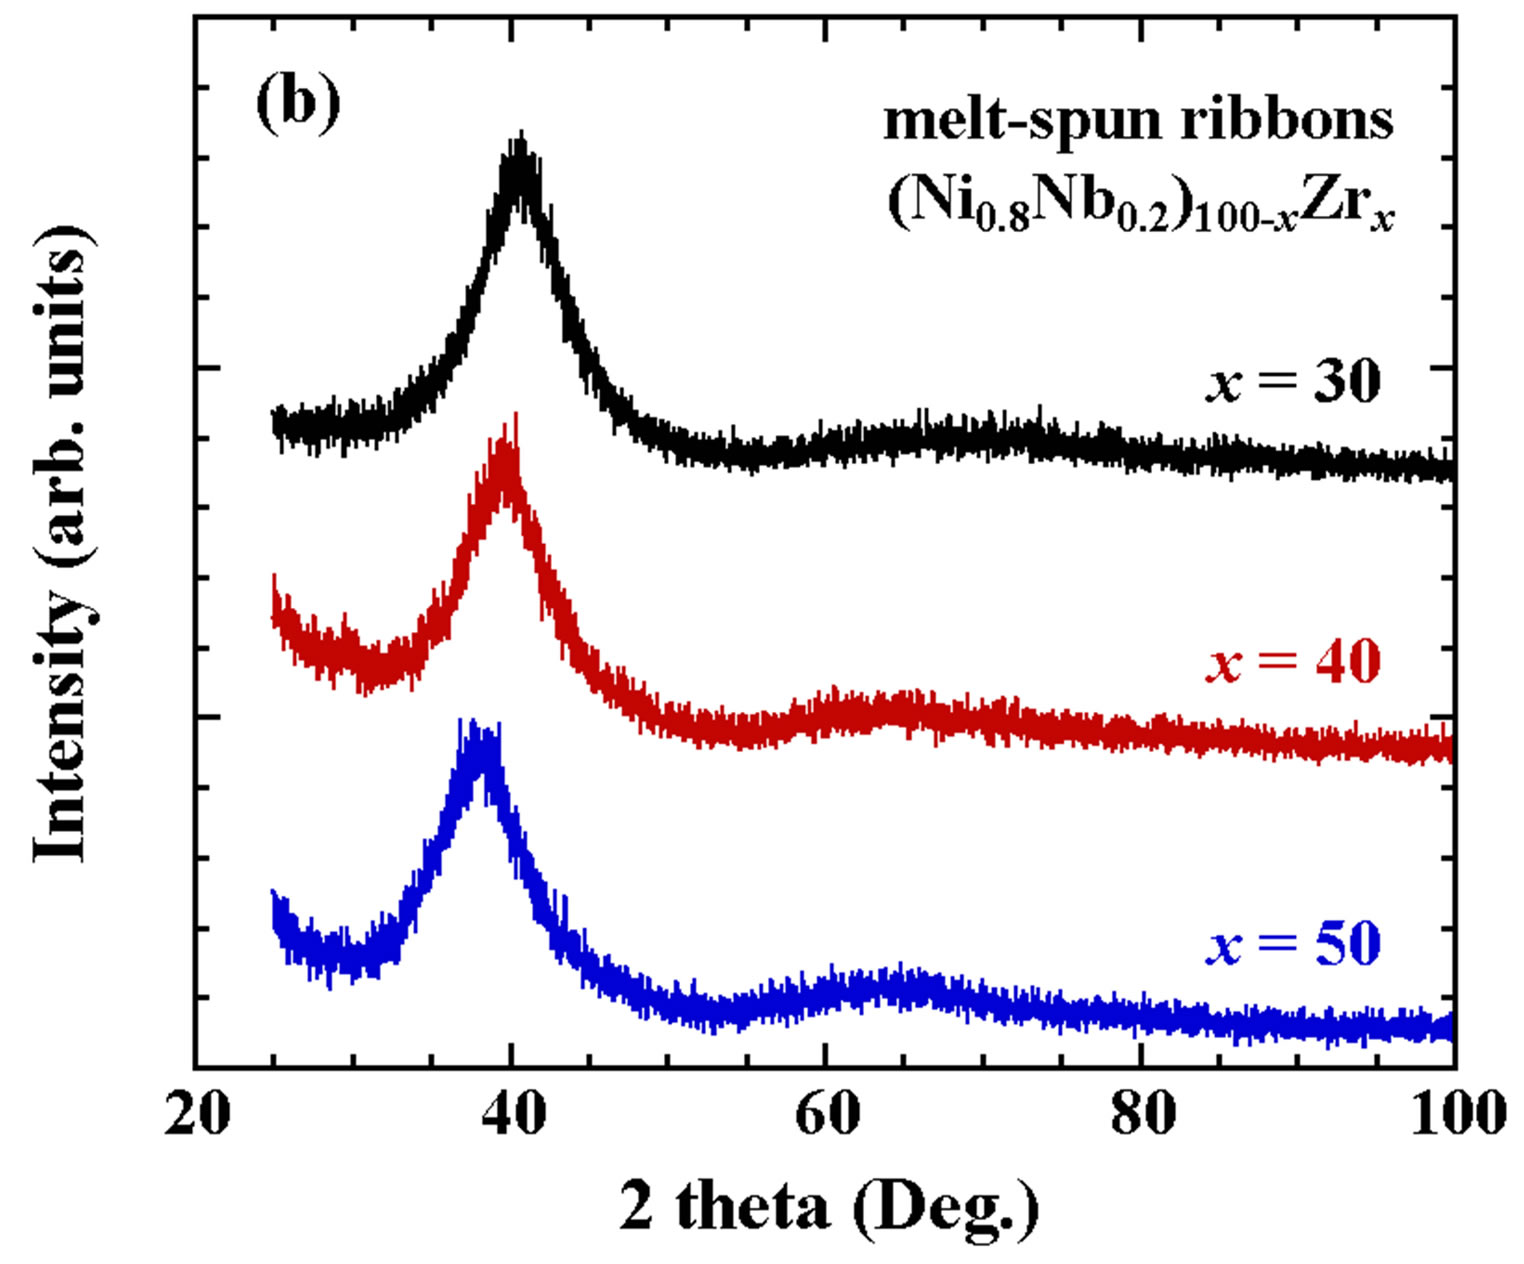
Figures 1. XRD patterns for the mother alloys (a) and meltspun ribbons (b) for (Ni0.8Nb0.2)100−xZrx (x = 30, 40 and 50).
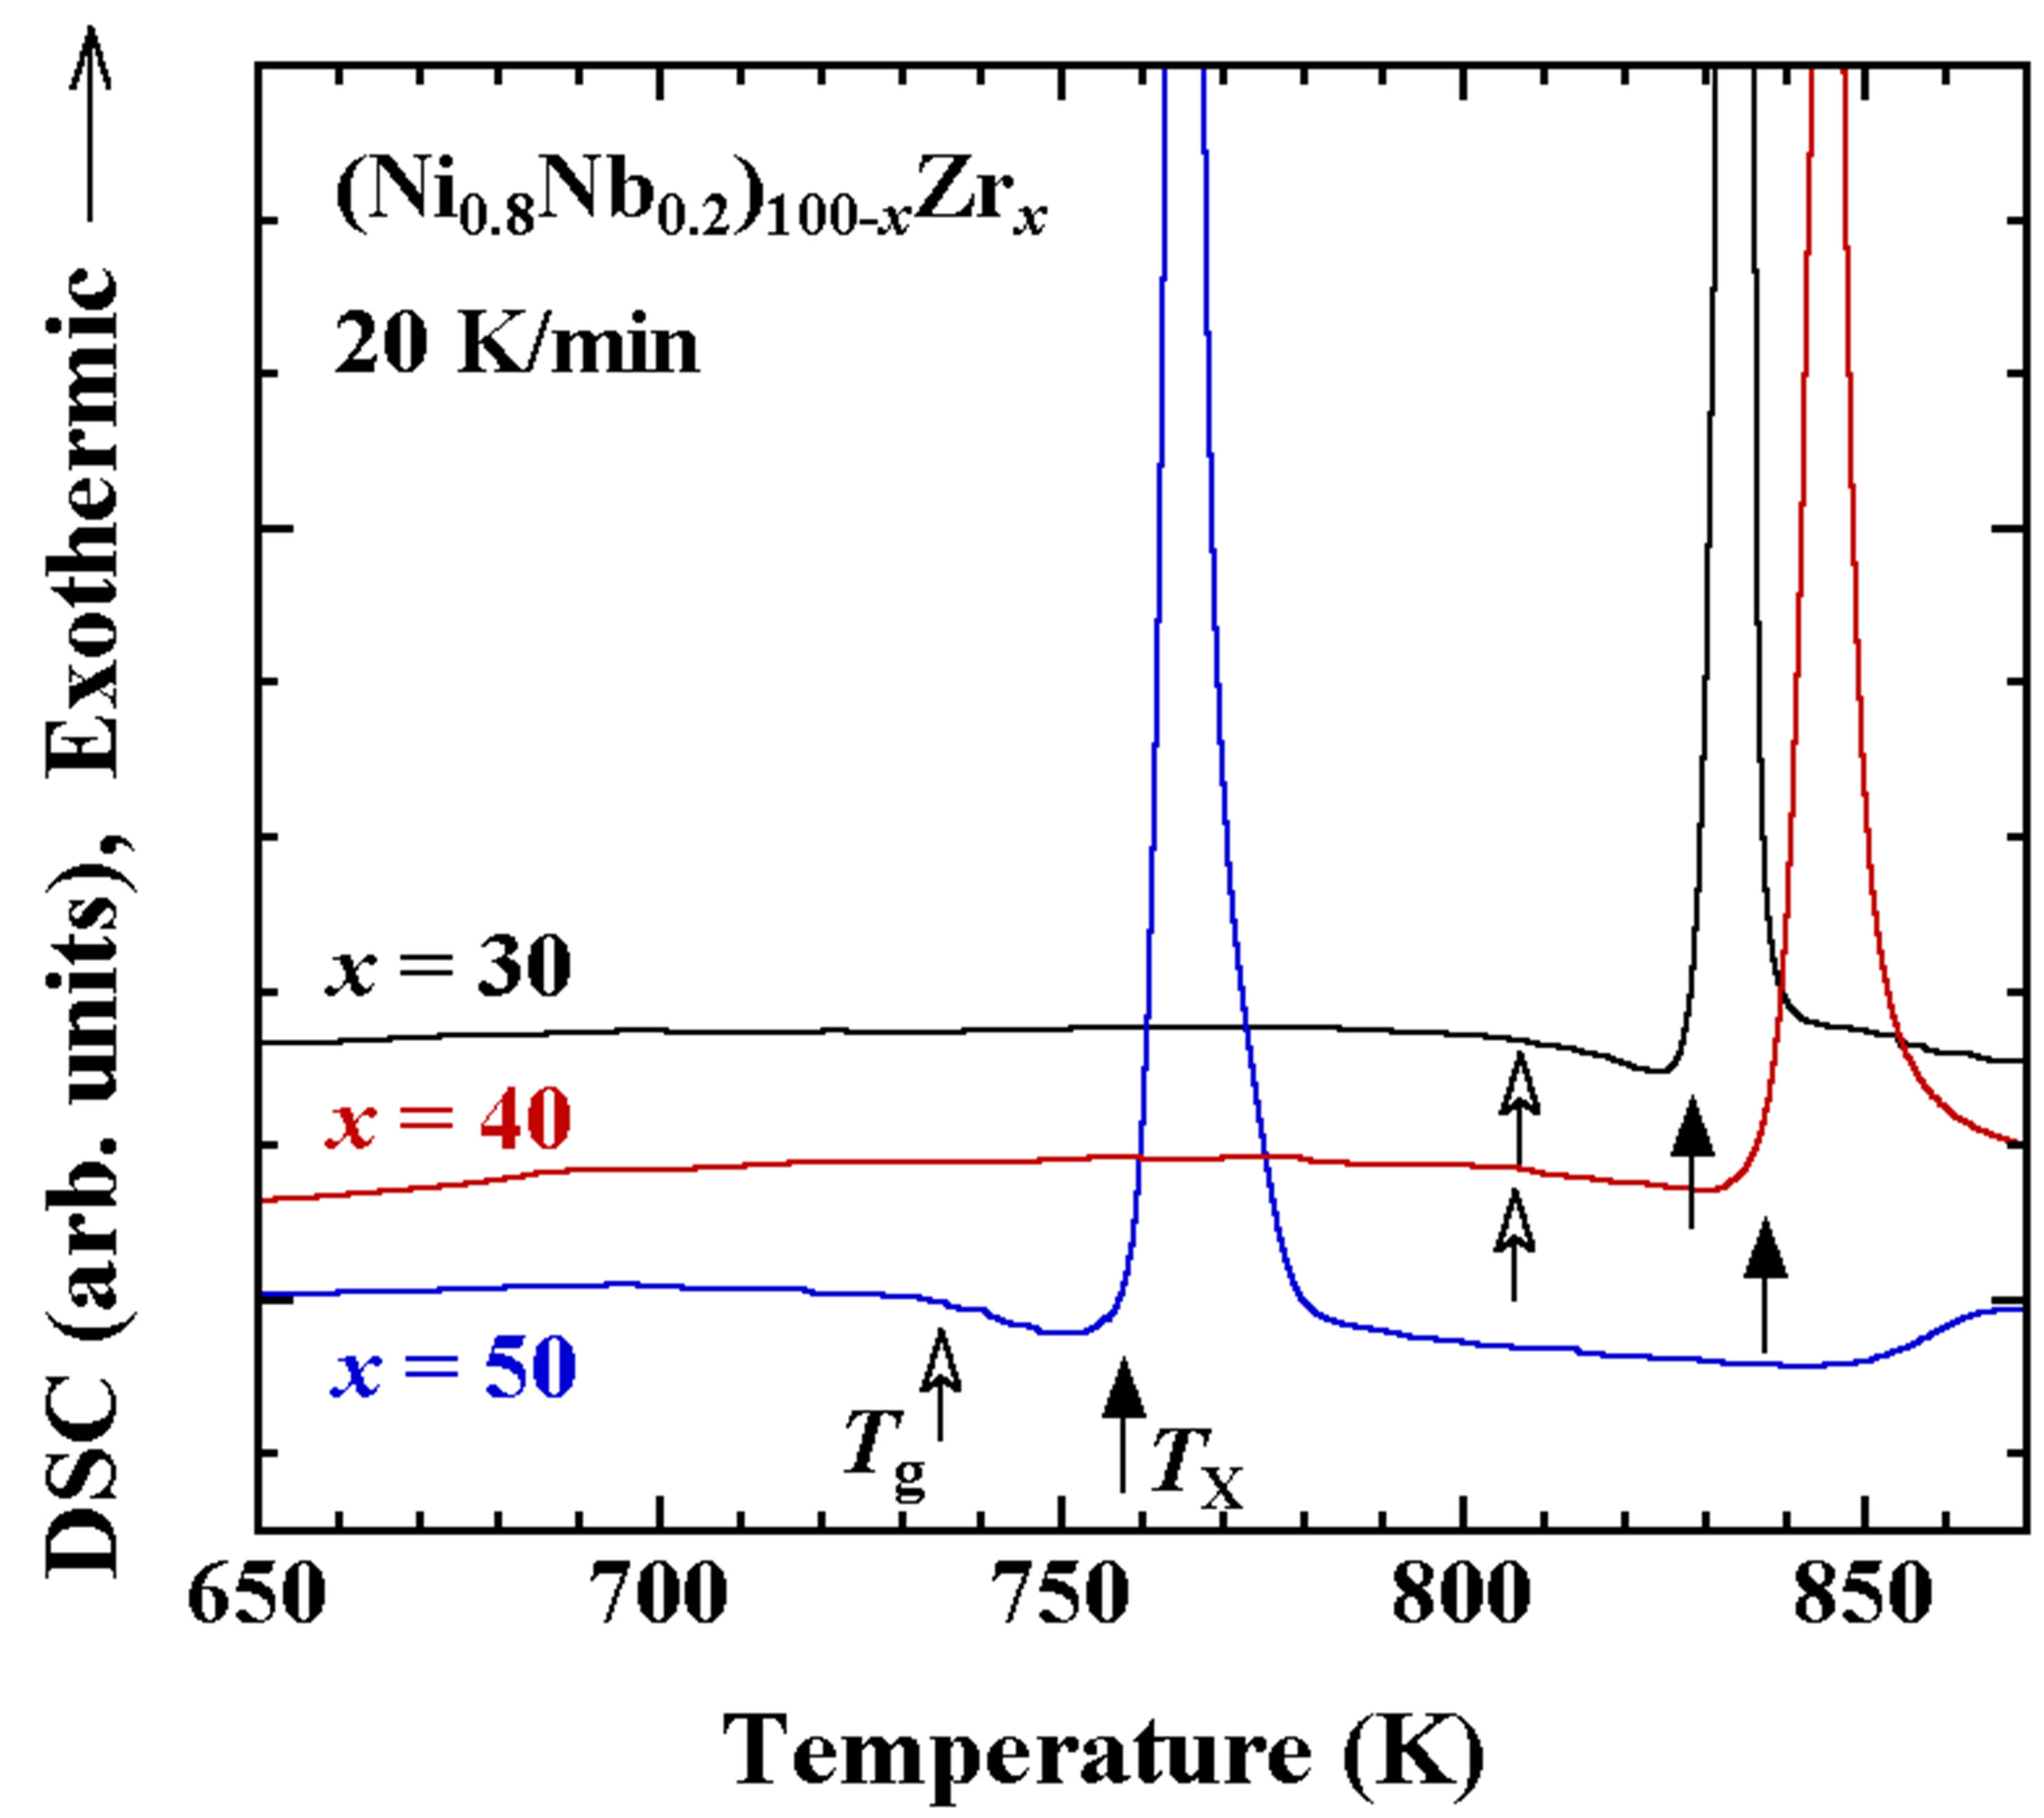
Figure 2. DSC heating curves for melt-spun ribbons of (Ni0.8Nb0.2)100−xZrx (x = 30, 40 and 50).
melt-spun ribbons for (Ni0.8Nb0.2)100−xZrx (x = 30, 40 and 50). The absolute values of electrical resistivity at room temperature for these specimens are comparatively high at about 330 - 350 μΩ·cm. A very weak temperature variation and a negative temperature coefficient of resistivity, TCR, are observed. These behaviors follow the Mooij’s empirical law for various amorphous alloys, that is, the materials with high value of electrical resistivity at
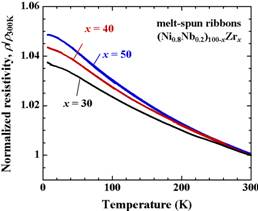
Figure 3. Temperature dependences of the normalized electrical resistivity for pre-charged melt-spun ribbons of (Ni0.8Nb0.2)100−xZrx (x = 30, 40 and 50).
room temperature (ρ > 150 μΩ·cm) tend to exhibit a negative TCR, whereas, those with low value (ρ < 150 μΩ·cm) show a positive TCR [7]. The obtained TCR in the temperature range of 100 - 300 K of the present ribbons of x = 30, 40 and 50 are −1.1, −1.3 and −1.4 × 10⁻⁴/K, respectively. The T-linear dependence of TCR slightly deviates in the low temperature range and exhibits T2-dependence. Various theoretical models for negative TCR have been predicted [8], the behaviors of TCR for the present specimens of (Ni0.8Nb0.2)100−xZrx (x = 30, 40 and 50) seem to follow the Baym-Meisel-Cote theory based on the Boltzmann transport equation [9]. In the model, temperature dependence of the electrical resistiveity with non-periodic crystal structure is denoted as follows [9,10],
 (1)
(1)
where, ρ0 is the residual resistivity, exp[−2W(T)] is the Debye-Waller factor, ρph is the phonon term, Λ is the mean free path and q is the wave vector. For the amorphous and quasi-crystals with non-periodic structure, Λ is small, and consequently the second term in Equation (1) is negligible. Therefore, the electrical resistivity is governed by the temperature dependence of the DebyeWaller factor not by the electron-phonon scattering. The content of the Debye-Waller factor, W is indicated as follows [11],
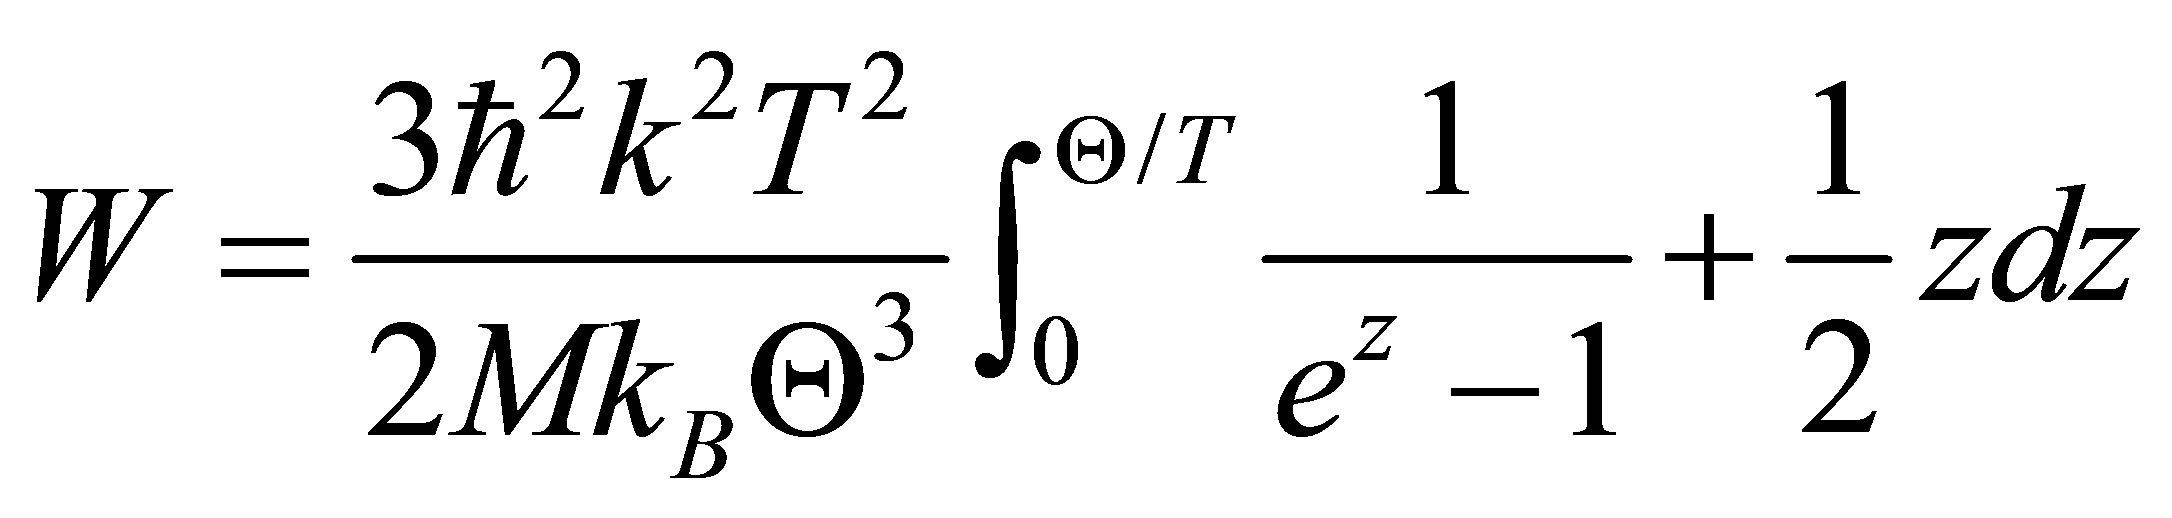 (2)
(2)
here, ħ, kB, M and Θ are the Plank’s constant, the Boltzmann constant, electron mass and the Debye temperature, respectively. In such case, the electrical resistivity shows T2-dependence in low temperature range and T-linear dependence in the temperature range above the Debye temperature [12,13]. Numerical values of the results of the DSC and electrical resistivity measurements are listed in Table 1. The absolute values of TCR tend to increase with increasing x. Although the reason of the behavior of the negative TCR can be understood from the equation (1), explanation of the change of the absolute value of TCR depending on the composition is somewhat difficult. Decreasing of W-value will bring about the increasing of the absolute value of TCR. Increasing of Zr content will raise the electron mass, on the other hand, will lower the Debye temperature under the assumption that the crystal structure does not so change. Because cube of the Debye temperature will contribute to W-value, the change of the Debye temperature is speculated to cause the different value of TCR.
The XRD patterns of the hydrogen charged melt-spun ribbons for (Ni0.8Nb0.2)100−xZrx (x = 30, 40 and 50) are indicated in Figure 4. All aspects of these patterns are similar to those of the pre-charged ribbons, as shown in Figure 1(b) while keeping the amorphous structure. The values of the absorbed hydrogen by the electrochemically method for x = 30, 40 and 50 are about 4.9, 13.8 and 2.5 at%, respectively. In the case of (Ni0.6Nb0.4)100−yZrx (0 ≤ y ≤ 40) amorphous ribbons, it has been reported that the hydrogen permeability increases with increasing y (Zr content) and has been discussed in connection with the enlargement of the atomic spacing [2]. The present case does not follow such behavior, the reason for the smaller amount of the absorbed hydrogen in the specimen with x = 50 than that in the specimen with x = 40 has not been clarified. There may be certain factors that affect sensitivity the amount of absorbed hydrogen, the difference of the composition, the state of the short-range order, the kinds of clusters, the condition of the surface, and so on.
Temperature dependences of ρ/ρ300K for hydrogen charged ribbons for (Ni0.8Nb0.2)100−xZrx (x = 30, 40 and 50) are shown in Figure 5 and the values of TCR are −1.0, −3.8 and −1.6 × 10⁻⁴/K, respectively. The resultant data are listed in table 2. TCR for x = 30 and 50, in which the amount of the charged hydrogen is not so much, are similar to those for the pre-charged melt-spun ribbons. However, TCR for x = 40 increases about three times more than that for the pre-charged one, that is, the effect of the hydrogen charging on the behavior of the electrical resistivity is clearly observed. The change of the Debye temperature due to the absorbed hydrogen may cause an increase of the absolute value of the TCR, or some other scattering mechanism may also exist.
4. Conclusions
The electrical transport properties of (Ni0.8Nb0.2)100−xZrx (x = 30, 40 and 50) amorphous ribbons and hydrogen charged ribbons were investigated. The amorphous ribbons exhibited a negative coefficient in the temperature
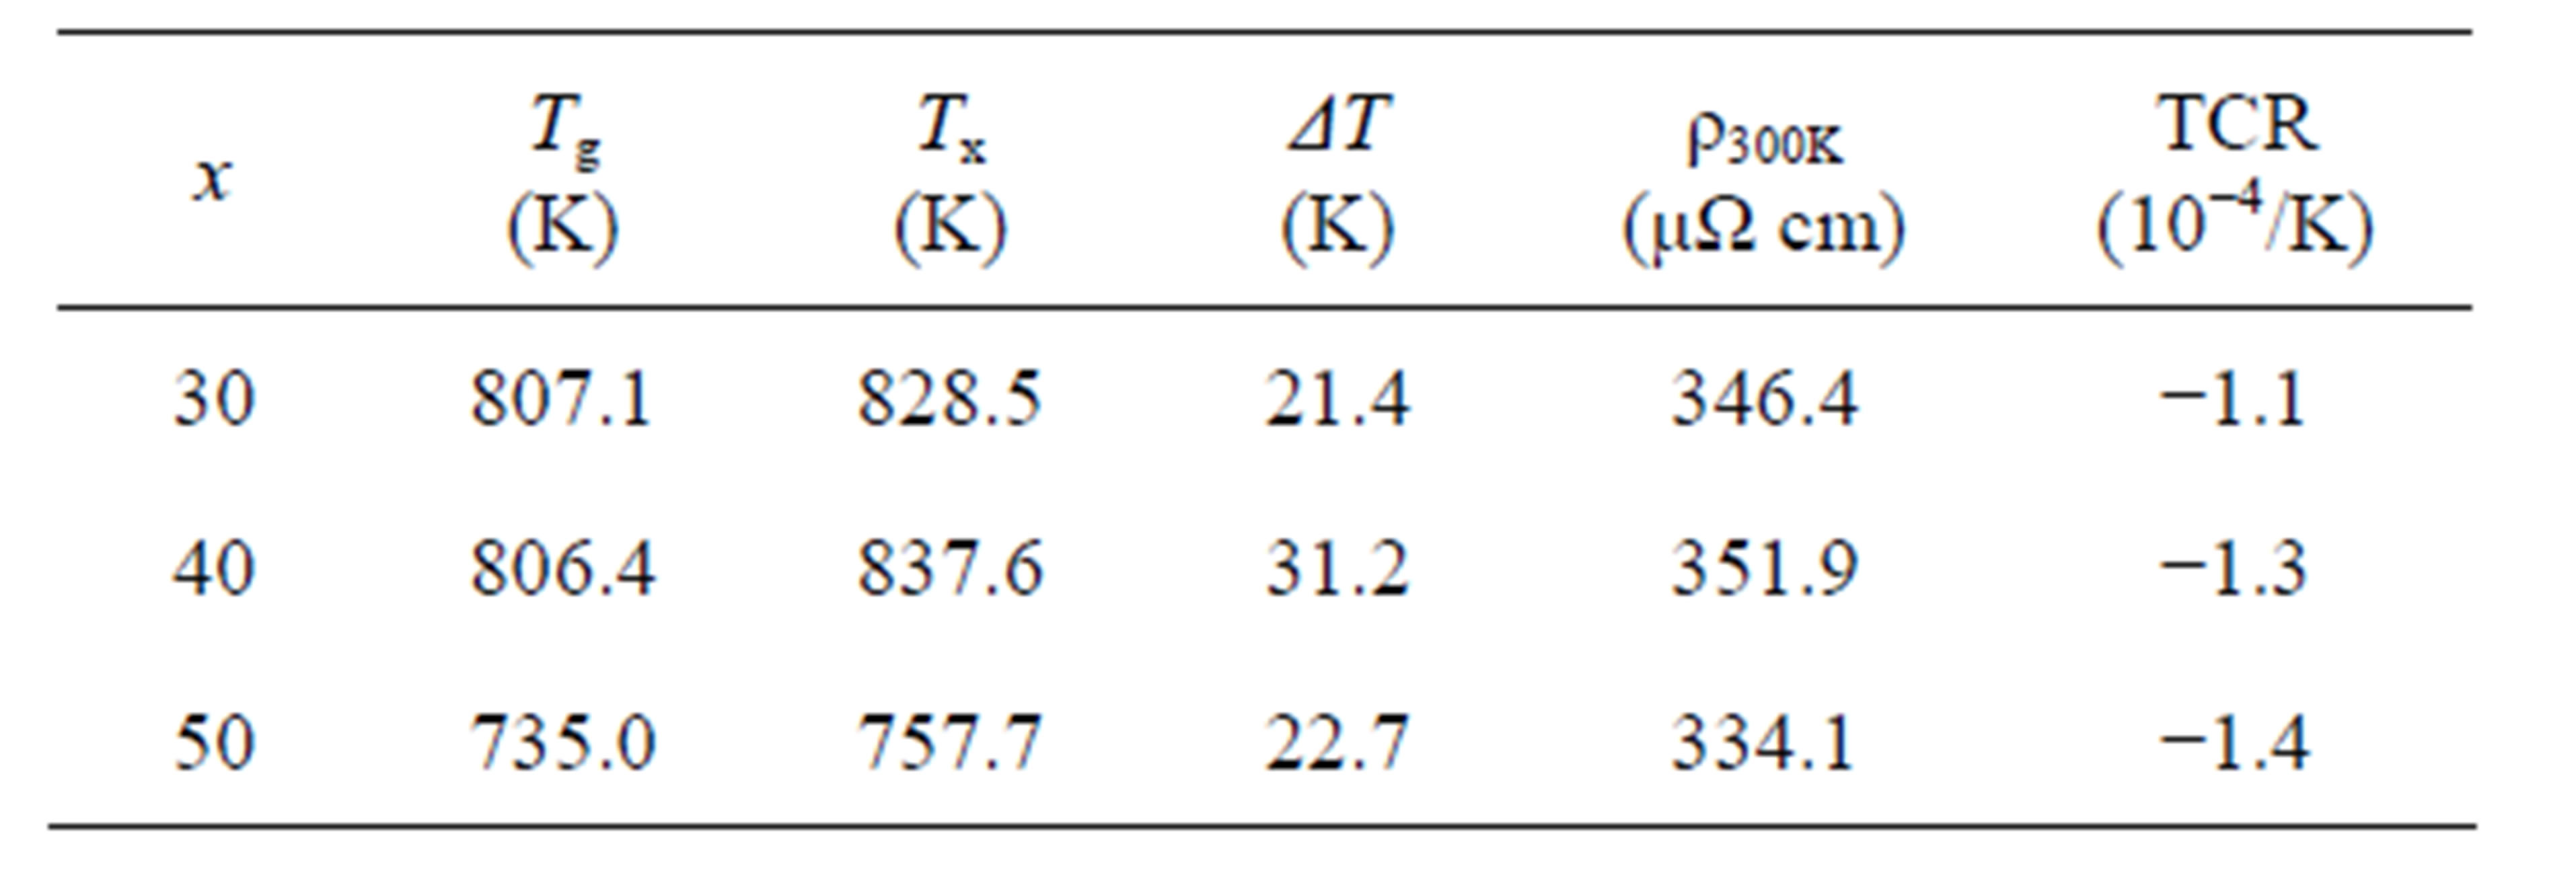
Table 1. Thermal and electrical properties for (Ni0.8Nb0.2)100−xZrx (x = 30, 40, 50) ribbons.

Figure 4. XRD patterns of the hydrogen charged melt-spun ribbons for (Ni0.8Nb0.2)100−xZrx (x = 30, 40 and 50).

Figure 5. Temperature dependences of the normalized electrical resistivity for the hydrogen charged melt-spun ribbons in (Ni0.8Nb0.2)100−xZrx (x = 30, 40 and 50).
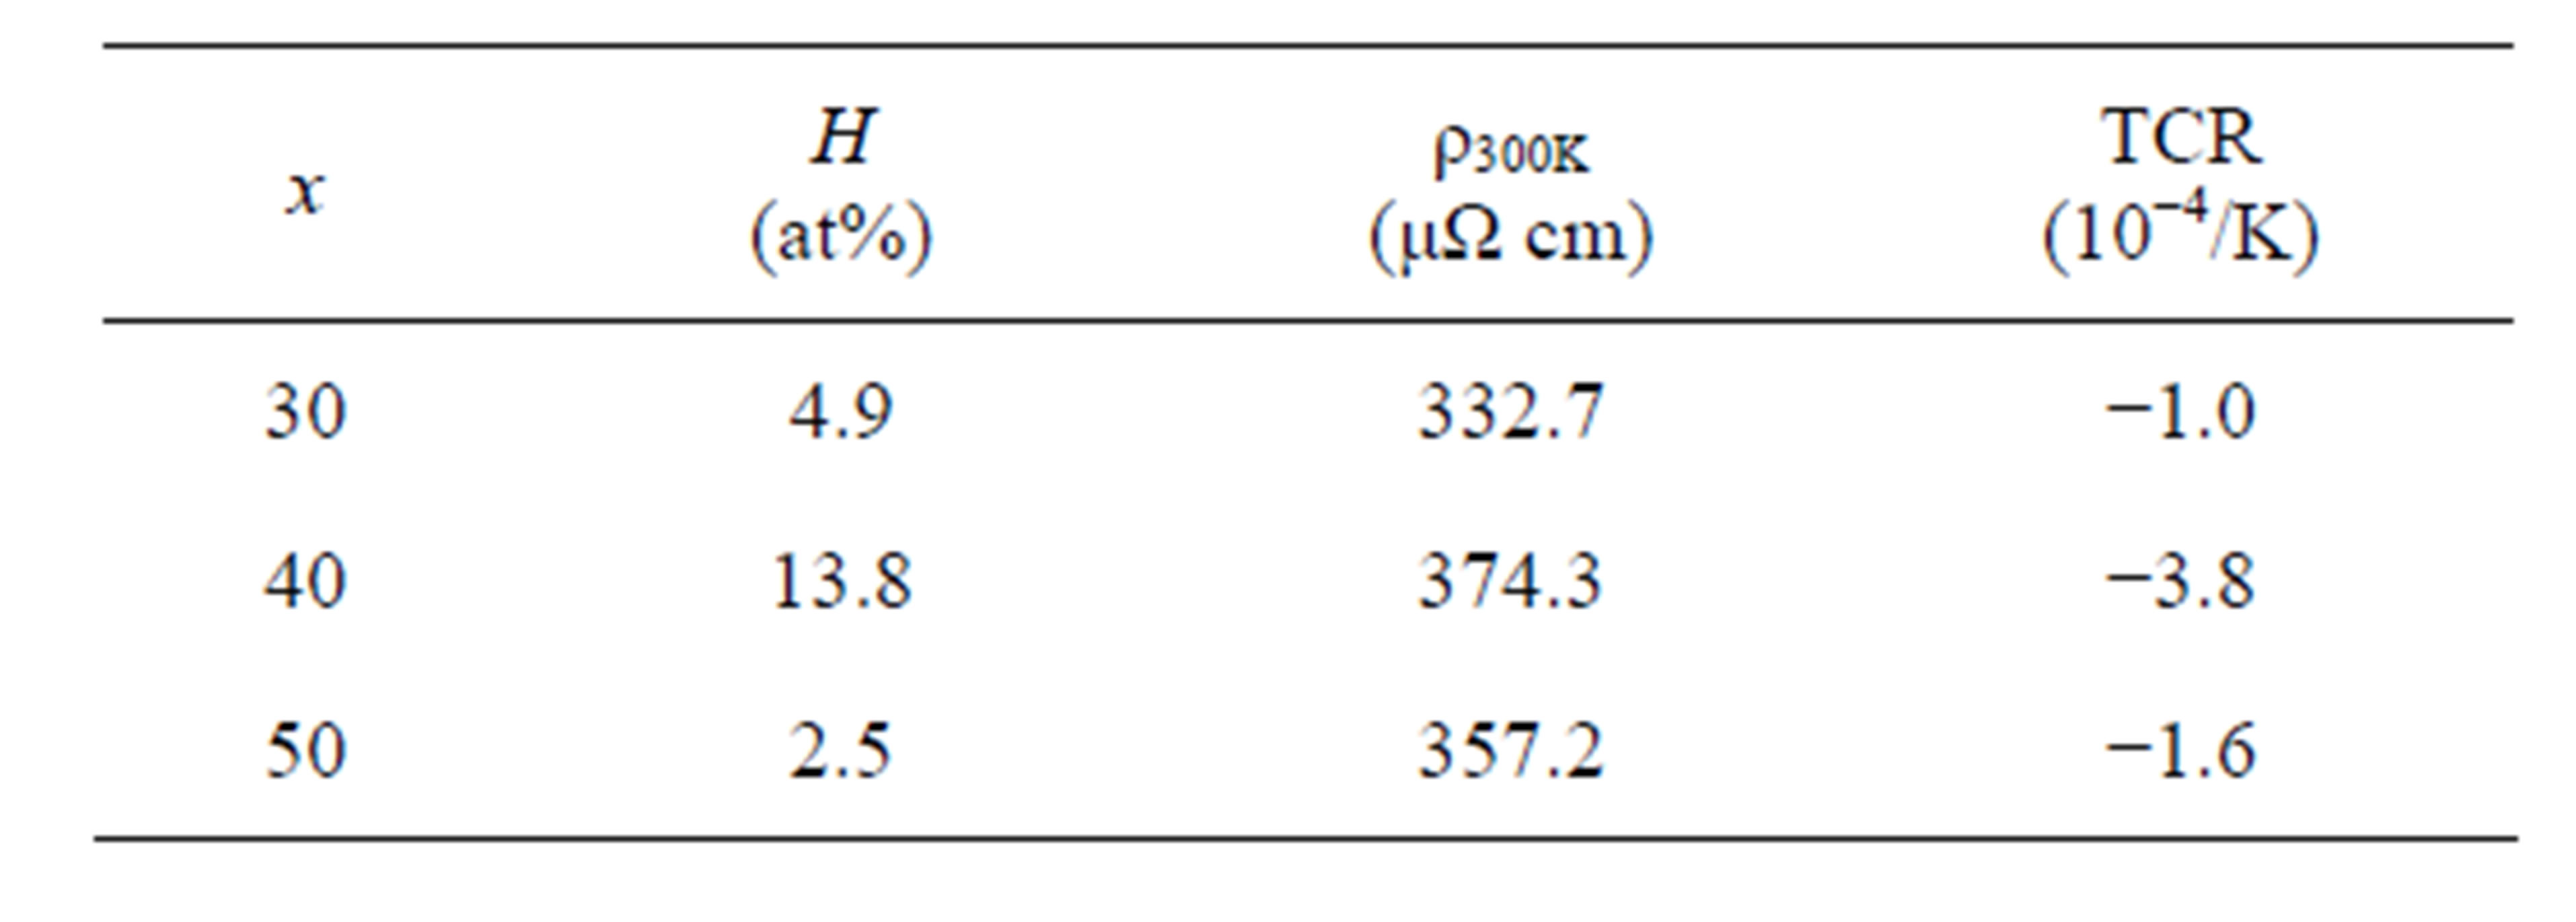
Table 2.Electrical properties for H-absorbed (Ni0.8Nb0.2)100−xZrx (x = 30, 40, 50) ribbons.
dependence of their electrical resistivity as well as the typical properties of the amorphous alloys with a comparatively high value of electrical resistivity, ρ. The normalized coefficient (TCR ≡ 1/ρ300K∙dρ/dT) tended to increase with increasing x in the temperature range of 100 - 300 K. This suggests that the transport properties of the present amorphous ribbons were governed by the temperature variation of the Debye-Waller factor, not by electron-phonon scattering. The hydrogen charged ribbons obtained by the electrochemical method also exhibited similar electrical resistivity behavior as a function of the temperature. However, TCR of x = 40 with hydrogen charged ribbon, in which the amount of absorbed hydrogen was about 14 at%, increased about three times.
REFERENCES
- H. Kimura, A. Inoue, S. Yamaura, K. Sasamori, M. Nishida, Y. Shinpo and H. Okouchi, “Thermal Stability and Mechanical Properties of Glassy and Amorphous NiNb-Zr Alloys Produced by Rapid Solidification,” Materials Transactions, Vol. 44, No. 6, 2003, pp. 1167-1171. doi:10.2320/matertrans.44.1167
- S. Yamaura, Y. Shimpo, H. Okouchi, M. Nishida, O. Kajita, H. Kimura and A. Inoue, “Hydrogen Permeation Characteristics of Melt-Spun Ni-Nb-Zr Amorphous Alloy Membranes,” Materials Transactions, Vol. 44, No. 9, 2003, pp. 1885-1890. doi:10.2320/matertrans.44.1885
- A. Kawashima, S. Yamaura, N. Ohtsu, H. Kimura and A. Inoue, “Mechanical Properties of Melt-Spun Amorphous Ni-Nb-Zr Alloys after Hydrogen Charging,” Materials Transactions, Vol. 47, No. 6, 2006, pp. 1523-1526. doi:10.2320/matertrans.47.1523
- M. Fukuhara, A. Kawashima, S. Yamaura and A. Inoue, “Coulomb Oscillation of a Proton in a Ni-Nb-Zr-H Glassy Alloy with Multiple Junctions,” Applied Physics Letters, Vol. 90, No. 20, 2007, Article ID: 203111. doi:10.1063/1.2739080
- M. Fukuhara, H. Yoshida, K. Koyama, A. Inoue and Y. Miura, “Electronic Transport Behaviors of Ni-Nb-Zr-H Glassy Alloys,” Journal of Applied Physics, Vol. 107, No. 3, 2010, Article ID: 033703. doi:10.1063/1.3284207
- K. P. Gupta, “The Nb-Ni-Zr System (Niobium-NickelZirconium),” Journal of Phase Equilibria, Vol. 21, No. 5, 2000, pp. 485-493. doi:10.1361/105497100770339761
- J. H. Mooij, “Electrical Conduction in Concentrated Disordered Transition Metal Alloys,” Physica Status Solidi A-Applied Research, Vol. 17, No. 2, 1979, pp. 521- 530. doi:10.1002/pssa.2210170217
- U. Mizutani, “Introduction to the Electron Theory of Metals,” Cambridge University Press, Cambridge, 2001. doi:10.1017/CBO9780511612626
- L. V. Meisel and P. J. Cote, “Structure Factors in Amorphous and Disordered Harmonic Debye Solids,” Physical Review B, Vol. 16, No. 6, 1977, pp. 2978-2980. doi:10.1103/PhysRevB.16.2978
- L. V. Meisel and P. J. Cote, “Critical Test of the Diffraction Model in Amorphous and Disordered Metals,” Physical Review B, Vol. 17, No. 12, 1978, pp. 4652-4659. doi:10.1103/PhysRevB.17.4652
- S. R. Nagel, J. Vassiliou, P. M. Horn and B. C. Giessen, “Tamperature Dependence of the Resistivity of Nb:Ni Glasses,” Physical Review B, Vol. 17, No. 2, 1978, pp. 462-467. doi:10.1103/PhysRevB.17.462
- U. Mizutani, “Electronic-Structure of Metallic Glasses,” Progress in Materials Science, Vol. 28, No. 2, 1983, pp. 97-228. doi:10.1016/0079-6425(83)90001-4
- U. Mizutani, “Electron Transport in Non-Periodic Metallic Systems: Amorphous Alloys and Quasicrystals,” Physica Status Solidi B-Basic Research, Vol. 176, No. 1, 1993, pp. 9-30. doi:10.1002/pssb.2221760102