International Journal of Intelligence Science
Vol.2 No.1(2012), Article ID:17036,6 pages DOI:10.4236/ijis.2012.21003
Scientific Communities Found Based on the Path Structure of Citation Network
1College of Computer Science and Technology, Jilin University, Changchun, China
2Key Laboratory of Symbolic Computation and Knowledge Engineering of Ministry of Education, Jilin University, Changchun, China
Email: *huanglan@jlu.edu.cn
Received November 12, 2011; revised December 5, 2011; December 15, 2011
Keywords: Citation Network; Scientific Communities Found; OPTICS Algorithm; Citation Path
ABSTRACT
Based on the structure of citation network, the citation paths among papers, and the association strength such as coupling, co-citation and etc. between two papers are defined in this article. We give formulas to quantify the association strength in order to establish citation network model based on the citation path structure. Then, the OPTICS algorithm is brought into the scientific communities found model since it can solve the parameter’s setting problem. This method combines various kinds of path structures together and thus it contains more complete citation network information. Experiments and analysis reveal the reliability and validity of this method.
1. Introduction
Many researchers have been studying and mining scientific communities using citation network and analysis of the citation network has also become an important tool for their research. Xiaoming Liu employed the analysis method of social network into the co-author network to detect condition variations of the digital libraries and constructed weighted directed citation network to mine the inner scientific communities [1]. R. Ichise designed a userinteracted community mining system, in which the values of co-author network parameter can be constructed variably in different needs of users’ purposes. On that basis, they added the author-keyword schema and make a good attempt at clarifying research interests of different scientific communities [2].
A large amount of previous research has been done on citation analysis method, however, these studies and experiments are all one-sided, doing survey on certain aspects of the research, instead of a comprehensive vision. Shortcomings are listed as follows: First of all, the comparison criterion between relational model is inconsistent. Although the citation path provides association relationship between papers, there’s no uniform criterion to quantify this relationship. Secondly, there’s no documental multiple correlation. The majority of previous scientific community found are doing survey in a certain aspect of citation path, co-author, coupling, co-citation, and thus it is incomprehensive. Thirdly, the results of the mining groups are impracticality.
This article defines the association strength between authors and the association strength between papers. The formulas of those definitions innovatively combine coupling, co-citation, co-author and other structure to make the system more comprehensive. Besides, the proposed OPTICS algorithm is not sensitive to parameter setting, and it can use heuristic algorithm to estimate the parameter and get good mining results of a large dataset.
2. Build of Citation Network Based on the Citation Path Structure
Three common types of citation network structures are coupling, co-citation, co-author. This article uses weighted directed graphic method to build the network model of citation network. Here are some hypotheses: Firstly, assuming there’s no fault reference or repeated reference issues between papers. Secondly, association relations between papers can be measured numerically and the tightness of association relations can also be compared by numeric size.
In citation network, a paper is always regarded as a vertex and a relation as an edge, and thus a mesh structure is formed. Then a citation network model based on the citation path can be built according to the below definitions. The first four definitions below can be found in reference [3].
Definition 1) Citation Network Definition 2) DR (Direct Reference)
Definition 3) RP (Reference Path)
Definition 4) RL (Reference Length)
Definition 5) RPR (Reference Path Relation)
RPR is described by reference length between two papers.
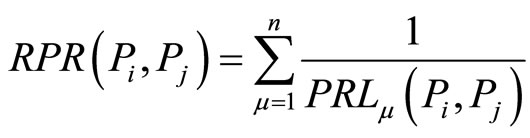 (1)
(1)
where there are n citation paths from paper  to paper
 , and the length of each path is
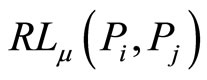 . The longer RL is, the less RPR is. The more RP is, the more RPR is. Thus, we use cumulative method.
Definition 6) BCR (Bibliographic Coupling Relation)
BCR is described by the reference path from the coupling relation papers to the co-citation paper.
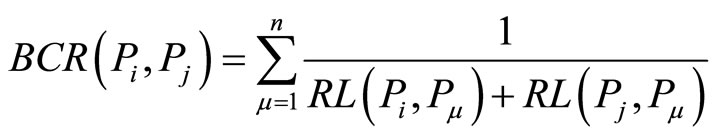 (2)
(2)
where n is the number of co-citation papers by  and
and ,
,  represents the
 paper they co-citation,
 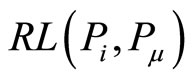 ,
,  is separately used to represent the reference length form
  and
and  to
to . As is shown in the Figure 1,
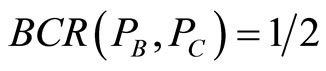 ,
, .
.
 refers
  indirectly, so the coupling association strength between
  and
and  is less tight than that of
  and
and .
.
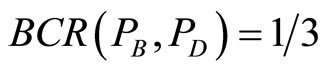
Definition 7) CCR (Co-citation Relation)
CCR is described by the reference paths from the cocitation paper to the two papers respectively.
 (3)
(3)
where n is the number of co-citation papers of  and
and ,
,  represents the
 paper they co-citation,
  ,
,  is separately used to represent the reference length form
 and
and to
to .
.
Definition 8) PR (Paper Relation)
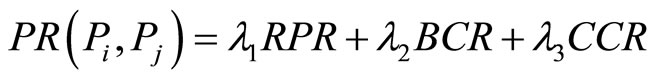 (4)
(4)
PR is accumulated by weighted RPR, BCR and CCR. These three association strengths present the association relations between two papers from different aspects, thus, their weighted value ,
,  ,
,  should be different. In order to discuss the issue, here we set
 .
.
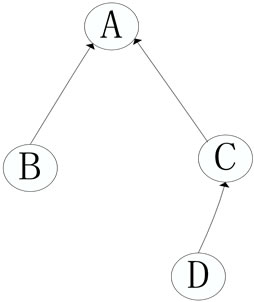
Figure 1. Bibliographic coupling relation.
Definition 9) TR (Together write Relation)
If two authors write a paper together, namely co-author, it demonstrates that they share some interrelated research direction. TR is used to represent this kind of association strength.
 (5)
(5)
where n is the number of paper co-authored by  and
and ,
,  represents the number of the authors who co-author the t-th paper, the PR of each paper is
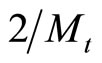 , the overall TR is accumulated by TR of each co-authored paper.
Definition 10) AR (Author Relation)
 (6)
(6)
where m is the total number of the papers author  has published, n is the total number of the papers author
  has published,
  is the
  paper author
  has published,
  is the v-th paper the author
  has published,
  and
and  separately represent the year of the published paper
 and
and . If
. If , then we set
 .
.
If and
and  is the same paper, in other words, it is co-authored, then we set
 .
.
we can use  to represent their association strength. If
  and
and is not the same paper, then
 , we can also use
  to represent their association strength. Considering the two parts represent the different association strength, we accumulate them by weights. In order to discuss this issue, here we set
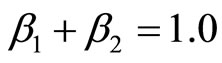 .
.
3. Scientific Communities Found Method Based on Citation Path
3.1. OPTICS Clustering Algorithm
DBSCAN algorithm is sensitive to the parameters of ![]() and Minpts [4]. Even a slight different setting may lead to a different clustering result. Setting of the two parameters requires experience. As for the high-dimensional data, setting appropriate parameters is challenging. In order to solve the shortcomings of DBSCAN algorithm, this article brings in OPTICS [5] (Ordering Points to Identify the Clustering Structure) clustering algorithm [4]. OPTICS algorithm is based on the fact that low-density clusterings contain high-density clusterings, as shown in the Figure 2 where
and Minpts [4]. Even a slight different setting may lead to a different clustering result. Setting of the two parameters requires experience. As for the high-dimensional data, setting appropriate parameters is challenging. In order to solve the shortcomings of DBSCAN algorithm, this article brings in OPTICS [5] (Ordering Points to Identify the Clustering Structure) clustering algorithm [4]. OPTICS algorithm is based on the fact that low-density clusterings contain high-density clusterings, as shown in the Figure 2 where  is the distance parameter of clustering C,
  is the distance parameter from clustering C1 to C2, and
 , clustering C includes clustering C1 and clustering C2 completely.
OPTICS algorithm is the extension of the DBSCAN algorithm [5]. Unlike DBSCAN algorithm which generates clustering result after distributing the objects into different clusters [6], OPTICS algorithm stores a cluster order when each object is being clustered [7].Through the order we can get some basic clustering information such as the center of the cluster and inner cluster structure in the object set of the database. As for each object, these information is made up of two parts: core distance and reachable distance.
Definition 11) Core Distance (CD)
In the object se of the database O, the core distance of object p is defined as: if object p is the core object,  , then the distance from object p to its Minpts nearest surrounding object is called the core distance of object p, written as core-distance (p), if object p is not the core object, then the core object of p is UNDEFINED. In fact core-distance (p) is the minimum
 ![]() to make object p become a core object, or else coredistance (p) is UNDEFINED.
to make object p become a core object, or else coredistance (p) is UNDEFINED.
Definition 12) Reachable Distance (RD)
In the object se of the database O, reachable distance of object p to object q is the larger one of core-distance (q) and the distance from object p and object q, written as reachable-distance (p,q). If q is not the core object, then reachability-distance (p,q) is UNDEFINED. In fact, reachable-distance (p,q) is the minimum direct-density reachable distance from object p to object q. Thus, this reachable distance cannot be smaller than the core-distance (q), or else there’s no direct density-reachable object to object q. The reachable distance of object p to core object is related to the core distance of the core object. The above two definitions are as shown as Figure 3.
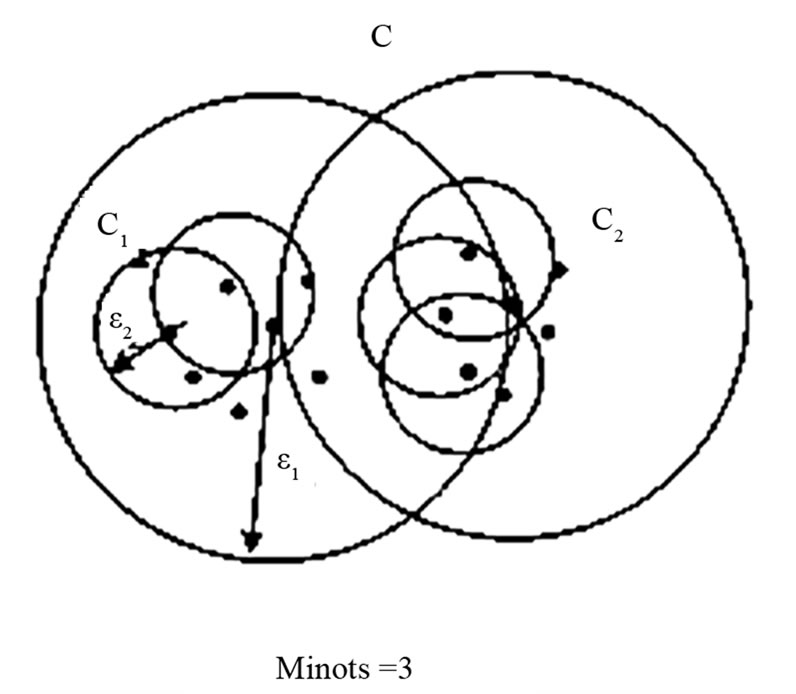
Figure 2. Global distance and local distance.
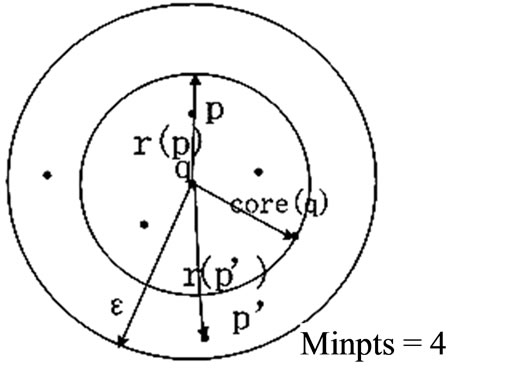
Figure 3. Core distance of object q and reachable distance of object q to object p.
Given the setting parameters Minpts and the initial distance![]() , the procedure of OPTICS clustering algorithm can be described as follows:
, the procedure of OPTICS clustering algorithm can be described as follows:
Step1: Select an unclustered object p from the object set O of the database, and mark this object as clustered.
Step2: According to the parameter![]() , get the object p’s neighbor object set, and set core-distance (p) and reachabledistance (q) according to the neighbor set.
, get the object p’s neighbor object set, and set core-distance (p) and reachabledistance (q) according to the neighbor set.
Step3: If core-distance (p) is UNDEFINED, namely this object is the core object, then add neighbors of object p into the priority queue.
Step4: If the priority queue is empty, then go on to the Step 5, or else select the minimum reachability-distance object q in the queue, get the neighbor set of object q, set the core-distance (q) and reachable-distance (q) according to the neighbor set. If object q is the core object, then add the neighbors of object q into the priority queue, repeat Step 4.
Step 5: If all the objects in object set O have been marked as clustered, then go to the Step 6, or else to Step 1.
Step 6: Output the sorting result and clustering result according to the core distance and reachable distance of each object, then end this algorithm.
The major advantage of OPTICS algorithms is: it’s not sensitive to the parameters Minpts and![]() , that is, Minpts and
, that is, Minpts and ![]() do not influence the distribution of the reachable distance, the parameters can be selected randomly at a large scale without affecting the distribution of reachable distance and the inner clustering structure of object set. [8].Unlike DBSCAN algorithm, OPTICS algorithm can employ heuristic to estimate parameter
do not influence the distribution of the reachable distance, the parameters can be selected randomly at a large scale without affecting the distribution of reachable distance and the inner clustering structure of object set. [8].Unlike DBSCAN algorithm, OPTICS algorithm can employ heuristic to estimate parameter ![]() and Minpts according to experience [9].
and Minpts according to experience [9].
3.2. Design of Scientific Communities Found System
The System of scientific communities found based on citation network contains three independent parts: data preprocessing sub-system, communities mining sub-system, graphic demonstration sub-system. Shown as Figure 4, these three sub-systems can be divided into several independent function modules. Through transferring data, the three sub-systems are combined into a complex system.
4. Experiment and Analysis
In the experiment, SMARTY + PHP + MYSQL scheme is used to construct the model, in which SMARTY template is used for visualization display, PHP is used for processing data and controlling the procedure, and MYSQL is used for data storage.
Initial input data of the experiment come from the paper set of Wanfang Date (http://www.Wanfangdata.com. cn/). These initial data is acquired in HTML source code format, and processed by PHD program, to extract title, abstract keyword, author, references, publish date and other information of each paper. These information are stored in the MYSQL database.
Here, information of 22 papers and 31 authors is extracted from the original database, as shown as Table 1 and Table 2. We can construct the citation network, in which each vertex represents each paper, named by the paper_id, and each edge represents the citation relationship between two papers.
Based on the citation network structure shown in Figure 5, we use Formular (1) to compute RPR between any two papers and get the RPR matrix of citation network. Similarly, we use Formulas (2) and (3) to compute the BCR matrix and CCR matrix [10]. Then according the Formula (4), we can get PR matrix. Furthermore, we can get AR matrix according Formula (5) and Formula (6), as shown as Figure 6. After computing the AR matrix. we can get the distance between any two authors and cluster the author objects.
In the experiment, we set ![]() = 5, Minpts = 4, the author object cluster order after data clustering is: 1, 2, 28, 29, 3, 24, 25, 4, 5, 6, 12, 7, 13, 26, 27, 9, 8, 20, 19, 11, 15, 14, 16, 10, 30, 31, 17, 18, 21, 22, 23, in which the numbers is id of the author object in the database). When we Set
= 5, Minpts = 4, the author object cluster order after data clustering is: 1, 2, 28, 29, 3, 24, 25, 4, 5, 6, 12, 7, 13, 26, 27, 9, 8, 20, 19, 11, 15, 14, 16, 10, 30, 31, 17, 18, 21, 22, 23, in which the numbers is id of the author object in the database). When we Set ![]() = 3.0, 2, 28, 29 belong to one cluster; 24, 25 belong to one cluster; 6, 12, 7, 13, 26, 27, 9, 8, 20, 19, 11, 15, 14, 16, 10, 30, 31, 17, 18 belong to another cluster; the others are noise. That means that author 2, 28, and 29 form a scientific community; author 24 and 25 form another community; 6, 12, 7, 13, 26, 27, 9, 8, 20, 19, 11, 15,
= 3.0, 2, 28, 29 belong to one cluster; 24, 25 belong to one cluster; 6, 12, 7, 13, 26, 27, 9, 8, 20, 19, 11, 15, 14, 16, 10, 30, 31, 17, 18 belong to another cluster; the others are noise. That means that author 2, 28, and 29 form a scientific community; author 24 and 25 form another community; 6, 12, 7, 13, 26, 27, 9, 8, 20, 19, 11, 15,
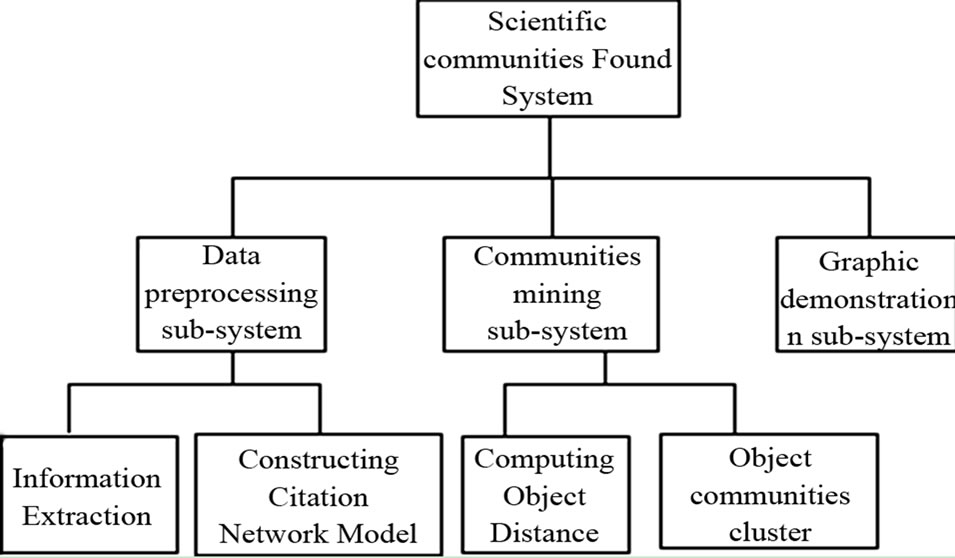
Figure 4. Scientific communities found system.
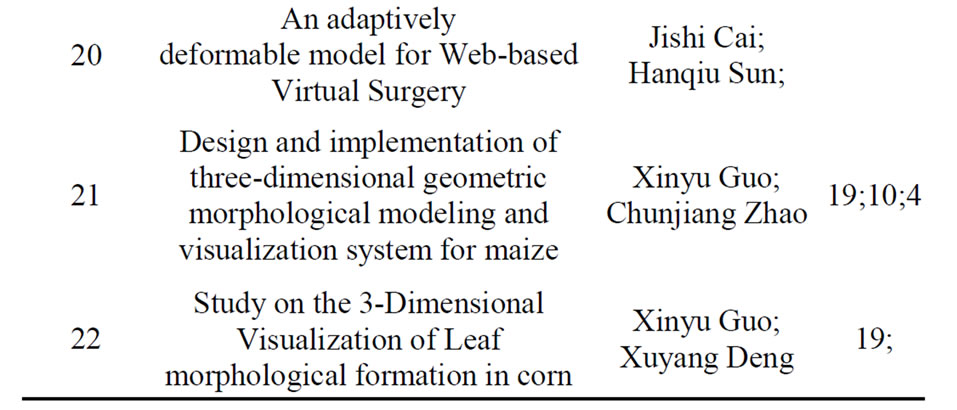
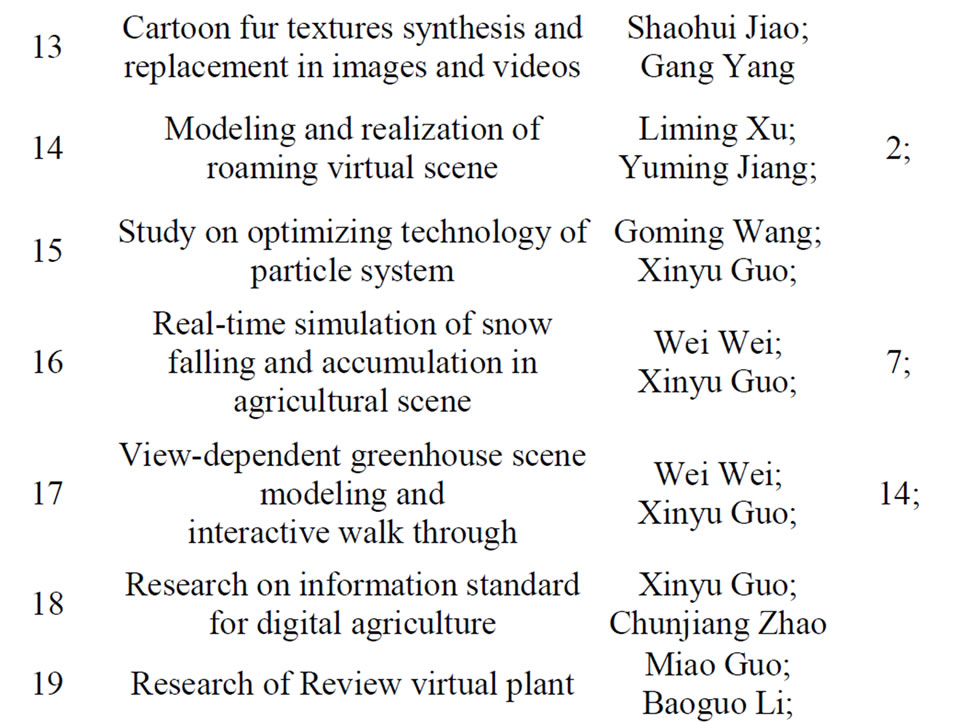
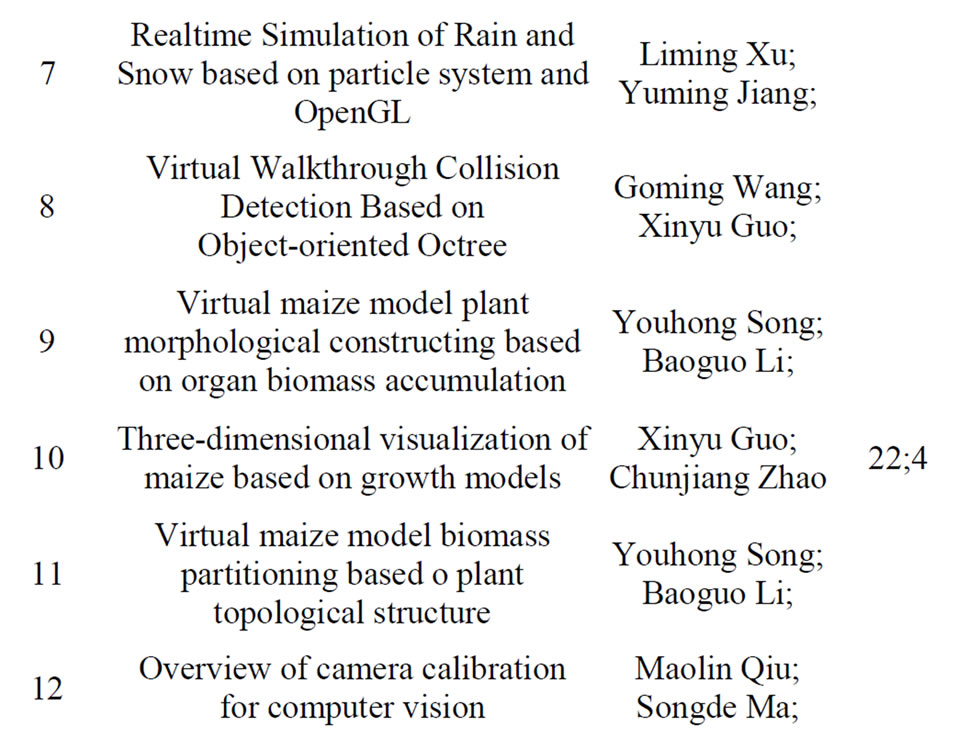

Table 1. Papers’ information extracted from the original database.

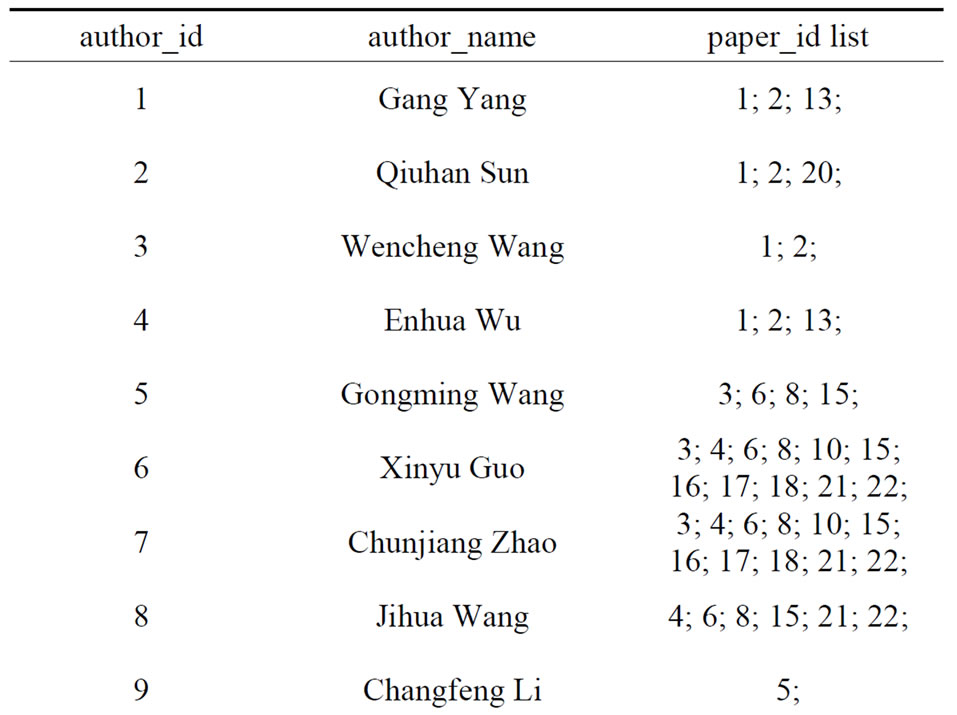
Table 2. Part authors’ information extracted from the database.
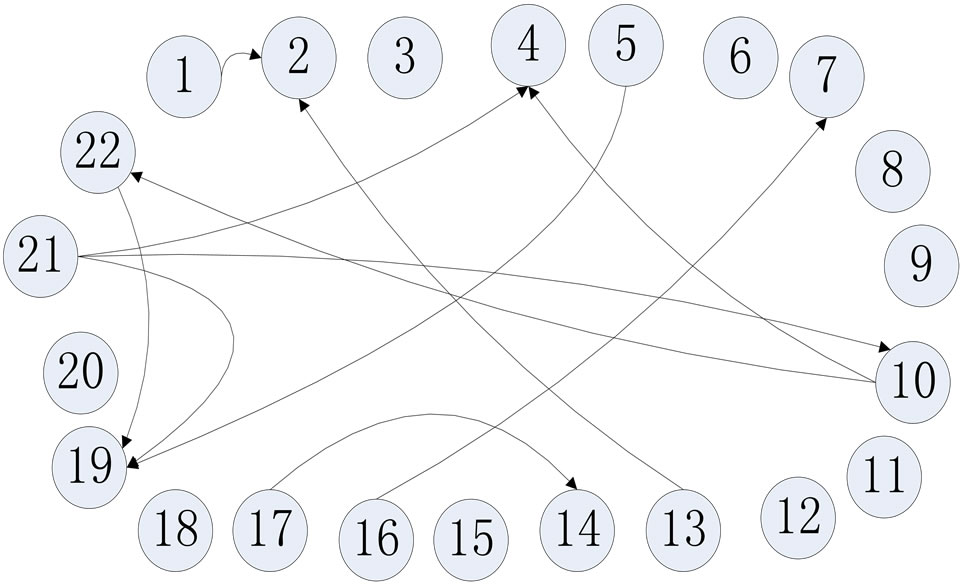
Figure 5. Citation network structure.
14, 16, 10, 30, 31, 17, 18 can form a large scientific community; the other authors are scatter points.
5. Conclusions
This article researched on the structure of the citation network based on the citation path [11], defined the association relations between papers to transfer the scientific communities found model in the database to a clustering issue of points in the space. Besides, by using OPTICS algorithm, there’s no need for users to concern about the selection of the parameters and clusters of any shape can be found effectively in a more practical way [12].
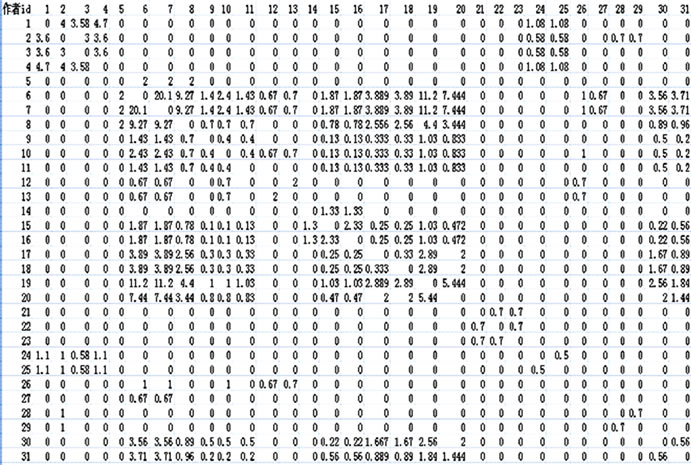
Figure 6. AR matrix.
In order to test and analyze conveniently, the number of selected papers is not large and all of them are in Chinese. This article hypothesis there’s no fault reference or repeated reference, while in fact, these problems are quite likely to happen. So our future work is to improve the model, doing research on how to deal with those issues and filter the citation path accurately.
6. Acknowledgements
This article is supported by (1) the National Natural Science Foundation of China under Grant No. 60873146, 60973092, 60903097; (2) the science and technology development key project of Jilin province under Grant No. 20110354; (3) the Key Laboratory for Symbol Computation and Knowledge Engineering of the National Education Ministry of China.
REFERENCES
- X. M. Liu, J. Bollen and M. Nelson, “Co-Authorship Networks in the Digital Library Research Community,” Information Processing and Management, Vol. 41, No. 5, 2005, pp. 1462-1480. doi:10.1016/j.ipm.2005.03.012
- R. Ichise, H. Takeda and T. Muraki, “Research Community Mining with Topic Identification,” Proceedings of the Information Visualization, London, 2006, pp. 276- 281.
- H. X. Lin, “Scientific Group Mining Based on the Citation Network,” Master Dissertation, Fudan University, Shanghai, 2009.
- N. Ma and J. C. Guan, “Survey on the Mining Algorithm Based on the Network Structure,” Informatics Disciple, Vol, 13, No. 1, 2008, pp. 3-14.
- K. Börner, L. Dall’Asta, W. Ke and A. VeSPignani, “Studying the Emerging Global Brain: Analyzing and Visualizing the Impact of Co-Authorship teams,” Complexity, Vol. 10, No. 4, 2005, pp. 57-67. doi:10.1002/cplx.20078
- M. J. Bommarito, D. M. Katz, J. L. Zelner and J. H. Fowler,” Distance Measures for Dynamic Citation Networks,” Elsevier, Amsterdam, Vol. 289, No. 19, 2010, pp. 4201-4208.
- Y. Takeda and Y. Kajikawa, “Tracking Modularity in Citation Networks,” Scientometrics, Vol. 82, No. 3, 2010, pp. 783-792. doi:10.1007/s11192-010-0158-z
- G. Z. Wang and G. L. Wang, “Improved Quick DBSCAN Algorithm,” Journal of Computer Applications, Vol. 26, No. 15, 2009, pp. 2364-2373.
- S. K. Zhou, A. Y. Zhou and J. Cao, “DBSCAN Algorithm Based on Data Partition,” Journal of Computer Research and Development, Vol. 2, No. 2, 2000, pp. 169-194.
- H.-P. Kriege and M. Pfeifle, “Density-Based Clustering of Uncertain Data,” Proceedings of the 11th ACM SIGKDD International Conference on Knowledge Discovery in Data Mining, New York, 2005. doi:10.1145/1081870.1081955
- J. Liu and X. S. Ma, “Improved DBSCAN Clustering Algorithm’s Study and Application,” Communication and Computer, China, 2008.
- Y. L. Zeng, H. B. Xu and S. Bai, “Improved OPTICS Algorithm and Its Application in Text Clustering,” Journal of Chinese Information Processing, Vol. 9, No. 4, 2008, pp. 1483-1492.