Open Journal of Soil Science
Vol.4 No.1(2014), Article ID:42266,10 pages DOI:10.4236/ojss.2014.41003
Effect of NaCl-Induced Salinity and Human Urine Fertilization on Substrate Chemical Properties@NolistTemp#
Institute of Plant Production and Agroecology in the Tropics and Subtropics, University of Hohenheim, Stuttgart, Germany.
Email: michaelyongha@yahoo.com, yongha@uni-hohenheim.de
Copyright © 2014 Michael Yongha Boh, Joachim Sauerborn. This is an open access article distributed under the Creative Commons Attribution License, which permits unrestricted use, distribution, and reproduction in any medium, provided the original work is properly cited. In accordance of the Creative Commons Attribution License all Copyrights © 2014 are reserved for SCIRP and the owner of the intellectual property Michael Yongha Boh, Joachim Sauerborn. All Copyright © 2014 are guarded by law and by SCIRP as a guardian.
Received November 18th, 2013; revised December 15th, 2013; accepted December 24th, 2013
Keywords:Soil Sodicity; Electrical Conductivity; Urine Nitrogen; Nutrient Recycling
ABSTRACT
We evaluated the effect of NaCl-induced salinity and successive urine fertilization on changes in cultivation substrate chemical properties in a greenhouse study. The substrate was composed of an equal volume ratio mixture of bio-waste compost, quartz sand and silty loam soil. Salinity was imitated by adding NaCl solutions to a known substrate weight achieving three target salinity treatments of ECe 1.3 (S0—no NaCl), 4.6 (S1) and 7.6 (S2) dS∙m−1. Cultivation substrate had been cropped with two cycles of maize (Zea mays L.) (crop cycles I and II) and fertilized with human urine at N amounts of 0 (U0—no urine), 180 (U1) and 360 (U2) mg∙kg−1 substrate in the first cycle and half of the urine-N dosages in cycle II. Substrate samples collected at the end of each cycle were analyzed for pHKCl, ECe, exchangeable and water extractable cations (Na+, K+, Ca2+, Mg2+), cation exchange capacity, water extractable anions (Cl−,  ,
,  ,
, 15 /wang##Bracket#) and exchangeable sodium percentage (ESP). Exchangeable Na+, K+ and Ca2+ were significantly (p < 0.05) affected by salinity x urine interaction. ECe significantly increased by 7.3, 5.3 and 7.6 dS∙m−1 in the S0, S1 and S2 treatments following an increase in urine from U0 to U2. In the S0 treatment, ESP increased in the order U0 < U1 < U2. Extractable
  and Cl− were significantly affected by crop cycle, salinity and urine interactions (p < 0.05) whereas the effect of urine fertilizer on extractable
  and
and  depended on crop cycle alone. There was a tendency towards increasing soil sodicity with mounting urine fertilization. The level of NaCl salinity and the amount of urine applied are important determinants of substrate chemical properties. Adoption of appropriate management techniques to avoid salinity/sodicity build up should be included in urine fertilization planning.
1. Introduction
Soil salt accumulation constitutes a major problem in agricultural production worldwide [1]. Salt affected soils are generally low in available plant nutrients and would require adequate fertilizer application and management to achieve optimal yields [2]. However, for farmers in low income countries, commercial inorganic fertilizers are too expensive and unaffordable [3]. The ecological sanitation (ECOSAN) concept promotes the use of human urine as an alternative plant fertilizer due to its rich content in readily available plant nutrients [4]. Human urine is a multi-component fertilizer containing N, P, K+, S, Ca2+, Mg2+, Na+, Cl− and other micronutrients in amounts that vary depending on the diet [5].
Research has shown that by applying human urine as a fertilizer, plant growth and crop yields were improved [6-8]. Concerns regarding hygienic safety, pharmaceutical residues and hormones have been addressed and guidelines for a safe use of urine in agriculture are well documented [9,10]. Na+, Cl− and  are among the most salt-bearing ions in fresh urine and after storage urine salinity can rise three-fold due to urea degradation [11]. For this reason, restrictive use of human urine as a fertilizer under saline conditions has been recommended [10].
Indeed, some researchers have reported an increase in soil salinity resulting from human urine fertilization and have related a decline in crop growth to urine-induced salinity [8,12]. In these studies, soil ECe as an index of salinity and pH were among the main investigated soil parameters. So far, very little attention has been accorded the effect of human urine fertilizer application on soil chemical properties and it is not clear how NaCl salinity and urine fertilizer application interaction will affect soil chemical properties. While salinity is commonly thought of as the problem, Na+ applied with urine can increase the risk of soil sodicity especially under NaCl saline conditions.
The objective of this study was to assess the effect of NaCl-induced salinity and fertilization using urine on cultivation substrate cation exchange capacity (CECp), electrical conductivity (ECe), exchangeable cations, water soluble cations and anions, pHKCl and exchangeable sodium percentage (ESP). We hypothesized that 1) due to their contents in urine, water extractable anions and cations and substrate exchangeable cations will increase with mounting dosages of urine and 2) urine fertilization imposes a risk on soil sodicity which might increase under NaCl-induced saline conditions. Results from this study should enhance urine fertilizer management to improve crop yields while being conscious of the risk of soil degradation.
2. Materials and Methods
We conducted our investigations on cultivation substrates from two pot experiments carried out in a greenhouse at the University of Hohenheim, Stuttgart-Germany (48.7114˚N 9.2095˚E). Cultivation substrates had been sown twice with maize (Zea mays L.) and fertilized with human urine in 2010 and 2011, hereafter, referred to as crop cycle I and crop cycle II, respectively. The substrate constituted of bio-waste compost, quartz sand and silty loam soil, homogeneously mixed in a 1:1:1 volume ratio to improve organic matter content and to enhance nutrients availability [8]. Substrate samples from the homogenous mixture were taken and analyzed for chemical properties (Table 1). For both crop cycles, the experimental factors were salinity and nitrogen applied as urine. Salinity was imitated by adding NaCl solutions to the cultivation substrate. The amount of salt solution to be added was determined in a calibration study whereby different volumes of NaCl solution were added to known weights of cultivation substrate, incubated for 72 hours
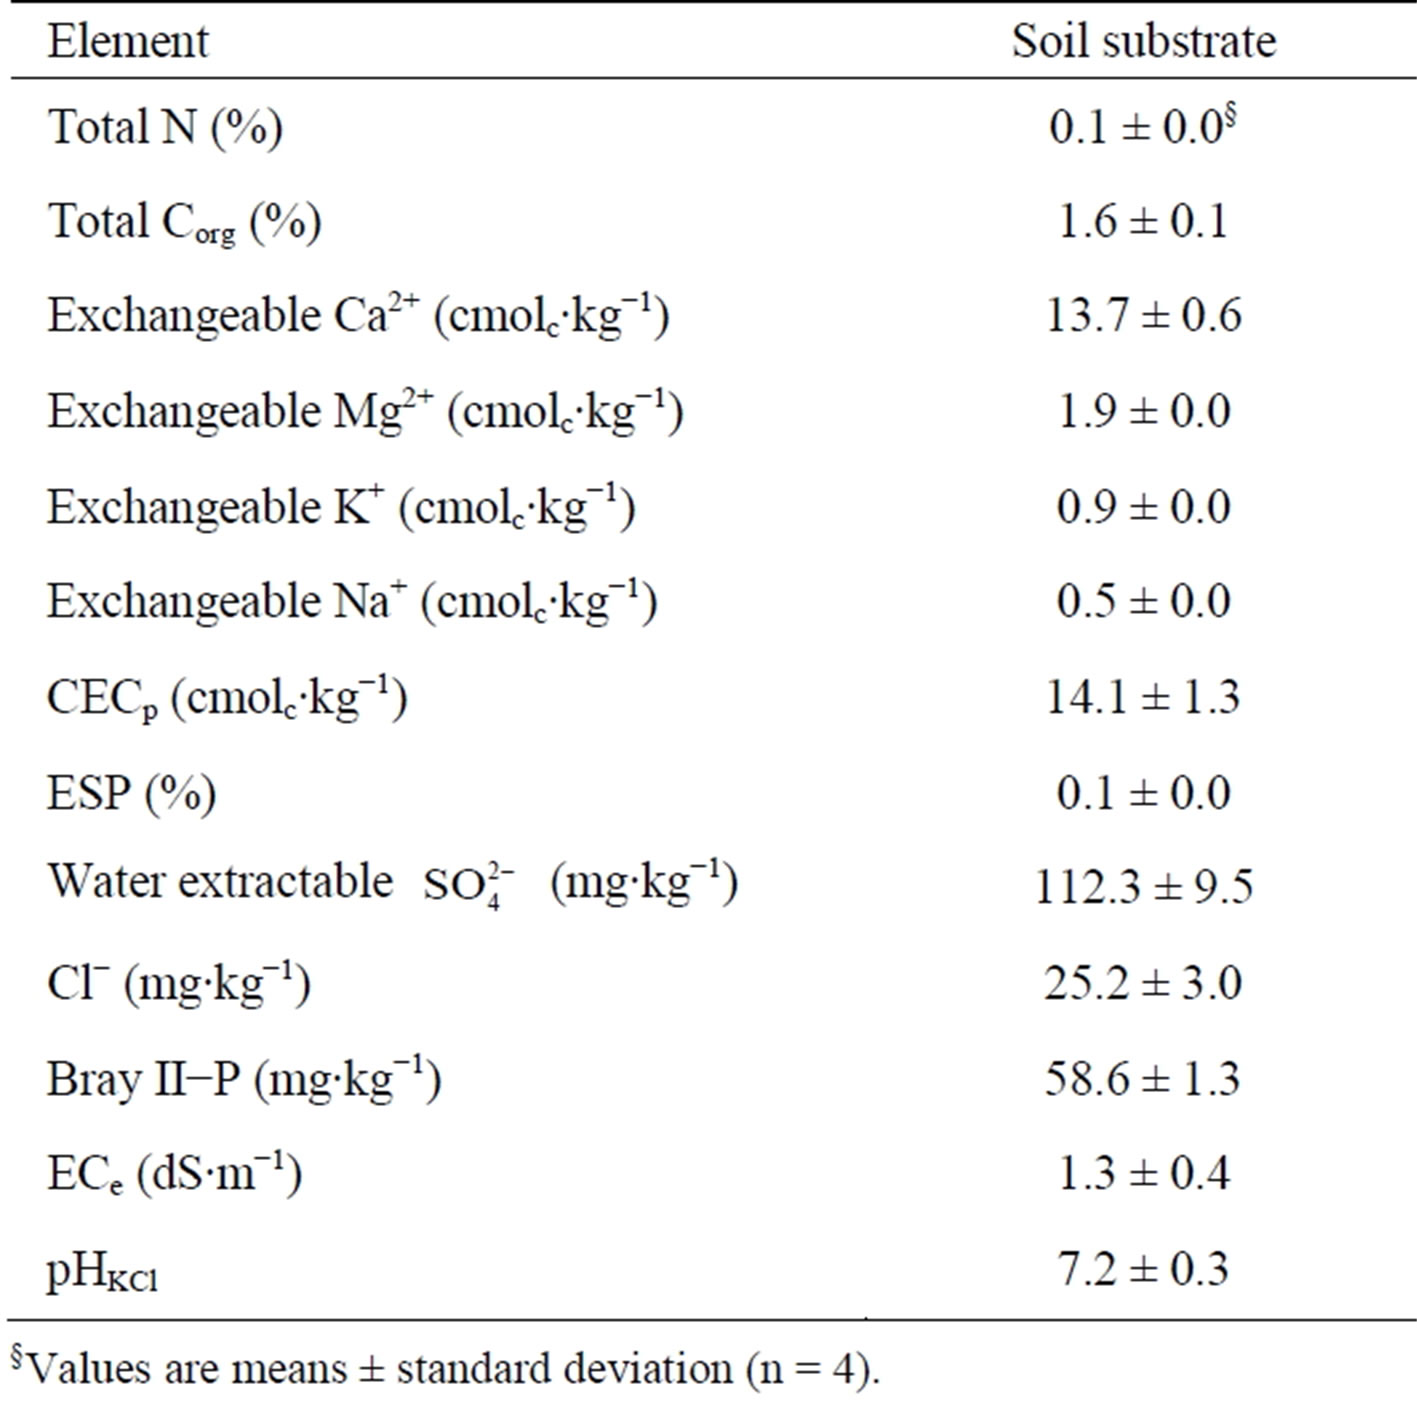
Table 1. Chemical composition of untreated substrate at the beginning of the experiment.
§Values are means ± standard deviation (n = 4).
and their electrical conductivities measured from a saturated paste extract (ECe) according to Richards [13]. Targeted NaCl-salinity treatments achieved were ECe 1.3 (S0—no NaCl added), 4.6 (S1) and 7.6 (S2) dS∙m−1.
Urine was collected from a student hostel at the University of Hohenheim, Stuttgart in April 2009 and stored in an air-tight container at mean daily temperatures of 25˚C ± 2˚C for 12 months before usage. This duration and temperature were according to Vinerås et al. [14] sufficient for inactivation of bacteria and viruses. Prior to application, the urine container was thoroughly shaken and samples taken for chemical analyses. At first crop fertilization (crop cycle I), urine contained 8.4 g total N (mainly  and NH3), 1.42 g K (as K2O), 0.49 g P (as P2O5), 0.35 g Ca2+, 0.53 g Mg2+, 2.70 g Na+, 3.37 g Cl− and 2.3 g S (as SO4) l−1. Total nitrogen content in urine decreased by 29% before the start of crop cycle II in 2011 assumingly due to volatilization losses.
For crop cycle I, 12 kg of the prepared soil substrate was filled into 10 l Mitscherlich pots, sown with maize (cv. Okomasa) seeds and fertilized with urine. Urine treatments were 0 (U0) 180 (U1) and 360 (U2) mg urine-N kg−1 substrate. P and K in the substrate were augmented by adding mono potassium phosphate in amounts equivalent to 88 mg  and 57 mg K2O kg−1 substrate. Eight replications of the 3 × 3 salinity urine-N factorial combinations were arranged in a completely randomized block design. This experiment was terminated at the onset of tasseling. Plant biomass (root and shoot) was harvested, substrate from each pot was hand-crushed and samples collected for chemical analyses.
Eleven kilograms of the homogenized cultivation substrate was refilled into the Mitscherlich pots for the second crop (crop cycle II). Cultivation substrates were not treated with NaCl any further and salinity remained at levels induced initially or as influenced by urine fertilization at the end of crop cycle I. Maize was sown as a second crop and substrates fertilized with half as much urine-N as used in crop cycle I. Urine dosages were 0 (U0), 90 (U1) and 180 (U2) mg N·kg−1 substrate. Experimental design was the same as in crop cycle I except that there were 4 replications per treatment. Whole plant (root and shoot) biomass was harvested at tasseling and substrates from each pot was hand-crushed, homogeneously mixed and samples also taken for chemical analyses.
Substrate samples collected at the end of both trials were air-dried and sieved through a 2 mm merge. Water soluble cations (Na+, K+, Ca2+, Mg2+) and anions (Cl−,  ,
,  ,
, ) were measured from a 1:5 substrate:water extract after shaking 4 g of air-dried soil substrate end-over-end in 20 ml deionized water for 1 hour and centrifuged for 10 minutes at 2500 rpm. The concentrations of soluble Na+, K+ and Ca2+ in the extract were measured by flame photometry while Mg2+ was measured by atomic absorption spectrophotometry (AAS). Water soluble anions were measured by ion chromatography [861 Advanced Compact IC with Metrohm Suppressor Module II (MSM II) and 853 Metrohm CO2 Suppressor (MCS), Metrohm Ltd, Switzerland]. Substrate pH was measured in 1 M KCl with a glass electrode using a 1:5 substrate:solution suspension according to standard procedure. Electrical conductivity (ECe) was measured by same method as mentioned above.
2.1. Exchangeable Cations and Cation Exchange Capacity (CECp)
Exchangeable cations and potential cation exchange capacity (CECp) were measured using a modified BaCl2 and MgCl2 method described in Hendershot and Duquette [15]. Five grams of air-dried substrate samples were weighed into 50 ml centrifuge tubes. Three centrifuge-washing steps were carried out as follows: 25 ml of 0.1 M BaCl2-triethanolamine solution was added to the substrate in the centrifuge and tubes were shaken on an orbital shaker for 10 min and centrifuged at 2500 rpm for 10 min. The clear supernatant solution was filled into 100 ml volumetric flask after each washing step. After the last washing, the volumetric flask was filled to exactly 100 ml with deionised water, hand-shaken and filtered through ash-free Whatman filter paper No. 42 (Macherey-Nagel GmbH & Co., Germany). The solution was collected in PE-bottles for measurement of exchangeable Na+, K+, Ca2+ and Mg2+.
Substrates were washed twice with deionised water and decant discarded. Three centrifuge-washing steps with 25 ml of 0.15 M MgCl2 solution was carried out following the same procedure as described for BaCl2 above. At the end, the filtrate was collected in PE-bottles for measurement of exchangeable Ba2+. CECp was calculated after accounting for the dilution caused by entrained BaCl2 solution using the formula:
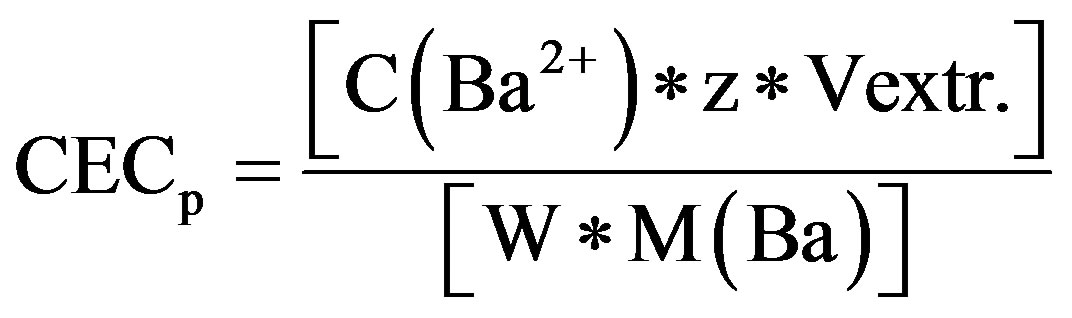
where, CECp is potential cation exchange capacity (mmolc∙kg−1), C(Ba2+) is Ba2+ concentration in the extract (mg∙l−1), z is the valence of Ba2+ (2), Vextr. is the volume of the extraction solution (ml), W is the weight of the soil and M(Ba) is the molar mass of Ba2+ (g∙mol−1).
Exchangeable Na+, K+, Ca2+ and Ba2+ were measured by flame photometry and Mg by AAS. As an index of sodicity, exchangeable sodium percentage (ESP) was calculated according to Seilsepour et al. [16] using the formula:
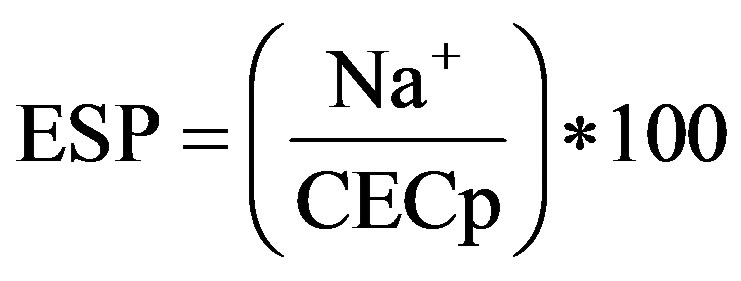
where, Na+ is the measured exchangeable sodium in cmolc∙kg−1 and CECp is cation exchange capacity in cmolc∙kg−1.
2.2. Data Analyses
Data were analysed using the SAS statistical software (SAS Institute version 9.3). The effect of crop cycle, salinity and urine fertilization on pHKCl, ECe, water extractable and exchangeable Na+, K+, Ca2+ and Mg2+, water soluble anions, CECp and ESP were assessed using the GLM procedure for analysis of variance (ANOVA). The three main factors crop cycle, salinity, urine fertilization and their interactions were considered statistically significant at p ≤ 0.05 level of probability. When the three-way interactions were not statistically significant, data were pooled for twoor one-way ANOVA. The data for water extractable cations, anions and CECp were log-transformed while the data for exchangeable Na+ was square root-transformed for statistical calculations. Where ANOVA indicated significant differences, mean differences between treatments were compared using the adjusted Tukey-Kramer post-hoc test.
3. Results
3.1. Effect of Crop Cycle, Salinity and Urine Treatment on Substrate pHKCl
Substrate pHKCl was significantly affected by crop cycle × salinity (F = 3.54; p = 0.034), crop cycle × urine fertilization (F = 8.47; p = 0.0005) and salinity × urine fertilization (F = 12.28; p < 0.0001) interactions. Though substrate pHKCl was generally higher at the end of the crop cycle II, there was no significant salinity or urine application effect. At the end of crop cycle I, substrate pHKCl units significantly decreased from 6.8 (U0) to 6.6 (U2) in the S1 and from 6.8 (U0) to 6.4 (U2) in the S2 treatments (Table 2).
3.2. Effect of Crop Cycle, Salinity and Urine Fertilization on Exchangeable Cations ECe, CECp and ESP
There was no significant crop cycle, salinity and urine interaction effect on exchangeable cations, CECp and ESP (p > 0.05). Exchangeable Na+, K+ and Ca2+ were significantly affected by urine × salinity interactions (Figures 1(a)-(c)). Compared to the unfertilized treatment (U0), average substrate exchangeable Na+ increased by 33.6 (U1) and 76.6% (U2) in the S0 treatment (Figure 1(a)). Furthermore, a 62% increase in average exchangeable Na+ was measured as urine fertilization amount was raised from U1 to U2. In the S1 treatment, an 11.3% significant increase in mean exchangeable Na+ content was measured following the application of U2 compared to U0. Though there was a tendency towards an increase in mean exchangeable Na+ in the S2 treatment as the amount of applied urine rose, the effect was not statistically significant.
Average exchangeable K+ content was not affected by urine fertilization in the S0 treatment whereas in the S1 treatment it increased by 0.18 cmolc∙kg−1 (30%) as urine fertilization was raised from U0 to U2 (Figure 1(b)). The effect of urine application was strongest under S2 treatment where mean substrate exchangeable K+ increased by 16.9% from U0 to U1 and 18.1% from U1 to U2.
Compared to U0, U1-treated substrates had no significant effect on average exchangeable Ca2+ concentrations at all salinity levels (p > 0.05) (Figure 1(c)). Meanwhile, in the S0 and S2 treatments, the mean concentration of exchangeable Ca2+ significantly increased by 0.76 and 1.13 cmolc∙kg−1 following an increase in urine application from U0 to U2, respectively.
Under all salinity treatments, U1 had no significant effect on exchangeable Mg2+ concentration compared to the unfertilized treatment (U0) (Figure 1(d)). Exchangeable Mg2+ significantly increased by 0.14 cmolc∙kg−1 as urine application rose from U1 to U2 in the S0 treatment
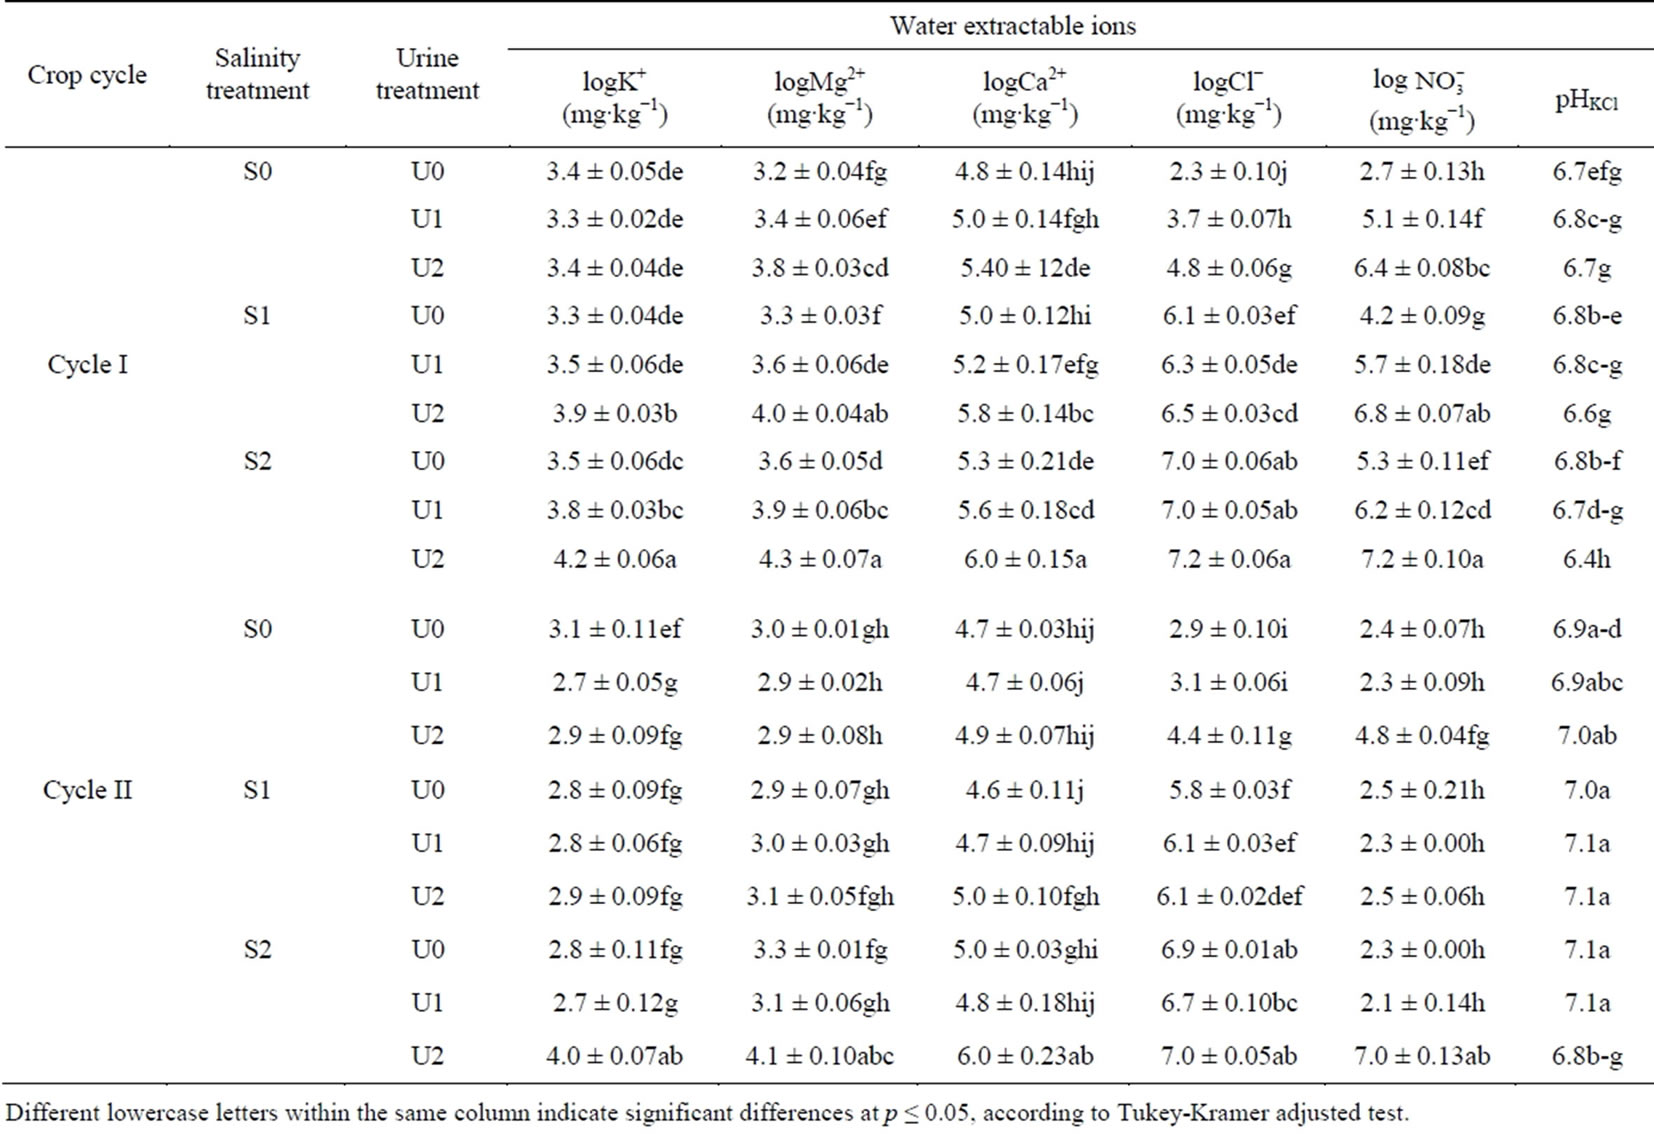
Table 2. Effect of crop cycle (cycle I and II), salinity treatment (S0, S1 and S2) and urine fertilization (U0, U1 and U2) on selected water extractable ions.
Different lowercase letters within the same column indicate significant differences at p ≤ 0.05, according to Tukey-Kramer adjusted test.
Figure 1. Interactive effect of salinity (S0, S1 and S2) and urine fertilization (U0, U1 and U2) on substrate exchangeable Na+ (a), K+ (b), Ca2+ (c) and Mg2+ (d). Data are means of two crop cycles ± S.E. (n = 12).
meanwhile in the S2 treatment, average exchangeable Mg2+ concentration was by 0.21 cmolc∙kg−1 significantly higher in U2 compared to U0 treatment.
Crop cycle did not have a significant effect of substrate ECe (p > 0.05) whereas statistical analyses showed that ECe was significantly affected by a salinity x urine interaction. Substrate ECe significantly increased by 7.3 (83%), 5.3 (52%) and 7.6 (49%) dS∙m−1 as urine fertilization rose from U0 to U2 in the S0, S1 and S2 salinity levels, respectively (Table 3).
There was a tendency towards an increase in CECp with mounting urine application at all NaCl treatment levels (Figure 2(a)). However, the effect of urine fertilization was only significant with the application of U2 which resulted in an increase in CECp from 15.9 (U0) to 17.8 (U2) cmolc∙kg−1 in the S0 and from 18.6 (U0) to 20.6 (U2) cmolc∙kg−1 in the S2 treatment. Additionally, CECp was by 1.4 cmolc∙kg−1 significantly higher in the U2 compared to U1-fertilized soils in the S2 treatment.
As expected, ESP increased as salinity level rose but the effect of urine fertilization on ESP was significant only in the untreated substrate (Figure 2(b)). Compared to the unfertilized treatment (U0) in the S0 treatmentESP rose by 1.6 (U1) and 6.9 (U2) representing a 46 and 78% increase.
3.3. Effect of Crop Cycle, Salinity and Urine Fertilization on Water Extractable Cations
There was no significant interaction effect of crop cycle × salinity treatment × urine fertilization on water extractable Na+. Meanwhile, the interaction effect of NaCl treatment and urine application on mean water extractable Na+ was significant (Figure 2(c)) (p < 0.05). Our data showed that the effect of urine fertilization was strongest in the S0 treatment where extractable Na+ rose by 59.3 (U1) and 66.8% (U2) compared to U0 treatment. In the S1 and S2 treatments, the application of U2 increased mean extractable Na+ by 25.7 and 19.2% compared to the U0 treatment.
ANOVA results showed that water extractable K+, Mg2+ and Ca2+ were significantly affected by crop cycle, salinity treatment and urine fertilization interactions (p < 0.05) (Table 2). With the exception of S0:U0 and S2:U2 treatment variants extractable K+ was higher in cycle I than in cycle II (Table 2). In cycle I, urine application significantly raised extractable K+ from 26.2 mg∙kg−1
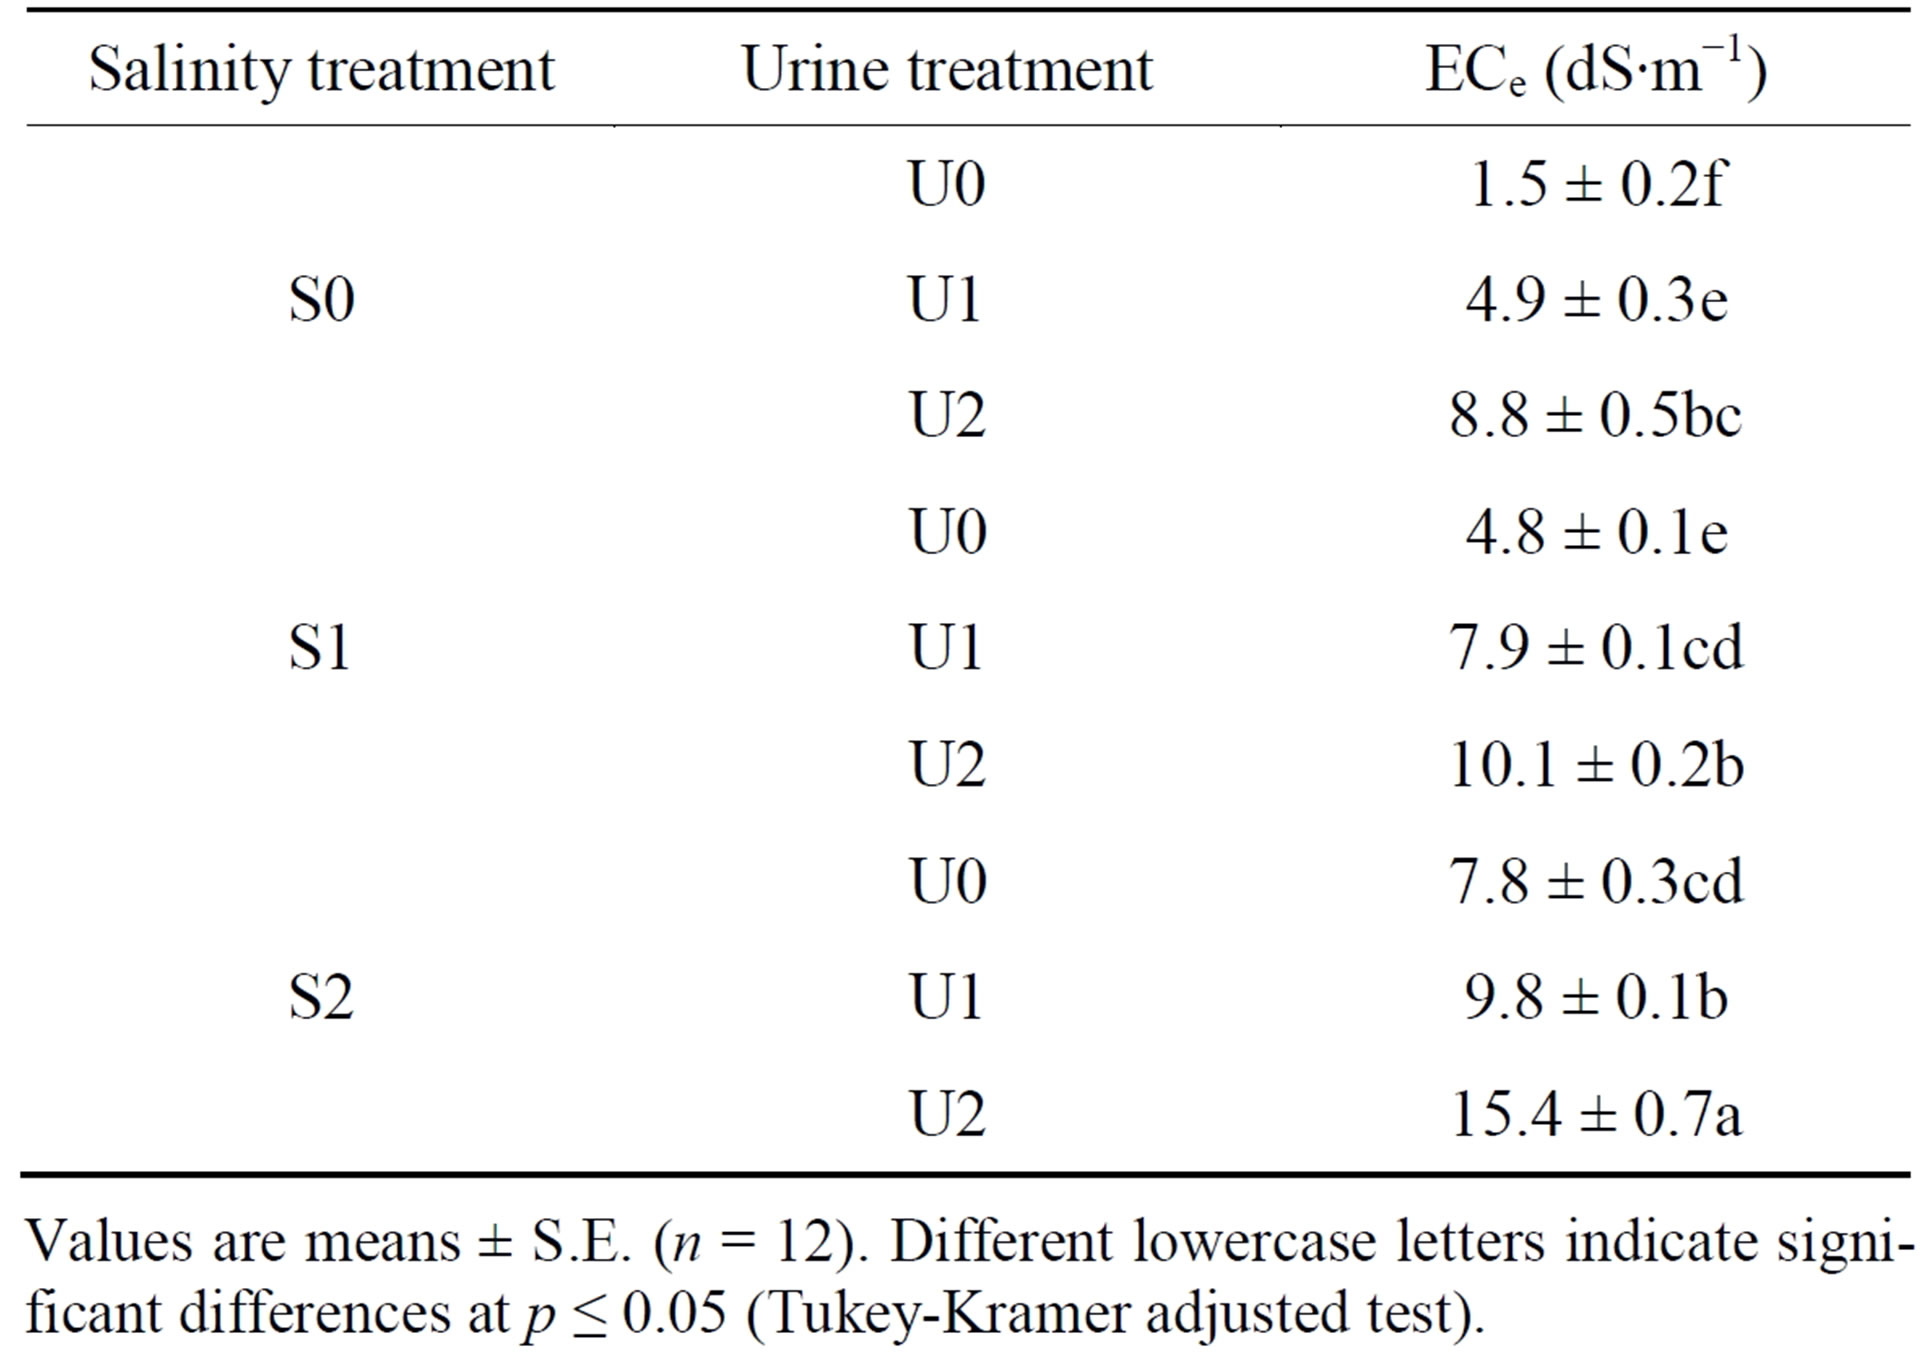
Table 3. Interactive effect of salinity treatment (S0, S1, S2) and urine fertilizer treatment (U0, U1, U2) on substrate electrical conductivity (ECe).
Values are means ± S.E. (n = 12). Different lowercase letters indicate significant differences at p ≤ 0.05 (Tukey-Kramer adjusted test).
(U0) to 47.5 mg∙kg−1 substrate (U2) and from 33.8 (U0) to 66.6 mg∙kg−1 substrate (U2) in the S1 and S2 treatments, respectively. Meanwhile, in cycle II average extractable K+ decreased by 22.9% from 23.1 (U0) to 17.8 mg∙kg−1 substrate (U1) in the S0 treatment. At the end of cycle II, there was no significant urine fertilization effect on extractable K+ content in S1 whereas in the S2 treatment it was higher by 69.9% in U0 compared to U2 treatment.
Average water extractable Mg2+ content was significantly affected by crop cycle × salinity treatment × urine interaction (F = 3.41; p = 0.0123). Extractable Mg2+ was generally higher at the end of crop cycle I compared to cycle II and increased with mounting urine application at all salinity levels (Table 2). In cycle I, compared to U0 mean extractable Mg2+ content under U2 fertilization rose by more than 45% in the S0, S1 and S2 treatments. In cycle II, whereas urine fertilization did not affect extractable Mg2+ concentration in the S0 and S2 treatments, extractable Mg2+ concentration more than doubled in the S2 treatment as urine fertilization was raised from U0 to U2 and U1 to U2.
Similarly, water extractable Ca2+ increased as urine application amount rose in crop cycle I with significantly higher mean values for U2 compared to U0 under all salinity treatments (Table 2). Mean extractable Ca2+ was by 107.6, 176.8 and 220.3 mg∙kg−1 substrate higher in U2 than U0 in the S0, S1 and S2 treatments, respectively. Meanwhile, at the end of cycle II the effect of urine fertilization was only significant with U2 application in the S2 treatment.
3.4. Effect of Crop Cycle, Salinity and Urine Fertilization on Water Extractable Anions
Our data further showed that water extractable Cl− and  were significantly affected by crop cycle, salinity
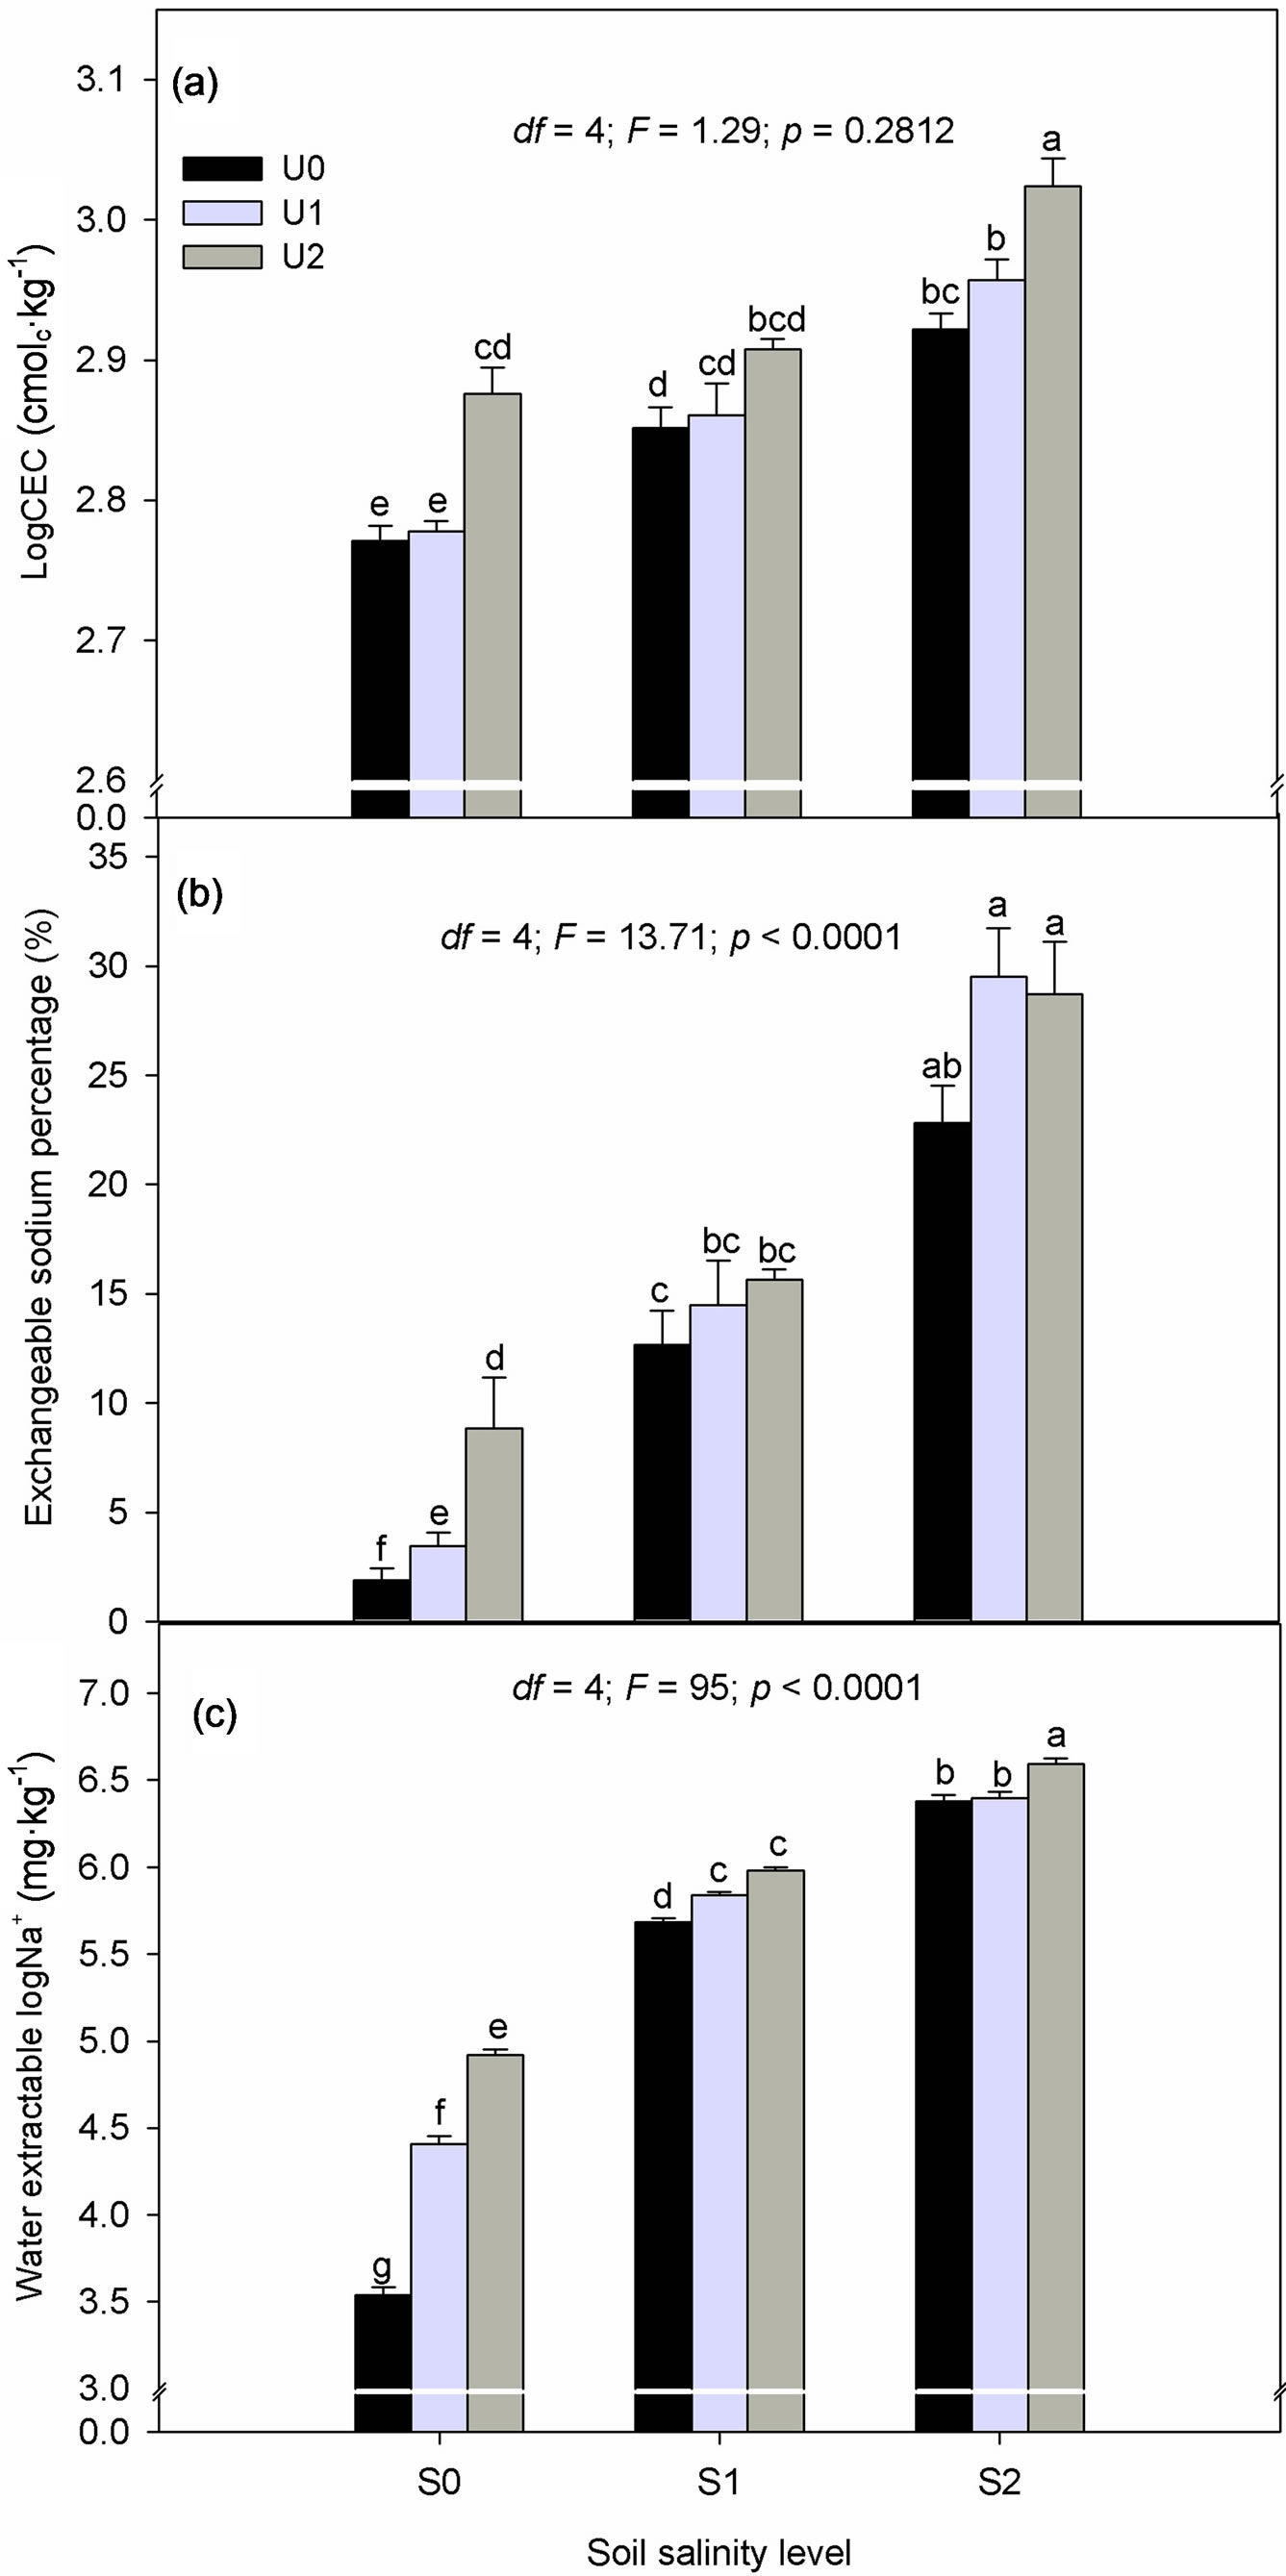
Figure 2. Interactive effect of salinity (S0, S1 and S2) and urine fertilization (U0, U1 and U2) on substrate (a) cation exchange capacity; (b) Exchangeable sodium percentage and (c) water extractable Na+. Data are means of two crop cycle ± S.E. (n = 12).
and urine interactions (p < 0.05). At the end of cycle I, water extractable Cl− increased by 87.9 and 28.9% as urine application rose from U0 to U2 in the S0 and S1 treatments, respectively. Extractable Cl− also increased from 17.6 (U0) to 86.1 mg∙kg−1 of substrate (U2) in the S0 treatment at the end of crop cycle II. No significant changes due to urine application were observed in the S1 and S2 treatments at the end of cycle II.
There was a significant crop cycle × salinity × urine interaction effect on water extractable  (F = 6.35; p = 0.0002). Soil nitrate was generally lower at the end of cycle II compared to cycle I and the effect of urine application on extractable
  was stronger at the end of cycle I compared to cycle II (Table 2). At the end of cycle I, extractable
  increased in the order of U0 < U1 < U2 regardless of salinity level. Meanwhile in cycle II, the effect of urine application was significant only at highest urine application (U2) in the S0 and S2 treatments.
As shown by our data in Figure 3(a), mean water extractable  was not affected by any interactions but the main factors (crop cycle and urine application) were significant. Compared to the unfertilized treatments (U0),
  content increased by 19.5 (U1) and 32.5% (U2) in cycle I. Like in cycle I,
  content tended to increase with mounting urine application in cycle II though the effect became significant (19.9% increase) only with the application of U2 compared to the unfertilized treatment.
A significant crop cycle × urine fertilizer interaction affected average water extractable  content (Figure 3(b)). In cycle II, water extractable
  significantly increased from 48.9 (U0) to 53.0 mg∙kg−1 substrate (U1) but a higher dose of urine did not have a significant effect on
 . In contrast,
  was not affected by urine rates in the cycle I.
4. Discussion
This paper reports the interactive effect of urine fertilization and NaCl-induced salinity on changes in substrate chemical properties under controlled greenhouse conditions. Of the changes that affect soil chemical properties, pH is considered very important as it influences the availability of plant nutrients [17]. At the end of cycle I, a slight decrease in substrate pHKCl at higher urine application in S1 and S2 treatments can be associated with nitrification and the release of H+. This effect was only temporal and by the end of cycle II substrate pHKCl increased and the effect of urine fertilization was no longer significant. Fluctuating pH resulting from urine deposition in pasture lands has also been reported by Haynes and William [18] while Hoglund [19] has argued that the net effect of urine fertilizer on soil pH is small due to the release of hydroxides when plants take up the supplied N in the form of nitrate ions.
Our results showed that substrate ECe rose as urine fertilizer amount increased in agreement with earlier research findings [8,11,12]. As urine is inherently saline, high dosages of urine entailed higher amount of salts added to the cultivation substrate. Although under field conditions leaching of salts from the soil may occur due to precipitation, the high electrical conductivities resulting from the application of urine in our experiments suggests that in the long term salt build up may occur even in fields. To prevent soils degradation due to urineinduced salinity, salinity management measures should be included in urine fertilization programs. Mnkeni et al. [12] have suggested that a well-adapted crop rotation system with salt-tolerant varieties and halophytic vegetables might reduce the potential risk of an eventual salt build resulting from urine fertilization.
The application of ammoniacal N fertilizer has been shown to cause a decrease in soil exchangeable Ca2+, Mg2+ and cation exchange capacity due to leaching losses [20]. Increased exchangeable Ca2+, Mg2+ and K+ observed in our study resulted from their addition through urine and were expected as leachate was returned to the substrate throughout the experiments. An increase in soil cations due to urine fertilization has also been reported in field trials [21,22]. The high content of water extractable
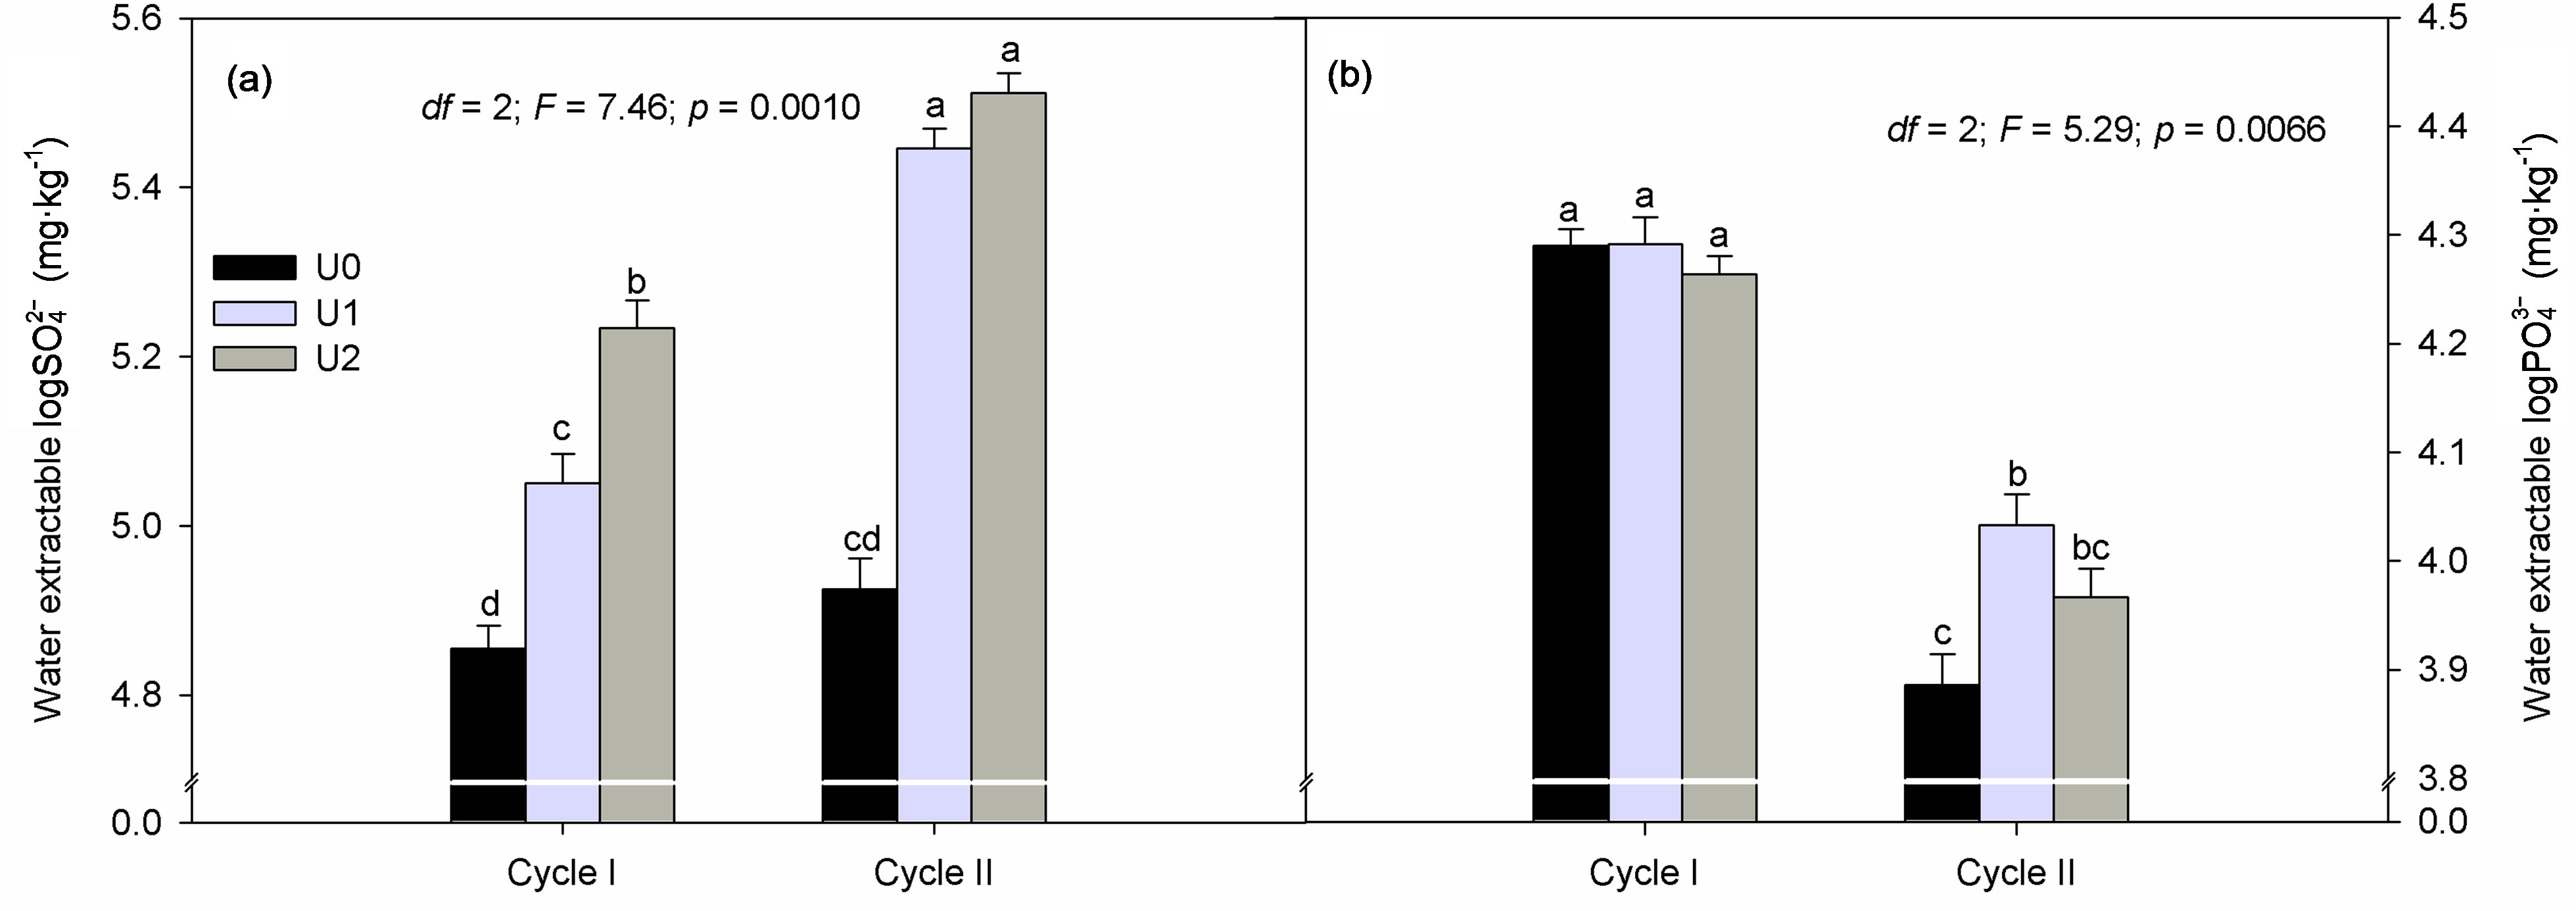
Figure 3. Effect of crop cycle (cycle I, II) and urine fertilization (U0, U1 and U2) on substrate extractable (a)  and (b)
 . Data are means ± S.E. (n = 12: cycle I; n = 24: cycle II). Significant differences (p < 0.05) between treatments are indicated by small case letters.
Ca2+ and Mg2+ in the substrate at the end of crop cycle I due to urine fertilization represent the portion of these cations that can potentially be leached from the soil profile. However, if they are not leached as was the case in our experiments these nutrient cations can become available to the second crop or next season. Reduction in water soluble Ca2+ and Mg2+ at the end of crop cycle II can partly be explained by their precipitation in the soil solution in agreement with Miyazawa et al. [23].
Generally, the concentration of Na+ in urine is manifold higher than that of Ca2+ and Mg2+ and therefore, requires attention in urine fertilizer planning especially under saline conditions. Although Na+ is noted for its functional role as a plant nutrient, high concentrations in the growing medium promotes competition with K+, Ca2+ and Mg2+ that can result in toxic concentrations in plant tissue [24-26]. The N to Na+ mass-ratio of the urine used in this study was 3.1:1 but decreased to 2.2:1 following N losses from urine prior to the start of crop cycle II. The risk of raising Na+ supply through urine application increases with N losses and should be prevented. This is because more urine will have to be applied if the N content is lowered. Lower N to NaCl mass ratio for urine collected in Ghana has been reported by Germer et al. [21]. Therefore, the increase in exchangeable and water extractable Na+ with mounting urine application was expected. Haynes and Williams [18] reported an increase in the concentrations of exchangeable K+ and Na+ in pasture land due to sheep urine application. It was notable that in the S2 treatment, the effect of urine fertilization on exchangeable Na+ concentration was masked by the high content of Na+ in the soil substrate solution which is related to the use of NaCl to induce salinity. This suggests that there is a critical limit to the effect of Na+ supplied through urine on the concentration of exchangeable Na+ in a NaCl-dominated soil substrate. However, this critical limit cannot be determined from our study and would require further investigation.
In this study, it was also expected that due to the high concentration of Na+ compared to Ca2+ and Mg2+, urine fertilization will increase sodicity with a more severe effect in the NaCl-treated substrates. According to Abrol et al. [27] an ESP of 15% and a pH greater than 8.5 are critical for soils to be classified as sodic or saline-sodic if in addition ECe is greater than 4 dS∙m−1. Our results showed that though in the S0 treatment ESP increased as the amount of urine fertilizer rose, the effect of urine fertilization became less important in the S1 (ECe 4.6 dS∙m−1) and S2 (ECe 7.6 dS∙m−1) treatments due to the dominating effect of Na+ added through NaCl. Besides, as noted above, overall substrate pHKCl remained below 8.5. In spite of the amount of Na+ added through urine it is clear from our results that salinity is of greater concern than sodicity.
Results of this study suggest that Cl− content of urine fertilizer is an important factor in determining the concentration of Cl− in the soil. Chloride is generally considered as an essential micronutrient; however, excessive supply of Cl− can have a toxic effect on plant growth [28]. Therefore regulations for the application of urine fertilizers should consider the risk of elevated chloride levels that may cause toxicity in plants [29].
The increase in substrate  with mounting urine application was expected due to the high concentration of
  in urine. Of the secondary nutrients contained in urine,
  had the highest concentration and can therefore be used to correct S deficiency. However, in areas where precipitation is high, the leaching of
  supplied through urine can become an important concern and should be considered in urine fertilization planning.
Phosphate concentration was not affected by urine application in crop cycle I probably due to the basal application. The significant decrease in substrate  at the end of crop cycle II is due to plant uptake and precipitation [30]. Meanwhile, higher concentration of
  in urine treated substrate is related to addition through urine.
Our results showed an increase in substrate  as urine application amount rose which is in agreement with the findings of Decau et al. [31] and Williams et al. [32] who measured high concentrations of soil
  in grasslands following urine deposition from cattle. Once applied to the soil urine-N undergoes different changes. Ammonium which is the major form of N in stored urine is either taken up directly by plants or nitrified to
  which is also an available form for plant uptake. Some of the
  can be taken up by microorganisms (immobilization) or microbially reduced (de-nitrification) to produce gaseous nitrogen that is eventually lost from the soil through volatilization. In a lysimeter study, Di and Cameron [33] measured significant
  -N leaching losses as the amount of urine-N application increased. No N losses in our experiment can be attributed to leaching as leachate was returned to the respective pots. Therefore, lower substrate
  concentration measured in our substrates at the end of the cycle II can be explained by immobilization or volatilization losses. The significantly high substrate
  concentration in the S2:U2 treatment variant in both cropping cycles can be attributed to the plant’s inability to take up supplied nitrogen due to high salinity [34,35].
As pot sizes and the artificial environment under which these investigations were carried out are limiting, our results are meant to present a snapshot of the changes in soil chemical properties that may result from urine fertilization at different level of NaCl salinity. An understanding of the changes imposed by urine fertilization on soil chemical properties under saline conditions is important for urine fertilization planning and management.
5. Conclusion
The potential of urine to cause an increase in exchangeable Ca2+ and Mg2+ depends on the amount of urine applied regardless of NaCl concentration level. An average urine dosage of 270 mg∙kg−1 substrate over two crop cycles can increase soil ECe by up to 3.5-folds representing a severe salinity risk if urine is used to fertilize potted plants. In confirmation with our hypothesis, urine fertilization induced an increase in substrate exchangeable Na+ content and ESP under non-saline conditions (ECe 1.3 dS∙m−1) but the perceived effect under NaCl treatments was minimal. However, regularly monitoring salinity and/or sodicity build up and adopting appropriate management strategies must also be thought of during urine fertilizer planning. To develop a guideline for urine use under saline conditions, a long term investigation on urine × salinity interaction under field conditions would be necessary.
Acknowledgements
This study was partly supported by a scholarship from the Catholic Academic Exchange Service (KAAD), Germany. The authors are also grateful for the laboratory support of Mrs. Beate Podtschaske, Mrs Böttcher Annerose and Mrs. Helene Ochott.
REFERENCES
- D. B. Lobell, J. I. Ortiz-Monsterio, F. C. Gurrola and L. Valenzuuela, “Identification of Saline Soils with Multiyear Remote Sensing of Crop Yields,” Soil Science Society of America Journal, Vol. 71, No. 3, 2007, pp. 777- 783. http://dx.doi.org/10.2136/sssaj2006.0306
- S. A. Hague, “Salinity Problems and Crop Production in Coastal Regions of Bangladesh,” Pakistan Journal of Botany, Vol. 38, No. 5, 2006, pp. 1359-1365.
- M. Morris, V. A. Kelly, R. J. Kopicki and D. Byerlee, “Fertilizer Use in African Agriculture: Lessons Learned and Good Practice Guidelines,” The World Bank, Washington DC, 2007. http://dx.doi.org/10.1596/978-0-8213-6880-0
- H. Kirchmann and S. Pettersson, “Human Urine—Chemical Composition and Fertilizer Use Efficiency,” Fertilizer Research, Vol. 40, No. 2, 1995, pp. 149-154. http://dx.doi.org/10.1007/BF00750100
- E. Münch and M. Winker, “Technology Review, Urine Diversion Components Overview of Urine Diversion Components such as Waterless Urinals, Urine Diversion Toilets, Urine Storage and Reuse Systems,” Deutsche Gesellschaft für Internationale Zusammenarbeit (GIZ) GmbH, Eschborn, 2009.
- P. Morghan, “Toilets that Make Compost: Low Costs, Sanitary Toilets that Produce Valuable Compost for Crops in an African Context,” Stockholm Environmental Institute, Sweden, 2007.
- S. Pradhan, J. K. Holopainen, J. Weisell and H. Heinonen-Tanski, “Human Urine and Wood Ash as Plant Nutrients for Red Beet (Beta vulgaris) Cultivation: Impacts on Yield Quality,” Journal of Agricultural and Food Chemistry, Vol. 58, No. 3, 2010, pp. 2034-2039. http://dx.doi.org/10.1021/jf9029157
- M. Y. Boh, T. Müller and J. Sauerborn, “Maize (Zea mays L.) Response to Urine and Wood Ash Fertilization under Saline (NaCl) Soil Conditions,” International Journal of AgriScience, Vol. 3, No. 4, 2013, pp. 333-345.
- H. Jonsson, A. R. Stintzing, B. Vinnerås and E. Salomon, “Guidelines on the Use of Urine and Feaces in Crop Production,” Stockholm Environmental Institute (SEI), Sweden, 2004.
- World Health Organization, “WHO Guidelines for the Safe Use of Wastewater, Excreta and Greywater,” Vol. 4, Geneva, 2006.
- B. Beler-Baykal, A. D. Allar and S. Bayram, “Nitrogen Recovery from Source-Separated Human Urine Using Clinoptilolite and Preliminary Results of Its Use as Fertilizer,” Water Science and Technology, Vol. 63, No. 4, 2011, pp. 811-817. http://dx.doi.org/10.2166/wst.2011.324
- P. N. S. Mnkeni, F. R. Kutu, P. Muchaonyerwa and L. M. Austin, “Evaluation of Human Urine as a Source of Nutrients for Selected Vegetables and Maize under Tunnel House Conditions in the Eastern Cape, South Africa,” Waste Management Research, Vol. 26, No. 2, 2008, pp. 132-139. http://dx.doi.org/10.1177/0734242X07079179
- L. A. Richards, “Diagnosis and Improvement of Saline and Alkali Soils,” United States Department of Agriculture, 1954.
- B. Vinnerås, A. Nordin, C. Niwagaba and K. Nyberg, “Inactivation of Bacteria and Viruses in Human Urine Depending on Temperature and Dilution Rate,” Water Research, Vol. 42, No. 15, 2008, pp. 4067-4074.
- W. H. Hendershot and M. Duquette, “A Simple Barium Chloride Method for Determining Cation Exchange Capacity and Exchangeable Cations,” Soil Science Society of America Journal, Vol. 50, No. 3, 1986, pp. 605-608. http://dx.doi.org/10.2136/sssaj1986.03615995005000030013x
- M. Seilsepour, M. Rashidi and B. G. Khabbaz, “Prediction of Soil Exchangeable Sodium Percentage Based on Soil Sodium Adsorption Ratio,” American-Eurasian Journal of Agriculture and Environmental Science, Vol. 5, No. 1, 2009, pp. 1-4.
- M. Bagayoko, S. Alvey, G. Neumann and A. Buerkert, “Root-Induced Increases in Soil pH and Nutrient Availability to Field-Grown Cereals and Legumes on Acid Sandy Soils of Sudano-Sahelian West Africa,” Plant and Soil, Vol. 225, No. 1-2, 2000, pp. 117-127. http://dx.doi.org/10.1023/A:1026570406777
- R. J. Haynes and P. H. Williams, “Changes in Soil Solution Composition and pH in Urine-Affected Areas of Pasture,” Journal of Soil Science, Vol. 43, No. 2, 1992, pp. 323-334. http://dx.doi.org/10.1111/j.1365-2389.1992.tb00140.x
- C. Hoglund, “Evaluation of Microbial Health Risks Associated with Reuse of Source Separated Human Urine,” Ph.D. Dissertation, Royal Institute of Technology (KTH), Sweden, 2001.
- P. Barak, B. O. Jobe, A. R. Krueger, L. A. Peterson and D. A. Laird, “Effect of Long-Term Soil Acidification Due to Nitrogen Fertilizer Inputs,” Plant and Soil, Vol. 197, No. 1, 1997, pp. 61-69. http://dx.doi.org/10.1023/A:1004297607070
- J. Germer, S. Addai and J. Sauerborn, “Response of Grain Sorghum to Fertilisation with Human Urine,” Field Crops Research, Vol. 122, No. 3, 2011, pp. 234-241. http://dx.doi.org/10.1016/j.fcr.2011.03.017
- O. O. AdeOluwa and O. Cofie, “Urine as an Alternative Fertilizer in Agriculture: Effects in Amaranths (Amaranthus caudatus) Production,” Renewable Agriculture and Food Systems, Vol. 27, No. 4, 2012, pp. 287-294. http://dx.doi.org/10.1017/S1742170511000512
- M. Miyazawa, M. A. Pavan, C. O. Ziglio and J. C. Franchini, “Reduction of Exchangeable Calcium and Magnesium in Soil with Increasing pH,” Brazilian Archives of Biology and Technology, Vol. 44, No. 2, 2001, pp. 149- 153. http://dx.doi.org/10.1590/S1516-89132001000200007
- G. V. Subarao, O. Ito, W. L. Berry and R. M. Wheeler, “Sodium—A Functional Plant Nutrient,” Critical Reviews in Plant Sciences, Vol. 22, No. 5, 2003, pp. 391-416.
- C. E. Brown, S. R. Pezeshki and R. D. DeLaune, “The Effects of Salinity and Soil Drying on Nutrient Uptake and Growth of Spartina alterniflora in a Simulated Tidal System,” Environmental and Experimental Botany, Vol. 58, No. 1-3, 2006, pp. 140-148. http://dx.doi.org/10.1016/j.envexpbot.2005.07.006
- S. R. Grattan and C. M. Grieve, “Salinity—Mineral Nutrients Relations in Horticultural Crops,” Scientia Horticulturae, Vol. 78, No. 1-4, 1998, pp. 127-157. http://dx.doi.org/10.1016/S0304-4238(98)00192-7
- I. P. Abrol, J. S. P. Yadav and F. I. Massoud, Eds., “SaltAffected Soils and Their Management,” Food and Agricultural Organization of the United Nations, 1988.
- P. J. White and M. R. Broadley, “Chloride in Soils and Its Uptake and Movement within the Plant: A Review,” Annals of Botany, Vol. 88, No. 6, 2001, pp. 967-988. http://dx.doi.org/10.1006/anbo.2001.1540
- E. Tavakkoli, P. Rengasamy and G. K. McDonald, “High Concentrations of Na+ and Cl– Ions in Soil Solution Have Simultaneous Detrimental Effects on Growth of Faba Bean under Salinity Stress,” Journal of Experimental Botany, Vol. 61, No. 15, 2010, pp. 4449-4459. http://dx.doi.org/10.1093/jxb/erq251
- R. Wandruzska, “Phosphorus Retention in Calcareous Soils and Its Effect on Organic Matter and Its Mobility,” Geochemical Transactions, Vol. 7, No. 6, 2006. http://dx.doi.org/10.1186/1467-4866-7-6
- M. L. Decau, J. C. Simon and A. Jacquet, “Nitrate Leaching under Grassland as Affected by Mineral Nitrogen Fertilization and Cattle Urine,” Journal of Environmental Quality, Vol. 33, 2004, pp. 637-644.
- P. H. Williams, S. C. Jarvis and E. Dixon, “Emission of Nitric Oxide and Nitrous Oxide from Soil under Field and Laboratory Conditions,” Soil Biology and Biochemistry, Vol. 30, No. 14, 1998, pp. 1885-1893. http://dx.doi.org/10.1016/S0038-0717(98)00052-2
- H. J. Di and K. C. Cameron, “Nitrate Leaching Losses and Pasture Yields as Affected by Different Rates of Animal Urine Nitrogen Returns and Application of a Nitrification Inhibitor—A Lysimeter Study,” Nutrient Cycling in Agroecosystems, Vol. 79, No. 3, 2007, pp. 281-290. http://dx.doi.org/10.1007/s10705-007-9115-5
- M. R. Ward, M. Aslam and R. C. Huffaker, “Enhancement of Nitrate Uptake and Growth of Barley Seedlings by Calcium under Saline Conditions,” Plant Physiology, Vol. 80, No. 2, 1986, pp. 520-524. http://dx.doi.org/10.1104/pp.80.2.520
- D. C. Bowman, G. R. Cramer and D. A. Devitte, “Effect of Salinity and Nitrogen Status on Nitrogen Uptake on Tall Fescue Turf,” Journal of Plant Nutrition, Vol. 29, No. 8, 2006, pp. 1481-1490. http://dx.doi.org/10.1080/01904160600837584