Open Journal of Soil Science
Vol.3 No.2(2013), Article ID:32583,9 pages DOI:10.4236/ojss.2013.32010
Initial Field Evaluation of the Agro-Economic Effects of Determining Nitrogen Fertilizer Rates with a Recently-Developed Soil Test Methodology
![]()
Grassland, Soil and Water Research Laboratory, USDA-Agricultural Research Service (ARS), Temple, Texas, USA.
Email: *daren.harmel@ars.usda.gov
Copyright © 2013 R. Daren Harmel, Richard L. Haney. This is an open access article distributed under the Creative Commons Attribution License, which permits unrestricted use, distribution, and reproduction in any medium, provided the original work is properly cited.
Received April 2nd, 2013; revised May 3rd, 2013; accepted May 12th, 2013
Keywords: Soil Tests; Crop Yields; On-Farm Profit; Water Quality
ABSTRACT
Although agriculture is not the only contributor of excess nutrients to US waters, agriculture is an important contributor and should do its part to reduce nutrient loading. One important step in reducing agricultural contribution is to accurately account for all sources of plant available nutrients so that only needed nutrients are applied. In this study, three fertilizer rate treatments were evaluated: no fertilizer (control), traditional rate, and reduced rate based on a recently-developed enhanced soil test methodology. For each of nine sites in Texas, fertilizer data (formulation, rate, cost, and application date) and crop data (yield, price, and harvest date) were recorded, and economic throughput (profit) was determined. In this four year study, fertilizer rates were reduced 30% - 50% (and fertilizer costs reduced 23% - 39%) based on enhanced soil test methodology recommendations for wheat, corn, oats, and grain sorghum, but yields were not significantly reduced (0% - 6%) and oat yields actually increased 5%. Profit decreased <1% for corn and increased 7% - 18% for wheat, oats, and grain sorghum with reduced fertilizer rates. Although these changes were not statistically significant, they do represent benefit through increased profit potential and decreased input cost and production risk. In only 6% of the time was the traditional fertilizer rate the most profitable, compared to 51% for the unfertilized treatment and 43% for the enhanced soil test treatment. These results do not indicate that fertilizer application should be avoided but that fertilizer rates should be carefully chosen considering all sources of plant available nutrients (e.g., mineralization, irrigation water, nutrients deeper in the soil profile) to ensure that fertilizer is applied at the optimal rate.
1. Introduction
Minimizing off-site nutrient losses and increasing efficiency are desirable fertilizer utilization goals from multiple perspectives including the fertilizer industry, agricultural producers, and environmental interests [1]. As such, one key to effective fertilization is accurate determination of the amount of fertilizer to apply. Fertilizer application rates are typically determined based on traditional practices or recommendations from fertilizer dealers, crop consultants, or soil testing laboratories. The basis of these determinations, whether cultural or scientific, was established during the period from the 1960’s through the 1980’s in which fertilizer costs remained low [2,3]. Under the prolonged low fertilizer cost conditions, it was typically cost-effective to apply excess fertilizer to ensure that yields would not be limited by N deficiency, even under ideal growing conditions. However, recent cost increases for fertilizer and other inputs have affected this relationship between agronomic and economic factors [3], so traditional N rates may not be economically optimal. Excess N fertilizer application unnecessarily increases input costs for agricultural producers and potentially reduces profit.
In addition to on-farm economic impact, a great deal of attention is now given to potential offsite losses of fertilizer nutrients, specifically N and P. Excessive nutrient input to streams, rivers, lakes, estuaries, and oceans continues to degrade ecological function, increase water treatment cost, and decrease recreational opportunities. Although numerous sources (e.g., agricultural and urban fertilization, waste water treatment facilities, septic systems, wildlife, background) contribute nutrients, agriculture remains a substantial contributor [4]. Dramatic examples of the problems caused by excess nutrients in water are the hypoxic (low oxygen) area in the Gulf of Mexico, which is absent of most marine life, and degradation of the Chesapeake Bay, which has severely impacted fish, crab, oyster, and waterfowl habitat. As such, enhanced methods and novel approaches are needed to optimize fertilizer application to maximize on-farm profitability and minimize movement off-site.
Whereas soil biology has been traditionally overlooked in terms of contributing plant available nutrients in crop production systems, the importance of soil boilogy along with chemical and physical properties on soil fertility has been clearly demonstrated in recent years. See [5] for comprehensive scientific overview of the biological components and processes related to soil fertility. The considerable decline in soil organic matter in many regions has prompted more careful consideration of farming systems that more efficiently benefit from biological processes that contribute to soil fertility [5]. In addition, the USDA-NRCS 590 Nutrient Management Standard [6] clearly acknowledges the importance of considering all sources of plant available nutrients “including, but not limited to, green manures, legumes, crop residues, compost, animal manure, organic by-products, biosolids, waste water, organic matter, soil biological activity, commercial fertilizer, and irrigation water”.
However, soil N tests as typically applied determine only inorganic N in the form of NO3-N and often ignore the plant available NH4-N component. Conventional tests also do not typically account for the plant available mineralizable portion of the soil organic N pool although soil organic matter provides plant available N as soil microbes mineralize organic C and thus organic N. Since, conventional soil N tests do not account for all forms of plant available N in the soil they often overestimate fertilizer N requirements.
Thus, a series of targeted research studies was initiated in 1996 to improve the ability of soil tests to determine plant available N. The fundamental component of the resulting soil test methodology is the Solvita® 1-day CO2-C method, which uses soil microbial activity to rapidly estimate N mineralization [7]. This test was based on the theory that soil microbial activity provides a snapshot of inherent soil fertility since a majority of soil nutrients are cycled through the soil microbial biomass. Generally, the more fertile the soil, the more CO2-C is produced in 24 hrs as soil microbes mineralize organic N. Consistently drying soil samples prior to analysis (for both microbial and chemical analysis) is critical to achieving a standardized method by which soil test labs can achieve uniformity of analysis. A rapid soil rewetting technique that relies on capillary action for rewetting dry soil was developed [8]. This fast and simple method designed for soil testing and agricultural research laboratories can be easily applied to perform the Solvita® 1-day CO2 test for soil microbial activity. This soil test methodology also includes a novel extractant that extracts nutrients at near-ambient soil pH levels, which is desirable because soil pH and P solubility are highly interrelated [9,10]. This extractant, H3A [11] and its modifications, were designed to mimic the soil environment by containing the organic acids that plant roots exude to acquire necessary nutrients [12,13] instead of harsh acids or bases.
While the recently-developed enhanced soil test (EST) methodology [7,8,11,14,15] is being rapidly adopted by university and commercial soil testing laboratories, its impacts on on-farm profitability have not been assessed in the field. As expressed [16], it is important to evaluate the performance of fertilizer practices, in this case fertileizer N rate determination by the EST methodology, in the cropping systems in which they are applied.
Thus, the objective of this study was to evaluate the on-farm agro-economic effects (i.e., fertilizer cost, crop yield, and profit as represented by economic throughput) of basing N fertilizer rates on the EST methodology, which includes biological and chemical tests. The specific questions of interest were: Does reducing fertilizer rates based on EST results that include biological contribution reduce crop yields? Are on-farm profits affected by basing fertilizer rates on the EST results?
2. Methods
2.1. Site Description
To evaluate these agro-economic effects, nine research sites were established across central and north central Texas (Figure 1). Seven of these sites were located on private land, and two were located on USDA-ARS Grassland, Soil and Water Research Laboratory property near Riesel and Temple. At each site, at least one field was randomly selected to receive N and P fertilizer based on the EST methodology (referred to as the EST treatment, Table 1). At least one field was selected to receive fertilizer based on landowner preference as determined by traditional rates and/or conventional soil test methods (referred to as Traditional treatment, Table 1). At least one control field that received no fertilizer was also established at each site. At each site all of the fields received the same tillage, herbicide, pesticide, and yield goal and were planted and harvested at the same time; only the fertilizer rate differed. The annual crop choice for each site was made by the producer based on typical practices.
A total of nine sites were studied for 4 yr, but data
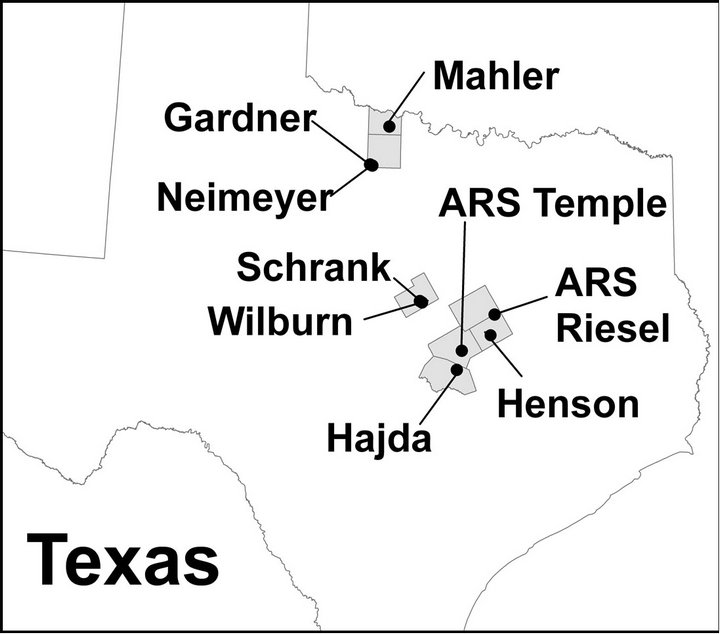
Figure 1. Locations of research sites.
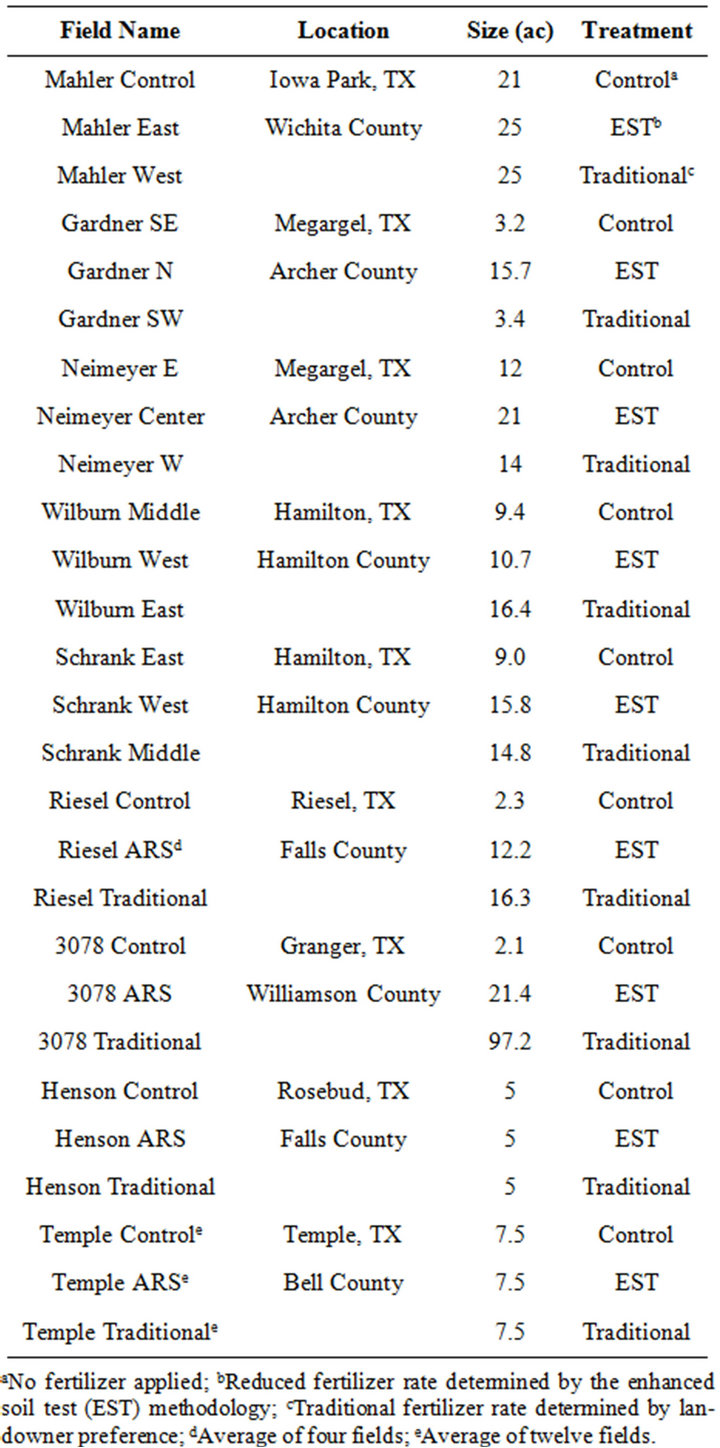
Table 1. Name, location, size, and treatment for each field at the nine research sites.
were not available at one site in 2009 and 2011. However, another site was added by the landowner in 2012. Thus, a total of 35 site years of data were collected (referred to henceforth as years or yr).
2.2. Data Collection
Before establishing the sites, soil samples were taken from each field to ensure that no inherent differences existed between fields. Soil sampling was repeated annually to determine the soil nutrient status. Between 10 and 20 samples were collected with a manual soil probe (2.54 cm diameter) and a sampling depth of 15 cm and composited for each field.
For each field, fertilizer data (formulation, rate, cost, and application date) and crop data (yield, price, and harvest date) were recorded. Other management activities and their associated costs were not recorded because they were the same across treatments and thus were not considered in economic analysis. Economic throughput as an indication of profit was determined as the difference between revenue and variable (fertilizer) costs including application.
2.3. Determining Fertilizer Rates for the Enhanced Soil Test Treatment
For the EST treatment fields, soil samples were analyzed [7,8,11,14,15] to determine total plant available N and P in the soil. Then, based on a reasonable producer-defined crop yield goal, nutrients required per unit production were estimated. The difference between N required and N available represented the additional crop N need, which was met with added N fertilizer in the EST treatments.
2.4. Data Analysis
To determine the on-farm agro-economic effects, fertileizer rates, fertilizer costs, crop yields, and economic throughout were compared for the EST, Traditional, and Control (no fertilizer) treatments. The major null hypothesis evaluated was that there are no differences in average profit between the EST, Traditional, and Control fertilizer treatments (Equation (1))
 (1)
(1)
where: μEST = mean annual profit for EST fertilizer treatment, μTrad = mean annual profit for Traditional fertilizer treatment, and μControl = mean annual profit for Control fertilizer treatment.
Possible differences in mean values of fertilizer rates, fertilizer costs, crop yields, and profit for each fertilizer treatment were evaluated with 1-way ANOVA followed by Tukey’s mean separation test with a family error rate of 5%. All statistical tests were conducted with Minitab software [17] according to procedures described in [18, 19].
3. Results and Discussion
Results for N application rates, fertilizer costs, crop yield, and profit by crop type are presented in Table 2 and discussed subsequently (see Tables 3-6 for comprehensive data). To make relative comparisons between historical yields and yields during this study, yields lower than 20% below the 1990-2008 county averages [20] are noted as “below” average, yields greater than 20% above the county average are noted as “above” average, and yields within 20% of the county average are “normal. In addition, average annual profits for each site are presented (Table 6) and discussed.
3.1. Wheat
Wheat yields in 2009-2011 were normal to below average because of drought conditions, but 2012 yields were typically normal to above average, which overall provided a good representation of typical interannual yield variation (4 yr above, 3 yr normal, 7 yr below). In the 14 yr of wheat production in this study, traditional N rates ranged from 30 - 80 lb/ac (Table 3), whereas EST recommendations ranged from 13 - 51 lb/ac, which on average produced a 50% reduction in N fertilizer applied (Table 2). Accordingly, average fertilizer costs were reduced 39%. The significant reductions in fertilizer applied and fertilizer costs did not, however, produce significant changes in wheat yield or profit partially due to interannual variability in yields and commodity prices. Reduced fertilizer application from EST recommendations, reduced average yields 1 bu/ac (−4%) but increased profit $10/ac (+8%). The traditional fertilizer rate treatment was not the most profitable in a single year (Table 2). The control treatment was the most profitable in 6 yr, and the EST treatment was most profitable in 8 yr. Although not statistically significant, a potential increase in annual profit of $10/ac is substantial in the real world. In any case, the $15/ac reduction in fertilizer costs did decrease risk whether or not the increase in profit was statistically significant.
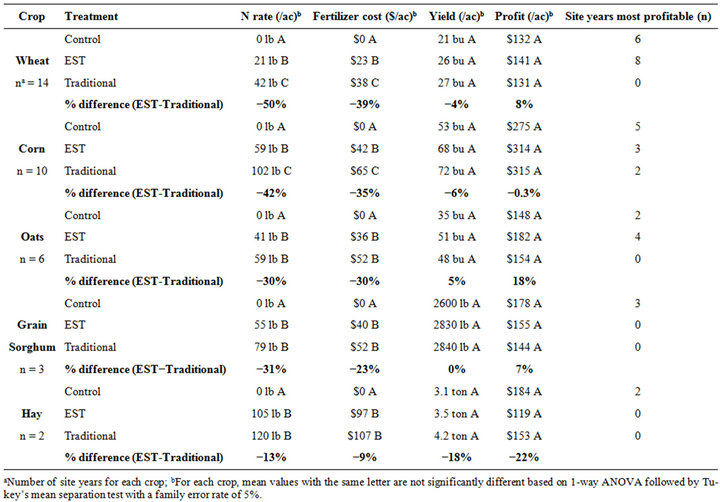
Table 2. Summary of results for each crop presented as mean values of N rate, fertilizer cost, yield, and economic throughput (profit). The most profitable treatment in terms of the number of site years is also presented.
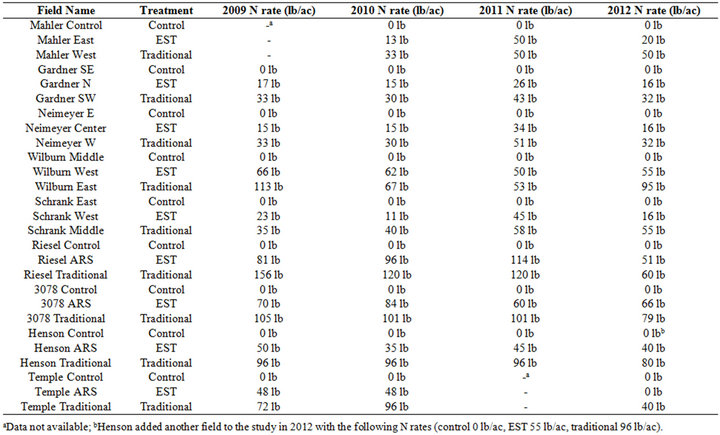
Table 3. N fertilizer rate for each study field.
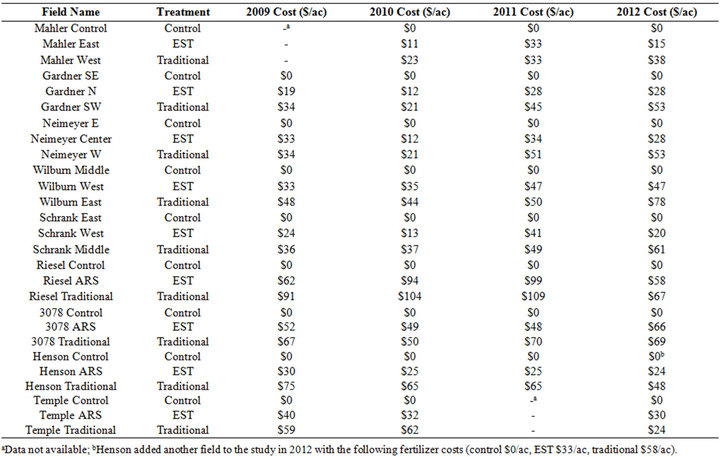
Table 4. Fertilizer costs for each study field.
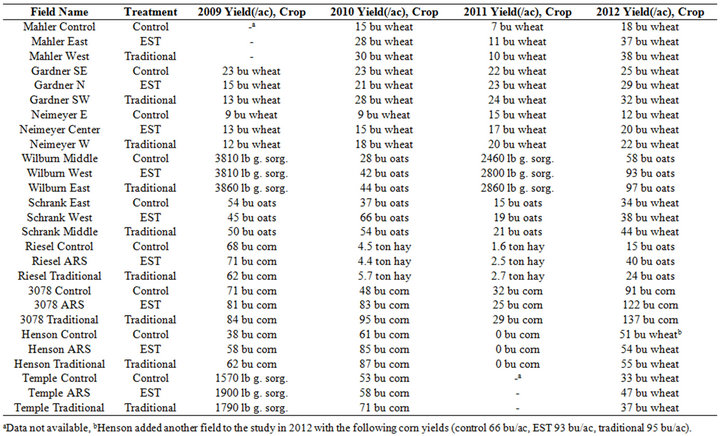
Table 5. Crop type and yield for each study field.
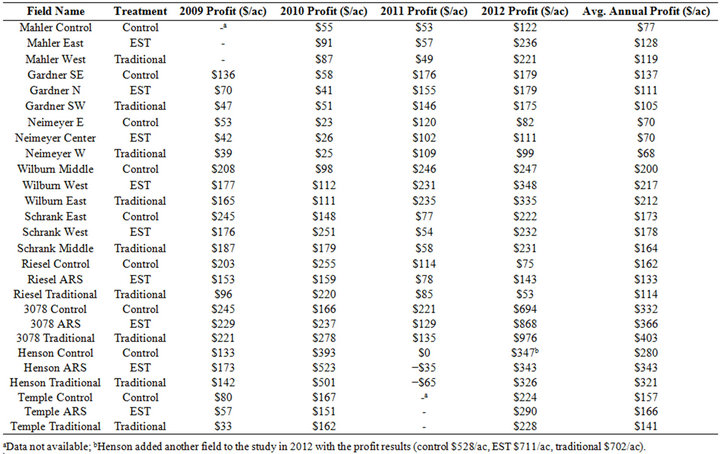
Table 6. Economic throughout or profit (fertilizer cost minus crop revenue) for each study field.
3.2. Corn
In the 10 yr of corn production in this study, corn yields were above county averages in 1 yr, normal 6 yr, and below 3 yr. Traditional N rates for corn ranged from 79 - 156 lb/ac (Table 3), whereas EST recommendations ranged from 35 - 84 lb/ac, which on average produced a 42% reduction in N fertilizer applied (Table 2). Accordingly, average fertilizer costs were reduced 35%. The significant reductions in fertilizer applied and fertilizer costs did not, however, produce significant changes in corn yield or profit partially due to interannual variability. With the EST recommendations, yields were reduced 4 bu/ac (−6%) and profit decreased $1/ac (−0.3%). Overall, the control or EST treatments were the most profitable in 8 of 10 years; however, the traditional fertilizer rate treatment was the most profitable in 2 yr at the 3078 site (Table 6). These were the only 2 yr out of 35 in the study in which the traditional fertilizer rate the most profitable (Table 2). At the 3078 site, the EST fertilizer rate decreased annual average profit by $36/ac largely due to the extremely high yield (137 bu/ac) and profit ($976/ac) in 2012. For the other sites, the EST recommendations increased annual average profit $23/ac.
3.3. Oats
In the 6 yr of oats production in this study, oats yields ranged from below average to above average with 2 yr above, 3 yr normal, and 1 yr below. EST recommendations reduced N application and fertilizer costs by 30% (Table 2); however, these reductions were not significant according to statistical tests. Similar to wheat and corn, fertilizer reductions did not produce significant changes in yield or profit; however, yields actually increased 3 bu/ac (+5%) and profit increased $28/ac (+18%) with EST recommendations, which are important results. For oats, there was no year in which the traditional fertilizer rate treatment was the most profitable (Table 2). The control treatment was the most profitable in 2 yr, and the EST treatment was most profitable in 4 yr.
3.4. Grain Sorghum
Grain sorghum yields were above average, normal, and below average 1 yr each of the 3 yr of grain sorghum production. EST recommendations reduced N application to grain sorghum by 31% and fertilizer costs by 23% (Table 2); however, these reductions were not significant according to statistical tests. As with the other crops, fertilizer reductions did not produce significant changes in yield or profit. Average grain sorghum yields did not change (0%) and profit increased $11/ac (+7%) with EST recommendations. For grain sorghum the control (no fertilizer) treatment produced the highest average profit and was the most profitable each year (Table 2). These results, based on only 3 yr of data, in no way indicate that fertilizer should not be applied for grain sorghum production, but instead emphasize that fertilizer application should be carefully examined to ensure that fertilizer is applied at the economically-optimal rate.
3.5. Hay
Hay grazer yields were above average 1 yr and normal 1 yr. EST recommendations reduced N application by 13% and fertilizer costs by 9% (Table 2). As with the other crops, fertilizer reductions did not produce significant changes in yield or profit for haygrazer. Average hay grazer yields decreased 0.7 t/ac (−18%) and profit decreased $35/ac (−23%) with EST recommendations. Similar to grain sorghum, the potential for the greatest profit occurred for the control (no fertilizer) treatment (Table 2), but this result was based on limited data (2 yr from only one site). The profits for the EST recommenddations were quite low because at least one field each year actually yielded less than the control (no fertilizer) field, which is likely not an influence of fertilizer but some of other factor such as insect damage.
3.6. Individual Sites
Average annual profits for each site are presented in Table 6. During the 4 yr study, the EST treatment was the most profitable on 6 sites, the Control treatment was the most profitable on two sites, and Traditional treatment was the most profitable on one site. Although the differences in profit were not statistically significant for any site, profit increases for the EST treatment relative to the Traditional treatment ranged from 3% - 18% (avg. = 7%). For the 3078 site, the profit for the EST treatment decreased 9% relative to the Traditional treatment.
4. Additional Discussion
4.1. Importance of “Zero Plot” Data
The production of 21 bu/ac wheat, 53 bu/ac corn, 35 bu/ac oats, 46 bu/ac grain sorghum, and 3.1 ton/ac hay on “zero plots” in this study with no applied fertilizer clearly illustrates potential of soils to provide plant available nutrients. This important result (i.e., crop yields from unfertilized control plots) is rarely mentioned or discussed in publications from long-term crop production studies. However, control plot yield data from the present study, and from long-term studies on famous plots such as the Magruder Plots at Oklahoma State University and the Morrow Plots at the University of Illinois are arguably as important, if not more important, than fertilizer response data. For a summary of fertilizer response data and the long-term contribution of plant available nutrients from soils based on long-term plot studies, see [21]. Based on Magruder plot data [21,22], only 40% of wheat yields from 1930 to 2000 are attributable to inorganic N and P fertilizer additions. Similarly, only 57% of corn yields during 46 years were attributable to fertilizer N, P, K, and lime additions at the Morrow plots [personal communication with Harold Reetz as noted in 21]. These results indicate that 60% of required wheat nutrients and 43% of corn nutrients were derived from sources other than fertilizer applications. Fertilizer control or “zero plot” data from these famous long-term studies illustrate the importance of quantifying all sources of plant available nutrients (e.g., mineralization, nutrients distributed throughout the root zone) and accounting for all of these sources as well as nutrients applied with irrigation water [23] to optimize fertilizer application.
4.2. Adherence to Traditional Fertilizer Rates
Several results from this study indicate that traditional fertilizer rates may be excessive, which may reduce profit and increase environmental degradation potential in this region (and likely elsewhere as well). For one, the 30% - 50% fertilizer reduction based on EST recommendations produced minimal reduction in yield for wheat, corn, and grain sorghum (0% - 6%) and actually increased oat yield 5%. Similarly, profit decreased <1% for corn and increased 7% - 18% for wheat, oats, and grain sorghum with reduced fertilizer rates. One could argue that these increases in profit were not significant, and that is true from a statistical standpoint; however, the same conclusion must then apply to the result that yield reductions are not significant, which is certainly a positive result. In addition, increases in profit of $10 - 28/ac are in fact significant in the real world as are reductions in fertilizer cost of 23% - 39%, which represent substantial decreases in production risk with little to no decrease in yield. It is also very interesting that in only 2 of 35 yr (6%) during this study was the traditional fertilizer rate the most profitable, which further indicates that traditional fertilizer rates may be excessive.
Although the unfertilized treatment was the most profitable scenario in 18 yr (51%), this result does not indicate that fertilizer application should be avoided. Instead, fertilizer rates should be carefully chosen considering all plant nutrient available sources (e.g., mineralization, irrigation water, nutrients deeper in the soil profile) to ensure that fertilizer is applied at the optimal rate.
A similar conclusion was drawn in a recent Irish study [24]. In that study results indicated 16% overapplication of N and 17% overapplication of P with a resulting reduction in profit of 39 EUR/ha. An economic analysis [25] of policy options to reduce nitrate leaching concluded that limiting N fertilizer application was the least cost option. And although the authors emphasized the need for accurate yield functions [25] instead of accurate plant available nutrient tests, accurately accounting for available nutrients and crop nutrient needs is critical to determine optimal fertilizer application rates.
5. Conclusions
Results of this study clearly indicate the need for producers to carefully examine fertilizer application rates. Simply adhering to traditional fertilizer application rates based on cultural norms or outdated science may result in excessive N fertilizer application, which reduces on-farm profits and contributes to water quality degradation [26]. The EST methodology [7,8,11,14,15] was designed to mimic field conditions by using the natural drying and rewetting cycle, an extractant comprised of root exudates instead of harsh acids or bases, and soil microbial activeity as an indicator of fertility with the goal of better estimating the total amount of plant available nutrients in soil. This methodology assists producers optimize fertileizer application rates. The shift in producer mindset to consider all sources of plant available nutrients, whether biological or chemical, has the potential to produce important reductions in N fertilizer applied in Texas and the US. The resulting optimal fertilizer rates could have tremendous environmental benefits with less N delivered to streams, rivers, lakes, estuaries, and oceans. Similarly, many on-farm economic benefits are likely and include increased profit, reduced risk and input costs, minimal impact on yields, and increased flexibility and ability to respond to current and expected weather and economic conditions. As described in [24], the optimization of nutrient application rates creates a “double dividend” of reduced offsite N transport and improved on-farm profitability. While the present field evaluation yielded promising results, further evaluation should be conducted with additional crops in other regions throughout the US.
Although it is not the only contributor of excess N to our Nation’s waters, agriculture should do its part to reduce N loading. Basing fertilizer application rates on soil tests that more accurately account for the total amount of plant available N in the soil including mineralizable N as well as considering all nutrient sources such as nutrients throughout the root zone and in applied irrigation water would produce a substantial reduction in agriculture’s contribution.
6. Acknowledgements
Funding for this project was provided by the Texas State Soil and Water Conservation Board and the USEPA through a Clean Water Act §319(h) grant and by USDAARS. The private landowners that made their land available to us deserve recognition. Thank you to the Hajda, Henson, Mahler, Melde, Schrank, and Shawver families. We also want to recognize T.J. Helton and Jay Atwood for their thorough review and insightful comments that improved this manuscript.
Mention of trade names or commercial products is solely for the purpose of providing specific information and does not imply recommendation or endorsement by the United States Department of Agriculture. USDA is an equal opportunity employer and provider.
REFERENCES
- B. Santos, “Selecting the Right Nutrient Rate: Basis for Managing Fertilization Programs,” HorTechnology, Vol. 21, No. 6, 2011, pp. 683-685.
- USDA-ERS, 2013. http://www.ers.usda.gov/data-products/fertilizer-use-and-price.aspx
- USDA-ERS, 2013. http://www.ers.usda.gov/topics/farm-practices-manage-ent/chemical-inputs/fertilizer-use-markets.aspx
- D. K. Mueller and D. R. Helsel, “Nutrients in the Nation’s Water—Too Much of a Good Thing?” US Geological Survey Circular, 1996, 24 p.
- L. K. Abbott and D. V. Murphy, “What is Soil Biological Fertility?” In: L. K. Abbott and D. V. Murphy, Eds., Soil Biological Fertility: A Key to Sustainable Land Use in Agriculture, Kluwer Academic Publishers, Dordrecht, 2007, 268 p.
- USDA-NRCS, “Conservation Practice Standard Nutrient Management Code 590,” 2012.
- R. L. Haney, W. F. Brinton and E. Evans, “Soil CO2 Respiration: Comparison of Chemical Titration, CO2 IRGA Analysis, and the Solvita Gel System,” Renewable Agriculture and Food Systems, Vol. 23, No. 2, 2008, pp. 171- 176. doi:10.1017/S174217050800224X
- R. L. Haney and E. B. Haney, “Simple and Rapid Laboratory Method for Rewetting Dry Soil for Incubations,” Communications in Soil Science and Plant Analysis, Vol. 41, No. 12, 2010, pp. 1493-1501. doi:10.1080/00103624.2010.482171
- H. L. Golterman, “Reflections on Fractionation and Bioavailability of Sediment Bound Phosphate,” Archive Hydrobiology, Vol. 30, 1998, pp. 1-4.
- A. N. Sharpley, “An Innovative Approach to Estimate Bioavailable Phosphorus in Agricultural Runoff by Fe Oxide—Impregnated Paper,” Journal of Environmental Quality, Vol. 22, 1993, pp. 597-601. doi:10.2134/jeq1993.00472425002200030026x
- R. L. Haney, E. B. Haney, L. R. Hossner and J. G. Arnold, “Development of a New Soil Extractant for Simultaneous Phosphorus, Ammonium, and Nitrate Analysis,” Communications in Soil Science and Plant Analysis, Vol. 37, No. 11-12, 2006, pp. 1511-1523. doi:10.1080/00103620600709977
- Z. Rengel, “Genetic Control of Root Exudation,” Plant Soil, Vol. 245, No. 1, 2002, pp. 59-70. doi:10.1023/A:1020646011229
- E. Baudoin, E. Benizri and A. Guckert, “Impact of Artificial Root Exudates on the Bacterial Community Structure in Bulk Soil and Maize Rhizosphere,” Soil Biology and Biochemistry, Vol. 35, No. 9, 2003, pp. 1183-1192. doi:10.1016/S0038-0717(03)00179-2
- R. L. Haney, A. J. Franzluebbers, F. M. Hons and D. A. Zuberer, “Soil Carbon and Nitrogen Mineralization: Influence of Drying Temperature,” Soil Science Society of America Journal, Vol. 68, No. 2, 2004, pp. 489-492. doi:10.2136/sssaj2004.0489
- R. L. Haney, A. J. Franzluebbers, V. L. Jin, M.-V. Johnson, E. B. Haney, M. J. White and R. D. Harmel, “Soil Organic C:N vs. Water-Extractable Organic C:N,” Open Journal of Soil Science, Vol. 2, 2012, pp. 269-274. doi:10.4236/ojss.2012.23032
- T. Bruulsema, J. Lemunyon and B. Herz, “Know Your Fertilizer Rights,” Crops Soils, 2009, pp. 13-18.
- Minitab, “MINITAB 12,” Minitab Inc., State College, PA, 2000.
- D. R. Helsel and R. M. Hirsch, “Statistical Methods in Water Resources,” Elsevier, New York, 1993.
- C. T. Haan, “Statistical Methods in Hydrology,” 2nd Edition, The Iowa State Press, Ames, 2002.
- USDA-NASS, 2012. www.nass.usda.gov/Data_and_Statistics/Quick_Stats_1.0/index.asp#top
- W. M. Stewart, “News and Views: Fertilizer Contributions to Crop Yield,” 2002. www.ipni.net/ppiweb/ppinews.nsf/0/7DE814BEC3A5A6EF85256BD80067B43C/$FILE/Crop%20Yield.pdf
- OSU, “Soil Fertility Research Highlights,” Oklahoma State University, Stillwater, 2000.
- P. B. DeLaune, D. E. Dittrich and F. M. Hons, “Impact of Drought and High Nitrate Groundwater on Residual Soil Nitrogen,” Proceedings of the Beltwide Cotton Conference, San Antonio, 7-10 January 2013, pp. 876-879.
- C. Buckley and P. Carney, “The Potential to Reduce the Risk of Diffuse Pollution from Agriculture while Improving Economic Performance at Farm Level,” Environmental Science & Policy, Vol. 25, 2013, pp. 118-126. doi:10.1016/j.envsci.2012.10.002
- W. Y. Huang and R. M. Lantin, “A Comparison of Farmer’s Compliance Costs to Reduce Excess Nitrogen Fertilizer Use under Alternative Policy Options,” Applied Economic Perspectives and Policy, Vol. 15, No. 1, 1993, pp. 51-62. doi:10.2307/1349711