Open Journal of Soil Science
Vol.3 No.3(2013), Article ID:33766,10 pages DOI:10.4236/ojss.2013.33018
Soil Properties, and Soil Organic Carbon Stocks of Tropical Andosol under Different Land Uses
![]()
School of Plant and Horticultural Sciences, Hawassa University, Hawassa, Ethiopia.
Email: *girmajibat2006 @yahoo.com
Copyright © 2013 Girma Abera, Endalkachew Wolde-Meskel. This is an open access article distributed under the Creative Commons Attribution License, which permits unrestricted use, distribution, and reproduction in any medium, provided the original work is properly cited.
Received December 21st, 2012; revised April 21st, 2013; accepted April 29th, 2013
Keywords: Aggregate Fraction; Aggregate Stability; Crop Land Use; Coffee Land Use; SOC and SON Stocks
ABSTRACT
Land use effect of tropical Andosol, with two from crop lands (Site 1 and Site 2) and one from Agroforestry coffee plantation (Site 3) was explored under laboratory conditions to understand their physical, chemical and biological properties and soil organic carbon (SOC) stocks from the rift valley of Ethiopia. Site 3 that acquired less cultivation than others exhibited better aggregate size fraction (AF, 55%), higher aggregate stability (AS, 91%), and greater active microbial biomass (AMB), reflecting better soil structure development. Comparatively, higher total carbon (TC), organic carbon (OC) and total nitrogen (TN) concentrations were recorded in bulk soils and microaggregate fractions of Site 2 and Site 3 than in intensively cultivated Site 1. As expected, microaggregate fractions displayed greater OC and TN than bulk soils across all land uses. Site 1 revealed higher metabolic quotient (qCO2) and lower SOC stock (2.1 Mg·ha−1), suggesting microbial stress, while micro nutrients deficiencies were observed with the alkaline soil (Site 2). Conversely, the highest SOC stock was exhibited with Site 3 (4.2 Mg·ha−1), indicating the importance of coffee land use in C sequestration. Crop lands, depleted much of their native carbon stocks had significant CO2 sink capacity. Hence, management practices that increase the input of organic resources should be adopted to build SOM and enhance soil fertility.
1. Introduction
Soil has three important and interrelated physical, chemical and biological properties, which makes it functionally complete resources. The inherent characteristics of soil which are mainly the resultant of parent material and climate undergo subtle change due to different land management practices. Soil characteristics such as soil organic matter (SOM), aggregation and aggregate stability [1], bulk density, and water retention [2], pH and nutrient status [3], and soil biota [4] tend to change depending on land use, climate and vegetation.
Land use and vegetation cover may serve as an indicator of disturbance, site history, and management factors that should disproportionately affect surface rather than subsurface soil properties [5]. In natural and seminatural ecosystems, like forest and coffee farms, soil cultivation and management disturbance may be very limited reflecting less effect of management practices in these ecosystems; in turn they may contain sufficient nutrients and diverse soil biota [6]. On the other hand, in agroecosystems, frequent soil disturbance accelerates turnover rates of macro aggregates and limits the physical stabilization of labile SOM compounds [7].
The majority of soil characteristics and soil organic carbon (SOC) stock studies have been much focused on land use changes. Extensive studies have documented that land use changes, particularly cultivation of deforested land rapidly diminish soil quality by decreasing C storage [8], and result in net flux of CO2 to atmosphere [9]. This is not only due to losses of plant biomass but also due to increased decomposition of SOM caused by continuous cultivation and frequent disturbance [10]. In addition, cultivation may also affect carbon storage by changing redox conditions [11].
Previously published studies characterized soils largely based on small scale comparative analyses of adjacent soils. These studies were much focused on soil properties variation in relation to topography and vegetation [12], and land use change [9,13]. In Ethiopia, Andosol soil covers wide area and this soil was formed from the volcanic ash parent material during tertiary and quarternary periods [14,15]. Significant areas of Udands and Ustands type Andosol occur along the rift valley of east Africa [16]. Indeed, our present study included wider area covered Andosol that extended from Awassa to Ziway, the rift valley areas of Ethiopia [15]. These soils were under different land uses, annual crop production and perennial coffee plantations often with various management practices [17]. The sites were selected due to diverse land management practices that perhaps affect sustainable crop productivity and soil fertility.
The crop land use (Site 1) of the present study acquired intensive and frequent cultivation with machinery, whereas the other crop land use (Site 2) received less intensive cultivation with oxen plow. Both of the crop lands (Site 1 and Site 2) often received inorganic fertilizers at the ranges of 46 to 92 kg·ha−1 N and 20 to 30 kg·ha−1 P with maize production as the major cereal crops in the area. On the other hand, the coffee land use (Site 3) receives organic fertilizers through litter falls, farmyard manures and compost. The later often receives less management and only once hoeing or cultivation per year [18]. The objective of the present investigation is to explore the physical, chemical and biological properties and SOC stocks of three tropical Andosol under different land uses to provide appropriate management intervention for sustainable utilization.
2. Materials and Methods
2.1. Study Sites
Soil samples were collected from three sites of the rift valley areas of Ethiopia (Figure 1), Awassa (Site 1), Ziway (Site 2) and Wondo Genet (Site 3), which were under different land use, vegetation cover and climate conditions [18]. The study sites are situated between 6˚3' and 7˚56' N latitude, and between 38˚7' and 38˚38' E longitude at elevations of 1643 - 1950 m a.s.l. The long term
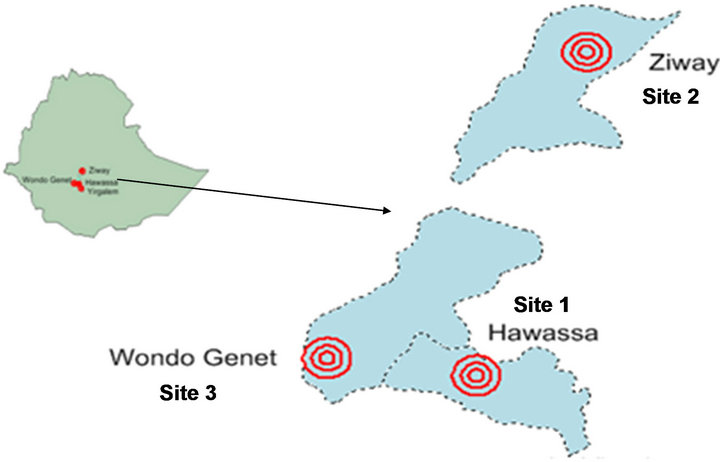
Figure 1. The map of the study sites in the rift valley of Ethiopia.
annual rain fall of Site 1 was 952 mm·yr−1, while 650 mm·yr−1 with Site 2 and 1200 mm·yr−1 with Site 3. The average daily temperature was 19.4˚C, 24.0˚C and 19.5˚C, for Site 1, Site 2 and Site 3, respectively. Site 1 and Site 3 were characterized by sub-humid agroclimatic conditions, while Site 2 was known for its semi-arid climate condition [19]. The soils of the three study sites represent tropical Andosol [17,18]. They were formed from the parental materials of volcanic origin during tertiary and quaternary periods of geologic time [14,15]. The textural class of Sites 1 and 3 is loam, while Site 2 is silt clay loamy.
2.2. Soil Sampling and Treatments
Surface (0 - 30 cm) soil samples were collected in July 2007 from three sites. Site 3 was sampled from Agroforestry coffee plantation (34 yr), while Site 1 and Site 2 were from plots being cropped with annual crops for the last five decades. At each site soil was collected from 15 sampling points. In each site five samples were bulked into one composite sample, and then three such bulk samples (replicates) per area/treatment were analyzed (Tables 1 and 2). The soil samples were air dried at room temperature at Hawassa University, Ethiopia. Later sufficient soil samples were transported to Norwegian University of Life Science (UMB), Norway, where most of the measurements were carried out.
2.3. Fractionation of Aggregate Classes
Aggregate fraction was measured using nested dry sieves of 0.6, 2, 6 and 20 mm. The sieves were mechanically shaken for 3 minutes at speed of 240 rpm [20]. The aggregate sizes collected were: <0.6, 0.6 - 2, 2 - 6, 6 - 20 and >20 mm. Furthermore, after crushing aggregates through 2 mm sieve, they were classified into meso (0.25 - 2 mm) and micro (0.045 - 0.25 and <0.045 mm) aggregate fractions.
Aggregate stability (AS) was measured with 20 g air dry soil for the two macro aggregate fractions (0.6 - 2 and 2 - 6 mm) using an artificial rainfall simulator [20]. The dry aggregate samples were placed on a wet 0.5 mm sieves. The sieves were then placed in a rotating disk at a distance of 31.5 cm from the nozzles. Water drops were applied by 4 nozzles in a form of rain simulation. The water pressure of 1.5 kg·cm−2 is applied for 3 minutes. The AS of soils was estimated as weight of dry sample after rain simulation divided by weight of dry sample before rain simulation.
2.4. Soil Water Potential
Water potential of the study soils was measured using a sandbox for higher water potential >−10 kPa [21] and a pressure plate apparatus, for lower water potential <−10
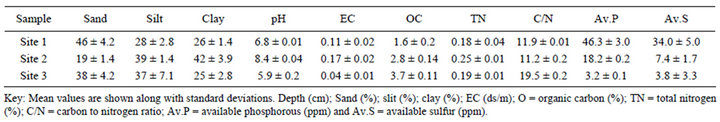
Table 1. Some physical and chemical characteristics of tropical Andosol from surface (0 - 30 cm) soil under different land uses from the rift valley of Ethiopia.
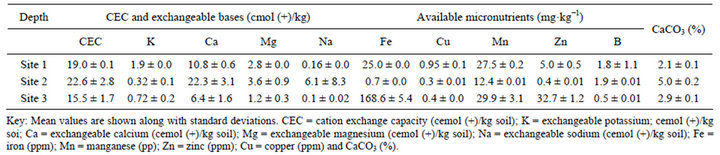
Table 2. Exchangeable bases, CEC, available micronutrients, available aluminum and carbonate of tropical Andosol from surface (0 - 30 cm ) soil under different land uses from the rift valley of Ethiopia.
kPa [20]. The soils were manually packed into a core sampler (size of 5.8 cm diameter and 3.7 cm height), by adding 2 - 3 spoons of soils each time and tapping the column 5 - 7 times to the bench and pressing from the top to pack the soil as homogenously as possible without creating layers. Thereafter, the soil samples were saturated and drained 3 - 4 times to avoid settling during the analysis. Soil water contents were measured at the matrix potentials: 0, −1, −2, −5, −10, −50, −100 and −1500 kPa. Water-filled pore space (WFPS) was calculated as the ratio of the volumetric soil water content to the total pore space [22].
Soil samples were gently ground through a 2 mm sieve before the particle size analysis was performed according to the pipette method [23]. The bulk density was determined by core sampling and then oven drying samples at 105˚C, 24 h [24]. Total porosity (Pt), the percentage of bulk volume of soil not occupied by solid particles, was determined from the saturated soils during water retention determination.
2.5. Soil Nutrient Analysis
Soil organic carbon (OC), total carbon (TC) and total nitrogen (TN) concentrations were measured with bulk and aggregate fractions, while extractable phosphorous (P) and exchangeable cations were determined from surface bulk soils and across soil profiles. The soil OC and TC concentrations were determined through dry combustion by Allison method [24]. Total N was determined by Dumas method [25], whereas extractable P was determined by Olsen’s method [26]. Soil pH was determined with a pH electrode at soil water ratio of 1:2.5 in pH H2O. Electrical conductivity (EC) was determined by condutometric. Exchangeable base cations were extracted with 1M ammonium acetate buffered at pH 7 method [27]. Sodium (Na) and potassium (K) contents in the extract were determined by flame photometry, while calcium (Ca) and magnesium (Mg) contents were determined by atomic absorption spectrophotometry. The available micro nutrients, copper (Cu), iron (Fe), manganese (Mn) and zinc (Zn) were extracted by DPTA methods [28], while Boron (B) was extracted by hot water extraction method. Available sulfur (S) was determined by turbidimetric procedure.
2.6. Soil Organic Carbon and Soil Organic Nitrogen Stocks
Soil organic carbon (SOC) and soil organic nitrogen (SON) stocks of surface soils of the three tropical Andosols were calculated as follows [29]:

where Cstock is the SOC stock in kg C·m−2, Cconc is the SOC concentration in % of dry weight, BD is the bulk density in kg·m−3, d is the depth of soil layer in m, and Vstone is the proportion of rock fragments >2 mm in % of volume. The SON stock was calculated with the same principle as SOC stock.
2.7. Soil Biological Analysis
Basal respiration (BR) was measured with 10 g dry soils in laboratory incubation for 10 - 20 days at optimum soil water (pF2.5) using high resolution robotized gas chromatography [30]. Glutamate (C5H8NNaO4*H2O) solution mixed with carrier material (quartz) was added into serum flask (120 mL) at the rate of 0.25 mg·g−1 dry soil. After addition of soil samples and glutamate with quartz (1:10), the flask was sealed with butyl rubber septa and incubated at 15˚C for three days. The active microbial biomass carbon (AMBC) was estimated by substrate induced respiration method [31] after 20 h of substrate addition as follows:

where CO2-C is the net amount of C evolved from glutamate addition during 20 h of incubation, and AC is the coefficient to convert CO2-C into (AMBC), which is 0.283 [31]. Specific maintenance respiration rate (qCO2) of active microbial biomass was calculated as BR per unit of (AMBC) [32]. The flush of C was converted to total microbial biomass carbon (TMBC) by multiplying by 2.64 [33] and the flush of N by multiplying by 1.86 [34].
2.8. Statistical Analyses
The data were subjected to analyses of variance to determine the effects of land use and soil management practices on soil physical, chemical and biological properties as well as soil C and N stocks. The GLM Model in MINITAB Statistical Software for Windows Release 14 (Minitab, State College, Pa.) was employed for this purpose. Means found to be different were declared statistically significant at P ≤ 0.05. The relationships of AS with SOC contents were explored using correlation analysis.
3. Results and Discussion
3.1. Aggregate Fraction, Stability and Soil pH
Land use and management practices displayed significant effect on the aggregate fraction, AF and aggregate stability, AS (Figure 2 and Table 3). Site 3 (coffee plantation) had more macro AF (55%) and higher AS (91%), while Site 1 and Site 2 (crop lands) had lower macro AF (31% - 45%) and lower AS (41% - 63%). This could be due to the fact that coffee land use received minimum tillage, lower disturbance and higher organic matter input (litters and root exudates) that bind soil aggregates together resulting in improved soil structure formation. By contrast, Site 1 and Site 2 showed lower AS due to lower OC content and more micro AF, respectively attributed to continuous cultivation and rapid oxidation of SOM (Figure 2 and Table 3). Consistent to our findings higher macro AF (41% - 70%) and higher AS (83% - 92%) were reported from under natural vegetation, pasture, conservation tillage and forest land uses, while lower macro AF (37% - 44% ) and lower AS (49% - 79%) were exhibited from crop land use [1,35]. Generally, good soil aggrega-
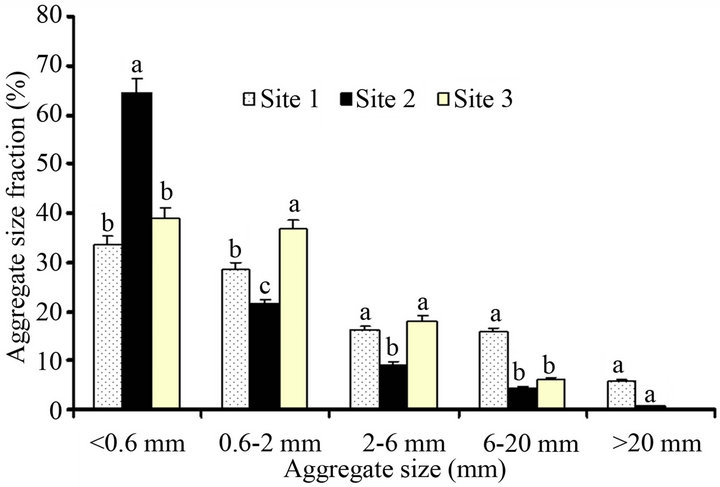
Figure 2. Aggregate size fractions of three surface layer (0 - 30 cm) Andosol from the rift valley of Ethiopia. Mean values followed by different letters in a figure column show statistically significant difference (otherwise nonsignificant).
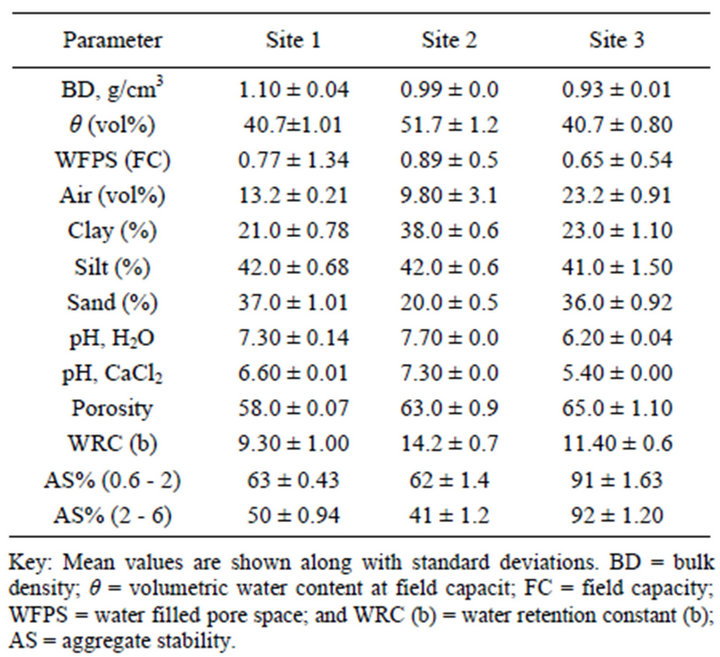
Table 3. Physical characteristics of three surface layer (0 - 30 cm) tropical Andosols from rift valley of Ethiopia.
tion has positive effects on soil water retention and soil C sequestration. It is essential to note that time of plowing and sampling might affect the proportion of AF. For instance, Site 1 was sampled when the soil was wet and its AF was above average size; this could also be due to puddling during cultivation [1]. The AS of macro aggregates were positively correlated with OC of the bulk soils and the proportion of macro AF (Table 4). This suggests that when macro AF increases, the AS increases and vice versa [35].
Furthermore, AS was negatively correlated with CEC, PBS and exchangeable cations Ca, Mg, K and Na (Table 4). This suggested that as CEC, PBS and exchangeable cations tend to increase, AS declined. There have been several controversial findings with regards to CEC and AS relationship. A study revealed that excessive Ca2+
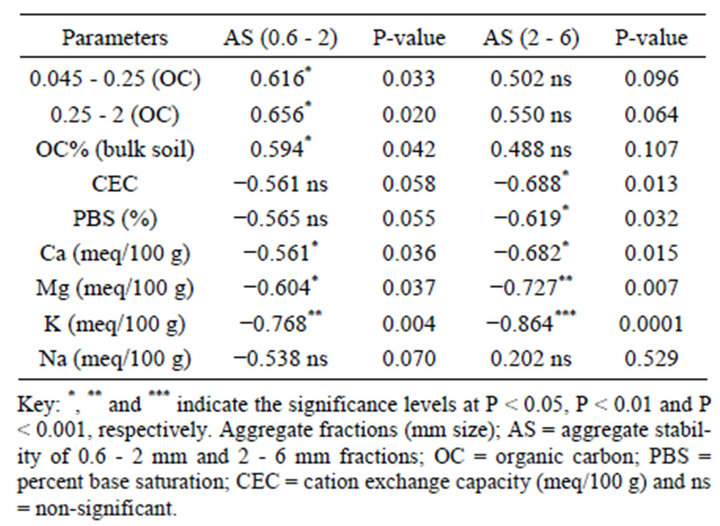
Table 4. Pearson correlation of aggregate stability (AS) with different parameters of surface tropical Andosol from rift valley of Ethiopia.
cations presence in soils negatively affected aggregate stability, and higher free carbonate content was also reported to have negative influnce on AS of soils [53], in conformity with our findings. This result may require further conformation studies. Previous works showed that soils with stable aggregates at the surface are more resistant to water erosion, because soil particles are less likely to be detached and the rate of water infiltration tends to be higher on well aggregated soils [36].
Site 1 soil was found to be slightly alkaline, while Site 3 was slightly acidic. By contrast, Site 2 tended to be strongly alkaline across the soil profile (Tables 1-3).
3.2. Soil Texture and Bulk Density
All the studied soils contained more than 40% silt fraction (Table 3). Their textural classes varied from loam to silt clay loam. The silt to clay ratio of the studied soils range from medium to high (1.1 - 2.0), indicating that they are less weathered soils. In agreement to our results, high silt to clay ratio (1.5) was reported with Alfisol from southern Ethiopia [37]. It is important to note that the silt to clay ratio has been used as an index of stage of soil development by many investigators, and high clay content showed complete alteration of weatherable minerals into secondary clays and oxides [38]. The textural class of the studied soils was found to be favorable in terms of nutriaent status and water holding capacity; since soil texture influences several characteristics of the soil microenvironment, such as soil moisture, organic matter content, litter decomposition and nutrient release [39]. The crop land soils revealed relatively higher bulk density than coffee soil, suggesting the possibility of soil compaction due to frequent tillage (Table 3).
3.3. Porosity and Soil Water Retention
Porosity estimated based on water saturation technique exhibited variations among soil samples (Table 3). In general, Andosols have high water holding capacity due to a unique set of andic properties [16], but can be modified based on land use and management practices. Site 1 showed lower porosity and retained relatively lower amount of water at saturation and at any given matric potential than Site 2 and Site 3, reflecting its higher bulk density and lower SOM content due to intensive cultivation. On the other hand, Site 2 retained more water may be attributed to its high clay proportion and more micro AF. The latter soil also showed the highest water retention constant, “b” value followed by Site 3, coffee soil (Table 5). Similar findings reported that soil with more b value retained greater water across matric potentials [40]. This result demonstrated that the effect of soil management practices may be largely dependent on soil texture.
Soil water retention describes the relationship between water potential and soil water contents. Site 2 retained high water (>60 vol%) at saturation, but fast drained and held the lowest (<10 vol%) at pF4.2. By contrast, Site 1 retained low water (52 vol%) at saturation (Figure 3). Site 1 and Site 3 soils held similar amount of water (40 vol%), whereas Site 2 held high water (52 vol%) at field capacity (Table 3). This may suggest that Site 3 had more macro pores that unable to hold much water under natural drainage system. On the other hand, Site 1 (77%) and Site 2 (89%) had higher water filled pore space (WFPS) than Site 3 (65%). In general, the higher WFPS imply potential denitrification loss of nitrogen depending on the availability of mineral-N and soluble carbon substrate. Many reports indicated that denitrification exponentially increases when WFPS exceeding 60% in combination with high soil mineral-N content [41,42]. Thus, the differences in water retention among the study soils could be attributed to differences in land use, management and soil texture. The amount of water retained at different water potentials was similar with those forest Andosols in Gambo
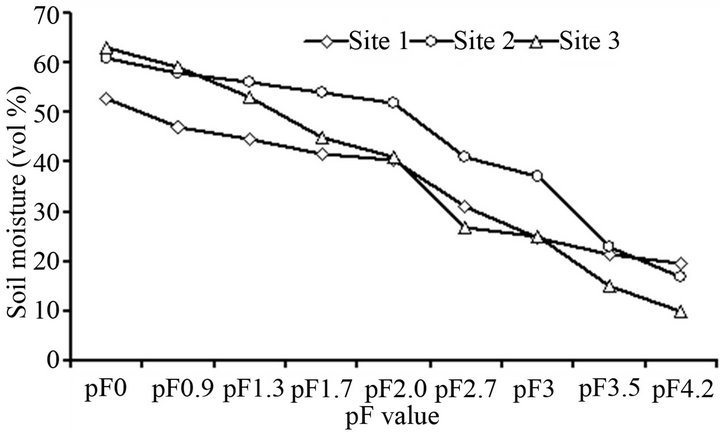
Figure 3. Soil water retention of surface layer (0 - 30 cm) tropical Andosol from the rift valley of Ethiopia. Crop lands (Site 1 and Site 2) and coffee plantation (Site 3).
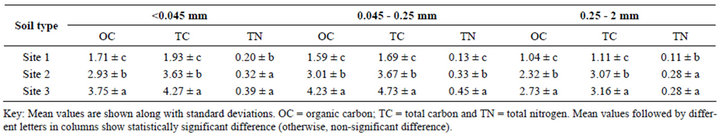
Table 5. Carbon and nitrogen concentrations (%) of the aggregate fractions (AF) of surface layer (0 - 30 cm) tropical Andosol from the rift valley of Ethiopia.
districts of southern Ethiopia [43].
3.4. Soil Chemical Characteristics
Andosols are usually of high natural fertility, except that P availability is severely limited by the high P retention capacity of the andic materials [16]. The surface layer soils showed significantly varied OC, TC, TN, extractable P, pH and CEC (Tables 5 and 6) between sites. Site 2 and Site 3 exhibited relatively high OC, TC and TN contents, despite differences in land use and management practices. The higher OC and TN of Site 3 might be ascribed to less intensive cultivation and higher organic residues return through litter fall and root exudates from coffee plants and shade trees [18,44]. While that of Site 2 might be ascribed to low rate of SOM oxidation due to its semi-arid climate condition (Ustic), less intensive cultivation by oxen plow and the presence of more micro AF that reduce microbial access to C substrates. By contrast, Site 1 exhibited low OC, TC and TN concentrations (Tables 5 and 6). This is most likely attributed to the reduced amount of organic material being returned to the soil system, and high rate of oxidation of SOM due to more intensive cultivation by heavy machinery [45]. Similar studies indicated that intensive cultivation decrease soil C, contributing to terrestrial net fluxes of C to the atmosphere and decreased net primary productivity [8, 9].
With most of the soils, higher OC and TN were exhibited in micro AF, showing its less accessibility to microbial utilization and they are the most refractory pool for decomposition (Table 5). Previous study showed that C and N in silt and clay fractions represent predominantly refractory pools with long turnover time [46]. Other studies pointed out that micro aggregates are usually the clay fraction of soil texture and in many soils most of the C is stored in the clay size fraction [47,48]. Furthermore, similar studies pointed out that OM in soil associates partly with minerals; this renders SOM less susceptible to biodegradation than when it is free [48]. Therefore, in ecosystems with frequent soil disturbance, accelerated turnover rates of macro aggregates limit the physical stabilization of labile SOM compounds [6].
The extractable P concentration of crop lands (Site 1
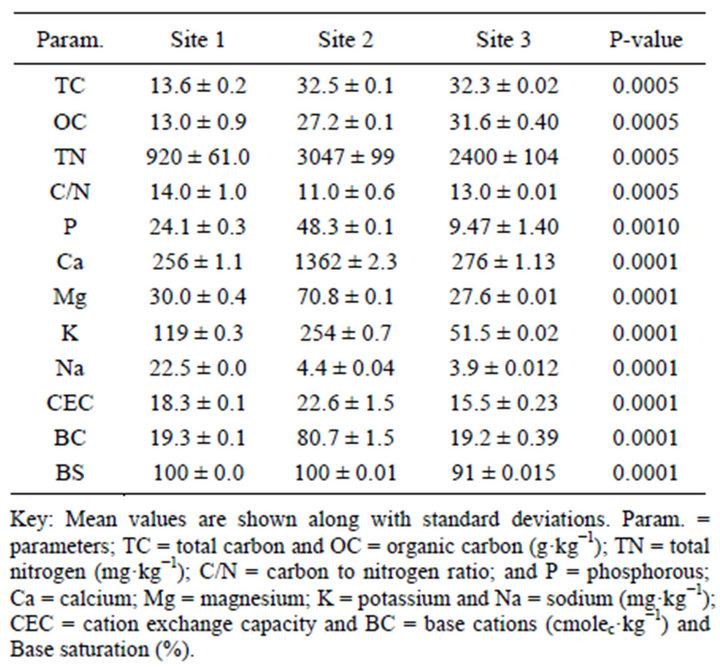
Table 6. Chemical characteristics of three surface layer (0 - 30 cm) tropical Andosol from the rift valley of Ethiopia.
and Site 2) was relatively higher than coffee plantation (Site 3) might be attributed to external P supply, and P carry over from fertilization [44]. The low P availability of slightly acidic coffee soil (Site 3) could be partly attributed to the inherent P deficiency and partly to the lack of external P fertilizer supply. Generally the P concentration of the studied soils ranks in the order of Site 1 > Site 2 > Site 3 (Tables 1 and 6). All the studied sites appeared to be non-saline (Table 1). Site 1 exhibited adequate micronutrients availability, while Site 2 tended to be deficient with most micronutrients Cu, Fe and Zn [49], attributed to its pH and non-amendments of these micronutrients as fertilizer. On the other hand, Site 3 was found to be slightly deficient with sulfur (Tables 1 and 2), perhaps attributed to higher sulfur uptake of coffee and shade trees.
3.5. Cation Exchange Capacity and Percent Base Saturation
The surface soil CEC of Site 1 and Site 3 was medium, while of Site 2 was relatively high (Tables 2 and 6), attributable to the basic cations attracted to the negatively charged clay or SOM, suggesting their good nutrient availability for crop production. The amount and relative proportion of the cations reflect the soil’s parent materials. Strikingly Site 2 had more exchangeable Ca2+ and high carbonate content suggesting its calcareousness. Of the total cations in the exchange sites of this calcareous soil (Site 2), 84% was occupied by Ca2+. Generally, the content of exchangeable cations ranks in order of Ca > Mg > K > Na, attributed to differences in adsorption energy. Sodium content along the soil profile of Site 2 was higher than the other sites (Table 2).
The PBS of the studied soils was very high (91% - 100%), probably related with soil pH and parent material. Several investigations since 1940s attempted to explore the threshold levels for Ca/Mg ratio, however consensus was not reached. Soils with Ca/Mg ratio of 1.1 to 15.1 are optimum for good soil aggregation, microbial activity, and to produce healthy and high yielding crops [16]. The Ca/Mg ratio of the present studied soils ranged from 5.1 - 11.5, suggesting that they exist in balanced proportion, i.e. neither deficiency nor toxicity of these nutrients are expected; perhaps external supply of these nutrients may not be profitable.
3.6. Soil Organic Carbon and Nitrogen Stocks
The SOC and SON stocks of Site 2 and Site 3 were significantly higher than Site 1 (Figure 4). The average SOC stocks ranged from 2.1 - 4.2 Mg·ha−1, while SON stocks ranged from 0.15 - 0.45 Mg·ha−1. Field investigation indicated that rainfall and clay content are major regulators of SOC stocks under different land uses in most soils of Bale highlands of Ethiopia, through affecting rates of primary production and decomposition [50]. Rainfall is often considered as main regulator of plant growth and thereby the amounts of residues or litter return to soils. Hence, in high rainfall sites of varied land uses they found high SOC stocks with most of the plots.
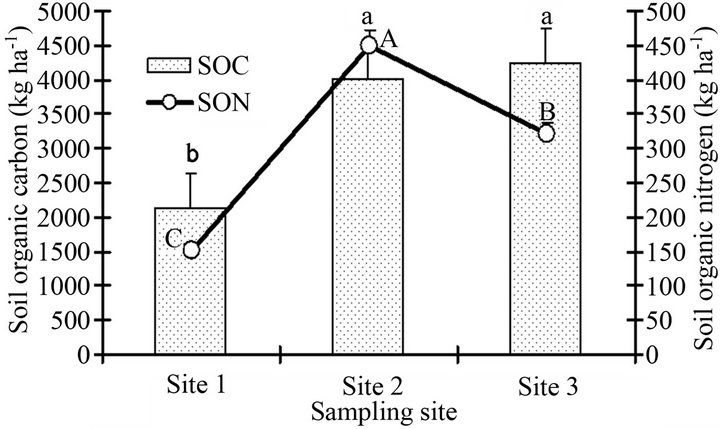
Figure 4. Soil organic carbon and soil organic nitrogen stocks (kg·ha−1) of surface layer tropical Andosols from the rift valley of Ethiopia. Mean values followed by different letters on a bar graph (a, b) and on the line graph (A, B, C) show statistically significant difference (otherwise, nonsignificant difference).
By contrast, we found relatively greater SOC and SON stocks at one of the study sites (Site 2), despite its semiarid climate condition. This may be ascribed to low microbial activity and slow decomposition rate of SOM due to moisture stress (semi-arid climate condition). Some volcanic soils have a greater stabilizing influence on organic matter than would be predicted from their clay contents, probably due to the presence of allophone and ferrihydrite, both of which have a large specific surface capable of adsorbing organic molecules [51,52]. Furthermore, other factors such as high microaggregate fractions may provide physical protection of SOM and thereby contributed to the slow C loss and N release.
3.7. Biological Properties
As expected significant variation was observed in soil biological properties among the three sites may be attributed to the effect of land use and management differences (Table 7). Site 2 and Site 3 soils displayed higher basal respiration (BR) than Site 1. Site 1 soil exhibited lower abundance of active and total microbial biomass carbon (TMBC) than Site 2 and Site 3, corresponding to their SOC stocks. By contrast, Site 1, soil with lower active microbial biomass carbon (AMBC) revealed higher metabolic quotient (qCO2), suggesting greater microbial biomass activity due to soil stress by disturbance (intensive and continuous cultivation). Conversely, nonstress soils (Site 2 and Site 3) displayed higher yield efficiency and higher C sequestration than Site 1 (Figure 4 and Table 7).
The metabolic quotient, i.e., the ratio of basal respiration to microbial biomass, is inversely related to the efficiency with which the microbial biomass uses the indigenous substrates [32]. In accordance to our results low qCO2 was exhibited under pasture soils indicating more new microbial biomass formation and low C loss through respiration than crop land soils [22]. Recently another study reported higher metabolic quotient and reduced
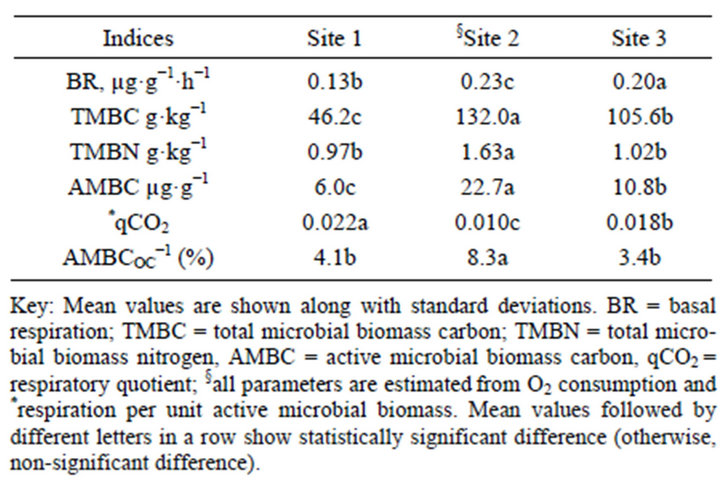
Table 7. Biological indices of three tropical Andosol from the rift valley of Ethiopia.
basal respiration in Cd contaminated tropical soil [54]. Some studies suggested that the microbial metabolic quotient (respiration-to-biomass ratio) or qCO2 is increasingly being used as an index of ecosystem development (during which it supposedly declines) and disturbance (due to which it supposedly increases) [32,54].
4. Conclusion
Types of land use, intensity of cultivation and fertilizer sources are major factors responsible for soil properties transformation. Some inherent soil properties such as soil pH and texture as well as climatic conditions might also have substantial influences on soil properties transformations. Site 1 soil was lower in SOC and SON stocks than Sites 2 and 3; while Site 2 soil was lower in macro AF and AS than Sites 1 and 3. The later was also deficient in Cu, Fe and Zn due to its inherent properties and pH. Contrastingly, Site 3 revealed higher SOC and SON stocks, but had limited P content. Interestingly, the variation in SOC and SON stocks, and nutrient concentrations between the crop lands (Site 1 and Site 2) suggested that external fertilizer supply should take into account the indigenous nutrient supply potential of soil and the macro and micro nutrients balance for sustainable crop production. Generally the studied soils showed medium to high CEC and high percent base saturation (PBS), reflecting fairly good fertility. In nutshell, these findings are useful as a baseline for future intervention and sustainable utilization of the Andosols of the rift valley of Ethiopia. Furthermore, detailed studies of soil mineralogy and soil fertility based on use of test crops with addition and omission of nutrients are suggested.
5. Acknowledgements
The Norwegian Program for Development, Research and Higher Education (NUFU) is cordially acknowledged for financing this research work through legume-rhizobia collaborative project between Norwegian University of Life Sciences and Hawassa University, Ethiopia. We are also grateful to Dr. Dhyan Singh for his help in reviewing the early draft of the manuscript.
REFERENCES
- B. M. Shrestha, B. R. Singh, B. R. Sitaula, R. Lal and R. M. Bajarcharya, “Soil Aggregateand Particle-Associated Organic Carbon under Different Land Uses in Nepal,” Soil Science Society of America Journal, Vol. 71, No. 4, 2007, pp. 94-1203. doi:10.2136/sssaj2006.0405
- R. Lal, “Soil Erosion and the Global Carbon Budget,” Environment International, Vol. 29, No. 4, 2003, pp. 437- 450. doi:10.1016/S0160-4120(02)00192-7
- D. K. Benbi and J. S. Brar, “A 25-Year Record of Carbon Sequestration and Soil Properties in Intensive Agriculture,” Agronomy for Sustainable Development, Vol. 29, No. 2, 2009, pp. 257-265. doi:10.1051/agro:2008070
- K. R. Islam and R. R. Weil, “Land Use Effects on Soil Quality in a Tropical Forest Ecosystem of Bangladesh,” Agricultural Ecosystem and Environment, Vol. 79, No. 1, 2000, pp. 9-16. doi:10.1016/S0167-8809(99)00145-0
- R. V. Pouyat, I. D. Yesilonis, J. Russell-Anelli and N. K. Neerchal, “Soil Chemical and Physical Properties That Differentiate Urban Land-Use and Cover Types,” Soil Science Society of America Journal, Vol. 71, No. 3, 2007, pp. 1010-1019. doi:10.2136/sssaj2006.0164
- M. Lemenih, “Effects of Land Use Changes on Soil Quality and Native Flora Degradation and Restoration in the Highlands of Ethiopia. Implications for Sustainable Land Management,” Doctoral Thesis, Swedish University of Agricultural Sciences, Uppsala, 2004.
- J. Six, E. T. Elliott and K. Paustian. “Aggregate and Soil Organic Matter Dynamics under Conventional and NoTillage Systems,” Soil Science Society of America Journal, Vol. 63, No. 5, 1999, pp. 1350-1358. doi:10.2136/sssaj1999.6351350x
- R. A. Houghton, J. L. Hacker and K. T. Lawrence, “The US Carbon Budget: Contributions from Land Use Change,” Science, Vol. 285, No. 5427, 1999, pp. 574-578. doi:10.1126/science.285.5427.574
- D. Solomon, F. Fritzsche, J. Lehmann, M. Tekalign and W. Zech, “Soil Organic Matter Dynamics in the SubHumid Agro-Ecosystems of the Ethiopian Highlands: Evidence from Natural 13C Abundance and Particle-Size Fractionation,” Soil Science Society of America Journal, Vol. 66, No. 3, 2002, pp. 969-978. doi:10.2136/sssaj2002.0969
- W. H. Schlesinger and J. A. Andrews, “Soil Respiration and the Global Carbon Cycle,” Biogeochemistry, Vol. 48, No. 7, 2000, pp. 7-20. doi:10.1023/A:1006247623877
- L. J. Osher, P. A. Matson and R. Amundson, “Effect of Land Use Change on Soil Carbon in Hawaii,” Biogeochemistry, Vol. 65, No. 2, 2003, pp. 213-232. doi:10.1023/A:1026048612540
- F. Yimer, S. Ledin and A. Abdelkadir, “Soil Property Variations in Relation to Topographic Aspect and Vegetation Community in the South-Eastern Highlands of Ethiopia,” Forest Ecology and Management, Vol. 232, No. 1-3, 2006, pp. 90-99. doi:10.1016/j.foreco.2006.05.055
- M. Lemenih, E. Karltun and M. Olsson, “Soil Organic Matter Dynamics after Deforestation along a Farm Field Chronosequence in Southern Highlands of Ethiopia,” Agroecosystems and Environment, Vol. 109, No. 1-2, 2005, pp. 9-19. doi:10.1016/j.agee.2005.02.015
- Mengistu A. “Country Pasture/Forage Resource Profiles”. FAO, 2006. http://www.fao.org/ag/AGP/AGPC/doc/counprof/ethiopia/ethiopia.htm
- M. Abebe, “Nature and Management of Ethiopian Soils,” Alemaya University of Agriculture, Dire Dawa, 1998.
- N. Brady and R. R. Weil, “The Nature and Properties of Soils,” 14th Edition, Prentice Hall Inc., Lebanon, 2008.
- G. Abera, E. Wolde-meskel and L. R. Bakken, “Carbon and Nitrogen Mineralization Dynamics in Different Soils of the Tropics Amended with Legume Residues and Contrasting Soil Moisture Contents,” Biology and Fertility of Soils, Vol. 48, No. 1, 2012, pp. 51-66. doi:10.1007/s00374-011-0607-8
- G. Abera, E. Wolde-Meskel, S. Beyene and L. R. Bakken. “Nitrogen Mineralization Dynamics under Different Moisture Regimes in Tropical Soils,” International Journal of Soil Science, Vol. 7, No. 4, 2012, pp. 132-145. doi:10.3923/ijss.2012.132.145
- EARO, “Major Agroecological Zones of Ethiopia,” Ethiopian Agricultural Research Organization, Addis Ababa, 1998.
- T. H. Børresen, “Soil Physics Field and Laboratory Methuds,” Agricultural University of Norway, Norway, 2003 (Unpublished).
- http://www.Eijkelkamp.com
- S. Saggar, R. M. Andrew, K. R. Tate, C. B. Hedley, N. J. Rodda and J. A. Townsend, “Modeling Nitrous Oxide Emissions From New Zealand Dairy Grazed Pastures,” Nutrient Cycling in Agroecosystems, Vol. 68, No. 3, 2004, pp. 243-255. doi:10.1023/B:FRES.0000019463.92440.a3
- P. R. Day, “Particle Fractionation and Particle-Size Analysis,” In: C. A. Black, Ed., Methods of Soil Analysis, American Society of Agronomy Inc., Madison, 1965, pp. 545-567.
- D. W. Nelson and L. E. Sommers, “Total Carbon, Organic Carbon and Organic Matter,” In: A. L. Page, Ed., Methods of Soil Analysis, American Society of Agronomy Inc., American Society of Soil Science Inc., Madison, 1982, pp. 539-580.
- J. M. Bremner and C. S. Mulvaney, “Nitrogen-Total,” In: A.L. Page, Methods of Soil Analysis, American Society of Agronomy Inc., American Society of Soil Science Inc., Madison, 1982, pp. 595-624.
- S. R. Olsen and L. E. Sommers, “Phosphorous,” In: A.L. Page, Ed., Methods of Soil Analysis, American Society of Agronomy Inc., American Society of Soil Science Inc., Madison, 1982, pp. 403-430.
- H. D. Chapman, “Cation Exchange Capacity,” In: C.A. Black, Ed., Methods of Soil Analysis-Chemical and Microbiological Properties. Agronomy, American Society of Agronomy Inc., Madison, Vol. 9, 1965, pp. 891-901.
- W. L. Lindsay and W. A. Norvell, “Development of a DTPA Soil Test for Zinc, Iron, Manganese, and Copper,” Soil Science Society of America Journal, Vol. 42, No. 3, 1978, pp. 421-428. doi:10.2136/sssaj1978.03615995004200030009x
- M. T. Olsson, M. Erlandsson, L. Ludin, T. Nilsson, Å. Nilsson and J. Stendah, “Organic Carbon Stocks in Swedish Podzol Soils in Relation to Soil Hydrology and Other Site Characteristics,” Silva Fennica, Vol. 43, No. 2, 2009, pp. 209-222.
- L. Molstad, P. Dorsch and L. R. Bakken, “Robotized Incubation Systems for Monitoring Gases (O2, NO, N2O, N2) in Denitrifying Cultures,” Journal of Microbiological Methods, Vol. 71, No. 3, 2007, pp. 202-211. doi:10.1016/j.mimet.2007.08.011
- H. Van de Werf and W. Verstrate, “Estimation of Active Microbial Biomass by Mathematical Analysis of Respiration Curves: Relation to Conventional Estimation of Total Biomass,” Soil Biology and Biochemistry, Vol. 19, No. 3, 1987, pp. 267-271. doi:10.1016/0038-0717(87)90008-3
- T. H. Anderson and K. H. Domsch, “Application of Eco-Physiological Quotients (qCO2 and qD) on Microbial Biomass from Soils of Different Cropping histories,” Soil Biology and Biochemistry, Vol. 25, No. 3, 1990, pp. 393- 395. doi:10.1016/0038-0717(93)90140-7
- E. D. Vance, P. C. Brookes and D. S. Jenkinson, “An Extraction Method for Determining Soil Microbial Biomass C,” Soil Biology and Biochemistry, Vol. 19, No. 6, 1987, pp. 703-707. doi:10.1016/0038-0717(87)90052-6
- P. C. Brookes, A. Landman, G. Pruden and D. S. Jenkinson, “Chloroform Fumigation and the Release of Soil Nitrogen: A Rapid Direct Extraction Method to Measure Microbial Biomass Nitrogen in Soil,” Soil Biology and Biochemistry, Vol. 17, No. 6, 1985, pp. 837-842. doi:10.1016/0038-0717(85)90144-0
- R. C. Barreto, E. M. Beata, E. L. M. John, L. O. A. M. Pedro, T. Eleno, F. Julio and R. C. Adriana, “The Impact of Soil Management on Aggregation, Carbon Stabilization and Carbon Loss as CO2 in the Surface Layer of A Rhogic Ferralsol in Southern Brazil,” Agricultural Ecosystem and Environment, Vol. 132, No. 3-4, 2009, pp. 243-251. doi:10.1016/j.agee.2009.04.008
- Range Land Soil Quality. http://www.nature.nps.gov/geology/soils/Docs/Factsheet/Rangeland/Aggregate_Stability.pdf
- W. Tena and S. Beyene, “Identification of Growth Limiting Nutrients (s) in Alfisols: Soil Physico-Chemical Properties, Nutrient Contents and Biomass Yield of Maize,” American Journal of Plant Nutrition and Fertilizer Technology, Vol. 1, No. 1, 2011, pp. 23-35. doi:10.3923/ajpnft.2011.23.35
- S. W. Buol, R. J. Southard, R. C. Graham and P. A. McDanie, “Soil Genesis and Classification,” 5th Edition, Iowa State Press, 2003.
- J. Hassink, “Effect of Soil Texture on the Size of Microbial Biomass and the Amount of C and N Mineralized Per Unit of Microbial Biomass in Dutch Grassland Soils,” Biochemistry, Vol. 26, No. 11, 1994, pp. 1573-1581.
- R. H. Azooz, M. A. Arshad and A. J. Franzlubbers, “Pore Size Distribution and Hydraulic Conductivity Affected by Tillage in Northwestern Canada,” Soil Science Society of America Journal, Vol. 60, No. 4, 1996, pp. 1197-1201. doi:10.2136/sssaj1996.03615995006000040034x
- K. E. Dobbie and K. A. Smith, “The Effect of Temperature, Water-Filled Pore Space, and Land Use on N2O Emissions from an Imperfectly Drained Gleysol,” European Journal of Soil Science, Vol. 52, No. 4, 2001, pp. 667-673. doi:10.1046/j.1365-2389.2001.00395.x
- S. Saggar, G. W. Yeates and T. G. Shepherd, “Cultivation Effects on Soil Biological Properties, Microfauna and Organic Matter Dynamics in Eutric Gleysol and Gleyic Luvisol Soils in New Zealand,” Soil Tillage Research, Vol. 58, No. 1, 2001, pp. 55-68. doi:10.1016/S0167-1987(00)00184-7
- A. Demessie, B. R. Singh, R. Lal and T. Børresen, “Effect of Eucalyptus and Coniferous Plantations on Soil Properties in Gambo District, Southern Ethiopia,” Acta Agrictulturae Scandinavia Section B—Soil and Plant Science, Vol. 62, No. 5, 2012, pp. 455-466.
- G. Abera, “Carbon and Nitrogen Transformations under Drought Stress: Implications for Nitrogen Delivery to NonLeguminous Crops in Seasonally Dry Tropical Climate,” Ph.D. Thesis, Norwegian University of Life Science, Norway, 2012.
- R. Dalal and K. Y. Chan, “Soil Organic Matter in Rained Cropping Systems of Australian Cereal Belt,” Australian Journal of Soil Research, Vol. 39, No. 3, 2001, pp. 435- 464. doi:10.1071/SR99042
- J. Balesdent, E. Besnard, D. Arrouays and C. Chenu. “Dynamics of Organic Matter in Particle Size Fractions in a Forest-Cultivation Sequence,” Plant Soil, Vol. 201, No. 1, 1998, pp. 49-57. doi:10.1023/A:1004337314970
- B. T. Christensen, “Carbon in Primary and Secondary Organomineral Complexes,” In: M. R. Carter and B. A. Stewart, Eds., Structure and Organic Matter Storage in Agricultural Soils, CRC Press, Inc., Boca, Raton, 1996, pp. 97-165.
- J. A. Baldock and J. O. Skjemstad, “Role of the Soil Matrix and Minerals in Protecting Natural Organic Materials Against Biological Attack,” Organic Geochemistry, Vol. 31, No. 7, 2000, pp. 697-710. doi:10.1016/S0146-6380(00)00049-8
- W. Nazif, S. Perveen and I. Saleem, “Status of Micronutrients in Soils of District Bhimber (Azad Jammu and Kashmir),” Journal of Agriculture and Biological Science, Vol. 1, No. 1, 2006, pp. 35-40.
- T. Chibsa and A. Ta’, “Assessment of Soil Organic Matter under Four Land Use Systems in the Major Soils of Bale Highlands, South East Ethiopia. B. Factors affecting Soil Organic Matter Distribution,” World Journal of Agricultural Science, Vol. 6, No. 11, 2009, pp. 1506-1512.
- R. L. Parfitt, B. K. G. Thng, J. S. Whitton and T. G. Sheperd, “Effects of Clay Minerals and Land Use on Organic Matter Pools,” Soil Science Society of America Journal, Vol. 48, No. 1-2, 1997, pp. 305-311.
- D. Jonathan, “Nitrogen Mineralization Potential in Important Agricultural Soils of Hawaii,” Soil and Crop Management, 2006. http://www.ctahr.hawaii.edu/deenikj/Downloads/SCM-15.pdf
- D. Dimoyiannis, “Wet Aggregate Stability as Affected by Excess Carbonate and Other Soil Properties,” Land Degradation and Develeomepnt, Vol. 23, No. 5, 2012, pp. 450-455. doi:10.1002/ldr.1085
- M. E. Reginald, A. Rajkumar, G. Joshy, R. C. Lal and S. A. Vetrivel, “Soil Biological and Biochemical Response to Cd Exposure,” Open Journal of Soil Science, Vol. 1, No. 1, 2011, pp. 8-15. doi:10.4236/ojss.2011.11002
NOTES
*Corresponding author.